The evolution of electrocardiographic changes in patients with Duchenne muscular dystrophies
Article information
Abstract
Purpose
Myocardial dysfunction and dysrhythmias are inevitable consequences of Duchenne muscular dystrophy. We aimed to evaluate specific trends of electrocardiographic changes that reflect the progress of cardiomyopathy in patients with Duchenne muscular dystrophy.
Methods
Fifty electrocardiograms (ECGs) of 30 patients (ages 1 to 27 years) who had not been prescribed medications for heart failure treatment at the time of examination were retrospectively analyzed and compared with 116 ECGs of age-matched healthy 116 controls. Heart rate, leads with fragmented QRS (fQRS), corrected QT, Tpeak-to-Tend, and Tpeak-to-Tend/QT were analyzed.
Results
The patients with Duchenne muscular dystrophy failed to show a normal age-related decline in heart rate but showed an increasing trend in the prevalence of fQRS, corrected QT, corrected Tpeak-to-Tend, and Tpeak-to-Tend/QT over time. In the ≤10-year-old patient group, a significant difference was found only in the prevalence of fQRS between the patients and the controls. The prevalence of fQRS, heart rate, Tpeak-to-Tend/QT, and corrected Tpeak-to-Tend demonstrated significant differences between the patients and the controls in the middle age group (11 to 15 years old). All the indexes were statistically significantly different in the ≥16-year-old patient group.
Conclusion
The prevalence of lead with fQRS representing regional wall motion abnormalities was higher in the young patients than in the young healthy controls, and this might be one of the first signs of myocardial change in the patients. Markers of depolarization and repolarization abnormalities were gradually prominent in the patients aged >10 years. Further studies are needed to confirm these findings.
Introduction
Duchenne muscular dystrophy is a progressive disease with musculoskeletal problems caused by a dystrophin gene mutation. Abnormalities in the dystrophin-glycoprotein complex lead to progressive myofibril necrosis and cardiac muscle fibrosis resulting in a thinning of the ventricular wall and decreased contractility. Dilated cardiomyopathy and related problems which are the leading cause of death in the patients has typically occurred after 15 years of age after a lengthy subclinical phase12).
There have been several studies characterizing electrocardiographic manifestations of cardiac involvement in patients with Duchenne muscular dystrophy34). Nevertheless, most of the reported findings are nonspecific, and electrocardiographic changes specifically reflecting the progress of the cardiac involvement or the risks of arrhythmias and cardiac death have not been extensively investigated. We were to evaluate specific trends of electrocardiographic changes reflecting the progress of cardiomyopathy and risks of cardiac dysrhythmias and sudden cardiac death in the naturally progressing cardiac diseases in patients with Duchenne muscular dystrophy.
Materials and methods
1. Study population
This study enrolled 30 patients with Duchenne muscular dystrophy by the department of Rehabilitation medicine, and observed by the Pediatric Cardiology clinic.
Fifty electrocardiograms among the 30 patients (mean age at the examination of 13.00±4.59 years; range 1 to 27 years) and 116 electrocardiograms of age-matched healthy 116 controls were retrospectively analyzed and compared. We included all the electrocardiograms checked at a period of more than 1 year from the same patient (1.81±1.11/patient). We excluded electrocardiograms of patients who already have been prescribed medications like beta-blockers, angiotension-converting-enzyme inhibitors, or angiotension-receptor antagonists to delay the development of cardiac disease at the time of the examination. The Institutional Review Board approved the present study. To analyze age-related differences, we further classified the electrocardiograms based upon age at the time of electrocardiogram analysis into 1 to 10 years old (n=14), 11 to 15 years old (n=25), and more than 15 years old (n=11) group. Thirty-five serial electrocardiograms from 11 patients were further analyzed for longitudinal changes of electrocardiogram indices over time.
2. Electrocardiogram analyses
All patients had standard 12-lead electrocardiograms (filter range, 0.05 to 100 Hz) with a paper speed of 25 mm/sec. A single observer blinded to the name of the patient or control, and the protocol of the present study analyzed all electrocardiograms.
We analyzed 5 specific electrocardiographic indices; (1) resting heart rate, (2) marker of regional myocardial damage represented by the number of electrocardiogram lead showing fragmented QRS (fQRS) complex, (3) corrected QT interval, (4) Tpeak-to-Tend interval, and (5) Tpeak-to-Tend/QT ratio. The last three consecutive indices represent the degree of dispersion of cardiac repolarization, which have been connected to the risk of lethal tachyarrhythmias and sudden cardiac death56).
3. Definition
The fQRS was defined by the presence of an additional R wave (R') or notching in the nadir of the R-wave or the S-wave, or the presence of more than one R' without a typical bundle branch block7). A notch on an R or S wave was defined as a definite but transient reversal of direction of the main deflection (Fig. 1). Only “one fQRS” alone was not accepted for the presence of fQRS. In such cases, fQRS was defined as being absent. The QT interval was measured as the time from the earliest onset of the QRS complex to the point at which the downward slope of the T-wave returned to baseline and the interval was corrected for the heart rate with the Bazett's QT interval correction formula. The Tpeak-to-Tend interval was calculated in precordial lead V5 as the time from the highest point of the T-wave to the end of the T-wave where the downward slope of T-wave intersects the isoelectric baseline89). The Tpeak-to-Tend intervals were also corrected for the heart rate. Based upon them, Tpeak-to-Tend/QT ratio was calculated6).

(A) Electrocardiography (ECG) of an 11-year-old patient showing fragmentation of the QRS complex at I, aVL, V1, and V2, and (B) follow-up ECG in a 14-year-old patient showing increased prevalence of fragmented QRS (I, aVR, aVL, V1, V2, and V3). Different types of notched and fragmented QRS patterns are indicated by arrowheads (RSr´, rSr´, and rSR´) and arrows (notched R upstroke and notched S downstroke).
4. Statistical analysis
Data were analyzed using PASW Statistics 18 (SPSS Inc., Chicago, IL, USA) and SAS 9.2 (SAS Inc., Cary, NC, USA). Pearson correlation analyses were conducted to find any correlation between age and the electrocardiographic variables. The independent samples t test was used to compare variables between each patient group by age and age-matched healthy control group. A linear mixed model with a random slope plus a random intercept was used to investigate heart rate, fQRS, corrected-QT, Tpeak-to-Tend interval, Tpeak-to-Tend/QT ratio over time. The average values and intervals were specified as ±standard deviation (SD). The difference was considered to be significant if the P value was below 0.05.
Results
1. Demographic data
Demographic features and clinical characteristics of the patients' electrocardiograms are listed in Table 1. All of 30 patients were found with fQRS while 7 were present in the control group. A total of 50 electrocardiograms from 30 patients with Duchenne muscular dystrophy were obtained for analysis. Eleven patients of them had more than two serial electrocardiograms checked at a period of more than 1 year. Ages at the time of the examination ranged from 1 to 27 years (mean±SD, 13.0±4.59 years).

Baseline characteristics
2. Changing trend of the electrocardiographic indices according to age
The control electrocardiograms showed a statistically significant age-related decline in heart rate (r=-0.487, P=0.000), although electrocardiograms from patients with Duchenne muscular dystrophy did not exhibit the age-related fall in heart rate but instead an increase in heart rate (r=-0.058, P=0.663) (Fig. 2).
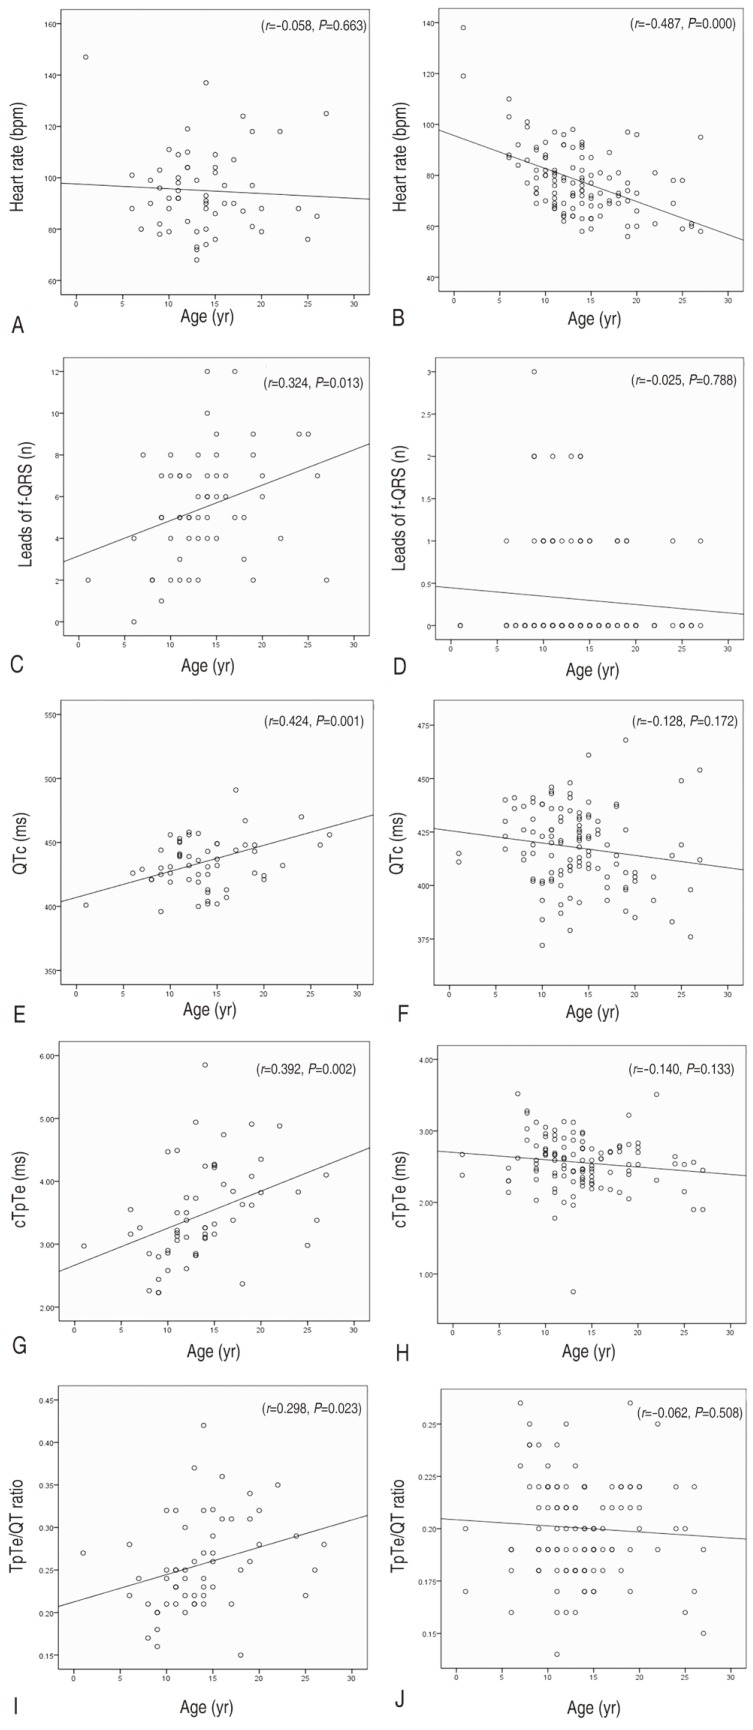
Trend of the electrocardiogram indexes according to age: age versus heart rate in the patients (A) and the controls (B); age versus the prevalence of fQRS in the patients (C) and the controls (D); age versus QTc in the patients (E) and the controls (F); age versus cTpTe in the patients (G) and the controls (H); age versus TpTe/QT ratio in the patients (I) and the controls (J). TpTe/QT, Tpeak-to-Tend/QT; QTc, corrected QT interval; cTpTe, corrected Tpeak-to-Tend interval; fQRS, fragmented QRS.
We also investigated the changing trend of other electrocardiographic variables reflecting the progress of cardiomyopathy and risks of cardiac dysrhythmias, and sudden cardiac death, and compared with that of the healthy control electrocardiogram. There were no significant age associated alterations in the number of electrocardiogram lead with fQRS, corrected-QT, corrected Tpeak-to-Tend interval, and Tpeak-to-Tend/QT ratio for the healthy control electrocardiogram. In contrast, electrocardiograms from patients showed a statistically significant age-related increase in the number of electrocardiogram lead with fQRS (r=0.324, P=0.013), which is a marker of regional myocardial damage. Among indices representing dispersion of cardiac repolarization, corrected-QT interval (r=0.424, P=0.001) and corrected Tpeak-to-Tend interval (r=0.392, P=0.002) demonstrated apparent age-associated prolongation. Tpeak-to-Tend/QT ratio also showed similar age-associated alterations, but the significance was weaker than that of other indices (r=0.298, P=0.023) (Fig. 2).
3. Comparison of electrocardiographic variables in the same age group
In each 3 age group, we further investigated any differences of the variables between electrocardiograms of patients and that of controls. In the youngest age group (1 to 10 years old), there was a substantial difference (P<0.0005) for the number of electrocardiogram lead with fQRS between patients (n=14; mean±SD, 4.07±2.67) and controls (n=28; mean±SD, 0.43±0.79), but not for the heart rate, corrected-QT interval, Tpeak-to-Tend/QT ratio or corrected Tpeak-to-Tend interval (Table 2). Whilst, in the mid-age group (11 to 15 years old; 25 patients' electrocardiograms and 56 controls' electrocardiograms), not just the number of electrocardiogram lead with fQRS, but also other indices like heart rate, Tpeak-to-Tend/QT ratio and corrected Tpeak-to-Tend interval demonstrated a substantial difference between patients' electrocardiograms and controls' electrocardiograms. All of the indices were statically different in the oldest group (≥16 years old; 11 patients' electrocardiograms and 32 controls' electrocardiograms (Table 2).

Subgroup comparison
4. Longitudinal data on changes of electrocardiogram indices over time
From the linear mixed model for 11 patients' serial electrocardiograms, it was shown that heart rate (Δ1.54/yr, P=0.026), Tpeak-to-Tend/QT ratio (Δ0.0074/yr, P=0.005), corrected Tpeak-to-Tend interval (Δ0.11 ms/yr, P=0.003) and lead with fQRS (Δ0.28/yr, P=0.006) increased over time (Table 3).

Changes of electrocardiography indices over time
Discussion
It is generally accepted that progressive cardiac changes in Duchenne muscular dystrophy start at a very young age as a preclinical or intermediate stage1011), and almost all of the patients have experienced dilated cardiomyopathy by the second decade of their lives. In this study, we demonstrated trend of specific electrocardiographic changes by age.
There have been several studies characterizing elevated resting heart rate or lack of normal age-related heart rate decline in patients with Duchenne muscular dystrophy312). Thomas et al.12) demonstrated that the elevated resting heart rate correlated well with the onset of cardiomyopathy, they postulated that the elevated resting heart rate may be a form of abnormal heart rate variability implicating autonomic dysfunction which is associated with myocardial fibrosis13). Similar to features reported in previous studies, our results demonstrated a higher resting heart rate in patients of more than 10 year old than in age-matched control subjects. In addition, the Duchenne muscular dystrophy patients showed a lack of normal age-related heart rate decline, which was different from the control subjects.
Several studies have revealed that electrocardiogram has the potential to detect cardiac involvement before the onset of clinical symptoms. In a study with 78 young Duchenne muscular dystrophy patients (<6 years of age), electrocardiographic abnormalities precede the development of cardiac dysfunction were identified in 78%314). Some typical electrocardiograms changes characterized by previous studies are short PR interval, abnormal Q-waves, and ST depression3415). Apparently, the findings may be evidence revealing a cardiac involvement in patients with Duchenne muscular dystrophy. However, they are generally nonspecific; they cannot provide clinical significance regarding the risk for malignant cardiac dysrhythmias and sudden cardiac death. In this study, we adapted 4 specific electrocardiographic indices of arrhythmogenesis accepted in various cardiac conditions such as long and short QT syndrome, Brugada syndrome, arrhythmogenic right ventricular dysplasia, and myocardial infarction.
In various conditions, fQRS has been regarded as a marker of inhomogeneous activation of the ventricles related with myocardial scar, and has been linked to the risk for ventricular tachyarrhythmias and sudden death1617). Recently, Canpolat et al.1617) reported that electrocardiogram leads with fQRS in arrhythmogenic right ventricular dysplasia was higher in patients with arrhythmic events. In this study, in order to detect the extent of myocardial fibro-fatty change indirectly, we evaluated the prevalence of fQRS on 12-lead electrocardiogram. Interestingly, the prevalence of fQRS showed a significant increasing trend with age in the patients with Duchenne muscular dystrophy (Fig. 1). In addition, significantly higher prevalence of the fQRS was observed even in the youngest patient group (1- to 10-year-old group) compared to normal control in our study. The existence and the prevalence of the fQRS may reflect progressive myocardial fibrosis in Duchenne muscular dystrophy patients, and may be an early marker of myocardial involvement, precede the clinically apparent elevated resting heart rate. We speculate that evaluating the existence and prevalence of the fQRS may be of value in the early detection of the preclinical myocardial involvement in the patients with Duchenne muscular dystrophy.
In this study, we evaluated 3 specific electrocardiographic indices implicating risks of tachyarrhythmia and cardiac death; corrected-QT interval, corrected Tpeak-to-Tend interval, and Tpeak-to-Tend/QT ratio. As the corrected-QT is an electrocardiographic marker of ventricular de- and repolarization, prolongation of the corrected-QT is a well-known risk factor for the occurrence of malignant cardiac dysrhythmias and sudden cardiac death in general18). The Tpeak-to-Tend interval reflects spatial and transmural dispersion of repolarization19). As the Tpeak-to-Tend interval means a gradient of action potential duration from endo-to epicardial cells, a prolongation of the Tpeak-to-Tend interval or the corrected Tpeak-to-Tend interval has been associated with ventricular arrhythmias and an increased risk for sudden cardiac death2021). Likewise, amplification of the Tpeak-to-Tend/QT ratio serves as another arrhythmogenic index in variety of cardiac conditions such as long QT syndrome, Brugada syndrome, and other organic heart disease. Normally, it remains relatively constant between 0.15 and 0.25 despite dynamic changes in heart rate6). Our results about the 3 indices for the dispersion of cardiac repolarization demonstrated an increasing trend of the values by age. The findings may suggest progressive increasing risk of cardiac dysrhythmias or sudden death in patients with Duchenne muscular dystrophy; this hypothesis needs to be evaluated in further studies.
As many of the electrocardiograms for this study were collected retrospectively, comparison of electrocardiographic changes with clinical course such as echocardiographic change was not possible. Future prospective studies of larger patient populations would be needed to validate our findings.
In conclusion, despite of the early progressive cardiac changes in patients with Duchenne muscular dystrophy, they may easily be underdiagnosed by echocardiography, as the method is capable of detecting later stages of cardiac involvement characterized by wall motion abnormalities. The presence and progress of fQRS may be a useful marker of cardiac involvement for detection and follow-up. Electrocardiographic evidence of repolarization abnormalities implicating the risks of cardiac dysrhythmias and sudden cardiac death was gradually prominent in patients with Duchenne muscular dystrophy over the 10 year olds. Large scale prospective studies are needed to confirm those indices as a risk stratifying tool of malignant arrhythmias and sudden cardiac death.
Acknowledgments
This study was supported by the Biomedical Research Institute, Pusan National University Hospital. We acknowledge assistance with statistical analysis from Pusan National University Hospital Clinical Trial Center Biostatistics Office.
Notes
Conflict of interest: No potential conflict of interest relevant to this article was reported.


