Multimodal neuroimaging in presurgical evaluation of childhood epilepsy
Article information
Abstract
In pre-surgical evaluation of pediatric epilepsy, the combined use of multiple imaging modalities for precise localization of the epileptogenic focus is a worthwhile endeavor. Advanced neuroimaging by high field Magnetic resonance imaging (MRI), diffusion tensor images, and MR spectroscopy have the potential to identify subtle lesions. 18F-FDG positron emission tomography and single photon emission tomography provide visualization of metabolic alterations of the brain in the ictal and interictal states. These techniques may have localizing value for patients which exhibit normal MRI scans. Functional MRI is helpful for non-invasively identifying areas of eloquent cortex. These advances are improving our ability to noninvasively detect epileptogenic foci which have gone undetected in the past and whose accurate localization is crucial for a favorable outcome following surgical resection.
Introduction
Surgery for treatment of epilepsy has emerged as an important option for treatment of children with epilepsy that is refractory to antiepileptic drug management. The causes of intractable childhood epilepsy are quite variable, and in pediatric candidates for epilepsy surgery, focal cortical dysplasia (FCD) is the predominant etiology1). A presurgical evaluation starts with a complete seizure history, physical and neurological examinations, video-EEG monitoring, and high-resolution magnetic resonance imaging (MRI) of the brain to assess structural abnormalities2). These investigations are complemented by interictal and ictal single photon emission tomography (SPECT) injection, interictal 18F-fluorodeoxyglucose (FDG) positron emission tomography (PET), and neuropsychological examination. The cornerstone of successful surgery is accurate localization of the brain region responsible for the onset of seizure. Modern imaging techniques have therefore been improved for the detection of epileptogenic lesions, which frequently evolve to secondary generalized epileptic encephalopathy3).
In this review, we describe the current role of structural and functional brain imaging modalities for presurgical evaluation of patients with intractable childhood epilepsy with a focus on FCD.
Structural neuroimaging
MRI is an essential neuroimaging tool which is used to assist in the identification of an epileptogenic substrate. FCD is a common cause of pharmacoresistant epilepsy that is amenable to surgical resective treatment. The identification of structural FCD by MRI can contribute to the detection of the epileptogenic zone and improve the outcome of epilepsy surgery. MRI epilepsy protocols that include specific T1 and T2 weighted, and fluid-attenuated inversion recovery (FLAIR) sequences give complementary information about the characteristic imaging features of FCD; focal cortical thickening, blurring of the gray-white junction, high FLAIR signal, and gyral anatomical abnormalities4). Conventional spin-density or fast multiplanar inversion-recovery images may give better delineation of the gray-white interface5). The heavily T2-weighted FLAIR sequence enables detection of more subtle signal abnormalities in the superficial cortical, subcortical, and periventricular regions due to suppression of the cerebrospinal fluid (CSF) signal. Limitations of the FLAIR technique include the occurrence of CSF pulsation artifacts in the basilar cisterns, relative suppression of contrast between gray and white matter, and limited usefulness in children under the age of 2 years (whose images may show patchy areas of hyperintensity within normal white matter)6). The use of gadolinium diethylenetriamine-pentaacetic acid (Gd-DTPA) contrast agents does not provide additional information in the evaluation of FCD. Information derived from the patient's history and video-EEG monitoring is often used in the interpretation of imaging studies and this information may be used to modify the MRI protocol, for example, to provide thin cuts through the suspected lobe of origin7). In the presence of FCD, however, removal of the visible lesion alone frequently does not lead to freedom from seizures. This indicates that the epileptogenic zone extends beyond the tissue which can be visualized with current structural imaging modalities. For this reason, there has been ongoing interest in utilizing new advanced MRI techniques to improve our ability to identify subtle lesions of cortical dysplasias. Technological advances such as the development of multichannel coils (32 phased array and beyond) and higher magnetic field strengths (3 T, 7 T, and greater) are likely to increase yield. The 3 T scans revealed different lesions which were not visible in the 1.5 T scans. Patients can benefit most from 3 T scans when a dysplasia is suspected8). The combination of 3 T and scans with the use of a specific phased-array head coil further increases the visualization of an MRI abnormality in presurgical epilepsy evaluation9).
Functional Neuroimaging
Functional imaging detects changes in cerebral metabolism or cerebral perfusion in the interictal or ictal state. Nuclear medicine plays an important role in the presurgical assessment of patients with refractory epilepsy. Correct localization of the ictal onset zone with the use of SPECT or PET is associated with an improved surgical outcome. Quantitative processing of structural MR data and advanced MRI such as diffusion tensor imaging and MR spectroscopy have the potential to identify subtle lesions.
1. Positron-emission tomography (PET)
Hypometabolism identified by FDG-PET has been ascribed to factors such as neuronal loss, diaschisis, inhibitory processes, reduction in synaptic density, or decreased blood-brain barrier glucose transporter activity10-12). Interictal 18F-FDG-PET is routinely used to detect brain areas of hypometabolism, which usually encompass the seizure onset zone and can also extend beyond this zone13). Thus, 18F-FDG PET has lateralizing rather than localizing value in temporal lobe epilepsy (TLE). However, because of the poor resolution of this imaging modality, the focus may in fact be at the margin of the area of hypometabolism. A recent report14) has demonstrated that co-registering or fusing the PET data with the structural MRI can improve the ability to identify subtle cortical dysplasias. Such studies have demonstrated that in patients with previously MR-negative test results, the fusion information helped to identify lesions, guide surgical planning, and improve overall surgical outcomes. The presence of contralateral cortical hypometabolism predicts a low chance of seizure freedom after temporal lobectomy15) and the extent of resection of brain areas with hypometabolism on FDG-PET is correlated with improved seizure outcome16). The localizing value of FDG-PET in neocortical epilepsy was significantly worse in patients with extratemporal epilepsy, relative to patients with TLE17). Also, for assessment of FDG-PET, it is advisable to use an automated technique to compare the patient's images to normal data images in a database in addition to visual interpretation of the images, since automated techniques have proven to be more accurate. A semi-automated method for assessment of asymmetries in the brain cortex was developed which compares activity concentrations in homotopic cortical areas18). When these differences exceed a predefined threshold, the areas with lower activity are marked and 3-dimensional surface rendered images are created to guide placement of intracranial electrodes (ECoG). This step is followed by surgical resection. The sensitivity-specificity pairs for correct localization of epileptogenic lobes based on the ECoG results were found to be best for the 15% threshold (80/94%, accuracy 0.90)18). This objective PET method enables accurate determination of cortical asymmetries, and it has proven to be highly efficient in guiding epilepsy surgery.
Although 18FDG, a glucose analog, has been the most common radiotracer nuclide used in PET imaging, it is possible to perform PET imaging with other radiotracers. For example, flumazenil, a benzodiazepine antagonist that acts as a competitive inhibitor against the γ-aminobutyric acid (GABA)A receptor, can be labeled with a 11carbon (11C) radiotracer which has a considerably shorter half-life. Because GABAA is the principal inhibitory neurotransmitter in the brain, its role in epilepsy is of ongoing interest. Reports have suggested that, relative to 18FDG-PET, flumazenil provides improved localization and better correlation with the epileptogenic focus19, 20). Another ligand of interest is 11C-alpha-methyl-l-tryptophan (11C-AMT), an analog of tryptophan and a precursor to serotonin. This ligand has also been reported to be specific for differentiating epileptogenic from nonepileptogenic foci in patients with intractable epilepsy with or without tuberous sclerosis complex21). Resection of tubers with increased AMT uptake is highly desirable to achieve a seizure-free surgical outcome in children with tuberous sclerosis complex and intractable epilepsy. AMT PET can provide independent complementary information regarding the localization of epileptogenic regions in tuberous sclerosis complex and enhance the confidence of patient selection for successful epilepsy surgery22). The combination of some of these or other novel radioligands with PET-MRI technology may increase the rate of detection of FCD. However, these tracers are not widely available and the superiority of studying these receptor systems over glucose metabolism in the presurgical evaluation of patients with refractory epilepsy remains to be proven. Their use in clinical practice is currently limited23).
2. Single Photon Emission Computed Tomography (SPECT)
Ictal SPECT typically indicates areas of regional hyperperfusion, which reflects relative hypermetabolism in parts of the brain involved in onset or propagation of seizure24). Subtraction of the interictal images from the ictal images and co-registration to the patient's MRI (SISCOM) improves the interpretation of the study25). SISCOM has proven to be more sensitive and more specific compared with visual assessment. The importance of early tracer injection after the beginning of the seizure cannot be overemphasized. It has been shown that an injection delay of less than 20 seconds is significantly correlated with a correct localization. With early injections, the largest and most intense cluster is more likely to represent the seizure onset zone and not propagation of the seizure26). The interpretation of automatically-generated SISCOM data is generally straightforward. The result of the SISCOM analysis must be concordant with the result of the visual comparison of the ictal and interictal images, and other data related to the presurgical evaluation. Furthermore, SISCOM may provide a false negative test result because of subclinical seizure activity at the moment of tracer injection for interictal SPECT imaging26). Therefore, EEG monitoring during the interictal injection should be routinely performed. PET results were similarly reliable in lateralizing the temporal epileptic area, while its efficacy was lower for extratemporal cases. SISCOM was found to effectively localize lesions in extratemporal cases, but its efficacy is lower in temporal lesions27).
3. Magnetic resonance spectroscopy (MRS)
Reduced 1H-MRS N-acetyl aspartate over choline (NAA/Cho) and N-acetyl aspartate over creatine (NAA/Cr) have been demonstrated in FCD. Large increases in GABA, alanine, tyrosine, acetate, inositol, glucose, and lactate, as well as decreased NAA were found in a group of four patients with "mild" cortical dysplasia28). These findings may reflect underlying regional structural abnormalities under the resolution of conventional MRI. Alternatively, decreases in N-acetyl aspartate may reflect neuronal or glial cell dysfunction29). The clinical utility of MRS in the evaluation of FCD is not known because MRS is limited by spatial sampling and the above findings are non-specific for FCD. Reduced NAA/Cho ratios outside the epileptogenic region have been reported in temporal lobe epilepsy, and correlate with reductions in seizure-free outcomes after surgery30). However, there are no data supporting this observation in an FCD setting. The sensitivity and specificity of MRS for detecting FCD has not been systematically studied. In another study, preoperative reductions in the NAA/Cr ratio in the non-operated temporal lobe or the presence of higher metabolic ratios contralateral to the proposed surgery are associated with surgical failure. The predictive value of 1H MRSI absolute metabolite concentrations for outcome in mesial temporal lobe epilepsy requires further investigation.
4. Diffusion tensor imaging (DTI)
DTI measures the molecular motion of water within brain tissue. The diffusivity (a measurement of the amplitude of the diffusional motion) and anisotropy (a measurement of the directionality of the motion) can be calculated from the DTI sequence. In the physiologic state, the diffusion of water is restricted by cell membranes. In the white matter, water diffusion is typically highly anisotropic. This characteristic is used in the reconstruction of white matter tracts using tractography31) . The principal diffusion direction of the brain structure to be examined can be color-coded, resulting in color-coded maps or directionally encoded fractional anisotropy (FA) maps. In these maps, the fibers have been given different colors (blue for superior-inferior, green for anterior-posterior and red for left to right) depending on their direction of diffusion. DTI has also been investigated in terms of its use in differentiating pathologic tissue from normal tissue based on differences in the anisotropic diffusion of water32). Several investigations using DTI have revealed higher diffusivity and lower anisotropy in the zones of FCD33), and in surrounding brain tissue that appeared normal in conventional MRI34). Although clinical experience with DTI in the presurgical evaluation of epilepsy is limited, two cases have been published so far where surgery was aided by DTI abnormalities35, 36). DTI may prove valuable for identifying epileptogenic foci as well as more optimally defining the extent of the lesion for surgical resection. In addition, the molecular diffusion of water is typically highly anisotropic in white matter tracts. This characteristic is being explored for reconstruction of fiber tracts using tractography37). The first data set of patients with FCD suggests that there are decreased fiber bundle densities adjacent to an area of FCD38). Fiber tractography will improve our understanding of brain pathology, especially that of white-matter abnormalities. Fiber tracking can be used in conjunction with functional MRI to analyze the anatomical connections and functional pathways for diagnostic purposes and presurgical planning39). The usefulness for DTI and tractography in various pathologies, including FCD, will be in the detection and full delineation of structural abnormalities, and in determining both the functional connectivity of a given area of the cortex and the spatial relationship between the lesion and important white matter tracts. This information may provide critical information for the planning of resective surgery in order to reduce functional morbidity. However, further improvements in techniques and stable post-processing analyses are needed to increase the utility of DTI in clinical applications.
5. Functional MRI (fMRI)
Identification of eloquent areas of cortex responsible for speech, motor, and visual function, to assist in the surgical resection plan, can be obtained non-invasively through the use of fMRI. Functional MRI identifies changes in cerebral blood flow by measuring MRI contrast differences between oxygenated and deoxygenated hemoglobin. Increased cerebral blood flow is thought to represent functional activation of the surrounding cortex. Primary sensorimotor areas can be readily identified non-invasively by fMRI, and the results correlate well, but not perfectly, with those of cortical stimulation and evoked potentials40-43) .A major role of fMRI in epilepsy surgery work-up is in lateralizing language functions as a means to supplement or replace the intracarotid amobarbital test. A panel of tasks, including verbal fluency and language comprehension, has been advocated to increase the reliability of fMRI44). This modality also predicted language deficits following epilepsy surgery45) and could influence surgical planning. The correlation between fMRI with various neuropsychological tests and the intracarotid amybarbital procedure (IAP, Wada-test) to predict memory decline after temporal lobectomy46) and to determine the language dominant hemisphere has been studied47).
The main limitation of fMRI is its suboptimal specificity. A significant percentage of the cortical areas that are "activated" during an fMRI paradigm are dispensable for that specific function. Further work is therefore needed to clarify the role of fMRI in localizing eloquent cortex. At present, this method must be considered a research tool rather than part of the routine diagnostic workup of patients undergoing epilepsy surgery.
Conclusions
The likelihood of benefiting from surgical treatment was found to be significantly higher if localization with more imaging modalities were concordant with respect to the resected brain area (Fig. 1, 2). Developments in imaging technology and digital post-processing may increase the yield for imaging studies to detect the epileptogenic lesion and to characterize its connectivity within the epileptic brain. A better understanding of the concordant relationship between structural and functional neuroimaging data is expected to lead to new approaches in epilepsy surgery and will likely improve surgical management of a large number of patients suffering from intractable epilepsy.
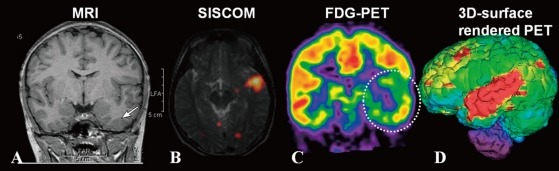
Convergent multimodal imaging in a 11-year-old boy with left temporal lobe epilepsy. Cortex thickening in the left temporal lobe is seen on the corresponding coronal T1W1 MRI. SISCOM demonstrated a cluster of hyperperfusion in the left temporal lobe, consistent with the patient's ictal EEG. 18-FDG PET shows reduced metabolism in the overlying cortex. All imaging data were concordant with electroclinical and neuropsychological data and the patient underwent a neocortical temporal lobectomy. The patient has since remained seizure-free. Histopathology after temporal lobectomy showed FCD type 2A.
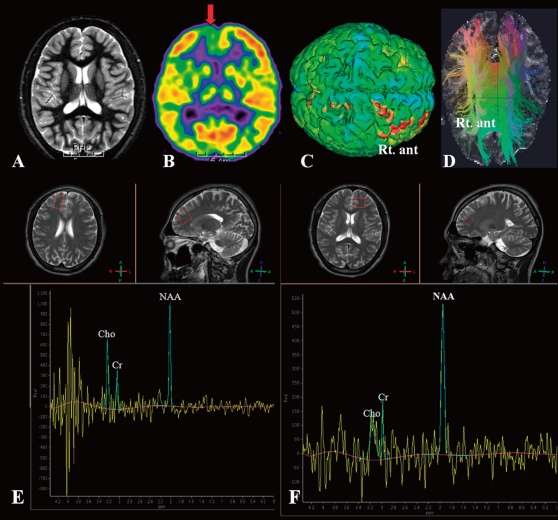
Multimodal imaging in a 17-year-old boy with Lennox-Gastaut syndrome. (A) The axial T2WI MRI is normal. (B) 18F-FDG PET shows asymmetric hypometabolism in the Rt. frontal area. (C) 3-dimensional surface-rendered images of a FDG PET scan shows hypometabolism in the same area (indicated by the red color) marked by the semiautomatic program for detecting cortical asymmetries. (D) Axia fiber tractography demonstrates decreased fiber bundle densities adjacent to an area of Rt. frontal lobe compared to the Lt. frontal lobe. Single-voxel MR spectra were acquired from both frontal areas. There is a reduction in NAA/choline, NAA/creatinine, and NAA in the right frontal pole (E) compared to that in the left frontal pole (F). The patient has remained seizure free after Rt. frontal lobectomy. Histopathology showed microdysgenesis.