Usefulness of serum cystatin C to determine the dose of vancomycin in neonate
Article information
Abstract
Purpose
The vancomycin dosage regimen is regularly modified according to the patient's glomerular filtration rate (GFR). In the present study, we aimed to assess the usefulness of serum cystatin C (Cys-C) concentration, compared with serum creatinine (SCr) concentration, for predicting vancomycin clearance (CLvcm) in neonates.
Methods
We retrospectively analyzed the laboratory data of 50 term neonates who were admitted to the neonatal intensive care unit and received intravenous vancomycin, and assessed the pharmacokinetic profiles. Creatinine clearance (CLcr) and GFR based on Cys-C (GFRcys-c) were estimated using the Schwartz and Larsson formulas, respectively.
Results
The mean CLvcm (±standard deviation) was 74.52±31.17 L/hr, the volume of distribution of vancomycin was 0.67±0.14 L, and vancomycin half-life was 9.16±17.42 hours. The SCr was 0.46±0.25 mg/dL and serum Cys-C was 1.43±0.34 mg/L. The peak and trough concentrations of vancomycin were 24.65±14.84 and 8.10±5.35 mcg/mL, respectively. The calculated GFR based on serum creatinine concentration (GFR-Cr) and GFRcys-c were 70.2±9.45 and 63.6±30.18 mL/min, respectively. The correlation constant for CLvcm and the reciprocal of Cys-C (0.479, P=0.001) was significantly higher than that for CLvcm and the reciprocal of SCr (0.286, P=0.044). GFRcys-c was strongly correlated with CLvcm (P=0.001), and the correlation constant was significantly higher than that for CLvcm and CLcr (0.496, P=0.001). Linear regression analysis showed that only GFRcys-c was independently and positively correlated with CLvcm (F=41.9, P<0.001).
Conclusion
The use of serum Cys-C as a marker of CLvcm could be beneficial for more reliable predictions of serum vancomycin concentrations, particularly in neonates.
Introduction
Vancomycin is glycopeptide antibiotics which is used to treat gram positive bacterial infection including methicillin-resistant Staphylococcus aureus (MRSA). In neonates, vancomycin is applied as an empirical antibiotics for those who have sepsis or line-related infection1). As vancomycin has narrow therapeutic range and the concentration-effect and concentration-toxicity of the drug is well established, it is recommended to apply therapeutic drug monitoring (TDM) in neonates2).
Vancomycin is eliminated from the body primarily by the way of glomerular filtration rate (GFR)3). So, dosing of the vancomycin is mainly determined by renal function, especially GFR. Schwartz formula is widely used GFR in pediatric patients including neonates, using serum creatinine. However, using the serum creatinine (SCr) level as a GFR-determining factor has several limitations due to age, muscle mass, and hydration status4). Moreover, SCr levels are not altered until there is a loss of 25% to 50% of kidney function and in neonates.
Serum Cystatin C (Cys-C) is endogenous GFR marker which is independent of muscle mass. It is produced by a housekeeping gene expressed in all nucleated cells at a constant rate and is freely filtered at the glomerulus with no tubular secretion. Furthermore, Cys-C is completely catabolized by the renal tubules and its plasma level is only dependent on the GFR5). The production of Cys-C is not affected by inflammatory condition6). In normal kidney, Cys-C is not reabsorbed to blood flow after GFR. The reciprocal of Cys-C has proven to strongly correlate with GFR which is superior to SCr. Several meta-analyses have shown that Cys-C is superior to SCr for the estimation of the GFR in children7).
However, the estimation of renal function using serum Cys-C in neonate is still on research stage. Also, application of Cys-C to drug TDM in neonate is not tried yet. This research is the first trial of applying GFR based on serum Cys-C to predict vancomycin clearance (CLvcm) in Korean neonate.
Materials and methods
1. Subjects
All data was collected at a Gangnam Severance Hospital neonatal intensive care unit from May 2008 to May 2013, retrospectively. We included term neonate patients who received vancomycin. Preterm infants, patients with congenital anomaly, and patients with liver or kidney disorder were excluded. Total patient number was 50 (35 males, 15 females) and their demographic characteristics and laboratory data are listed in Table 1.

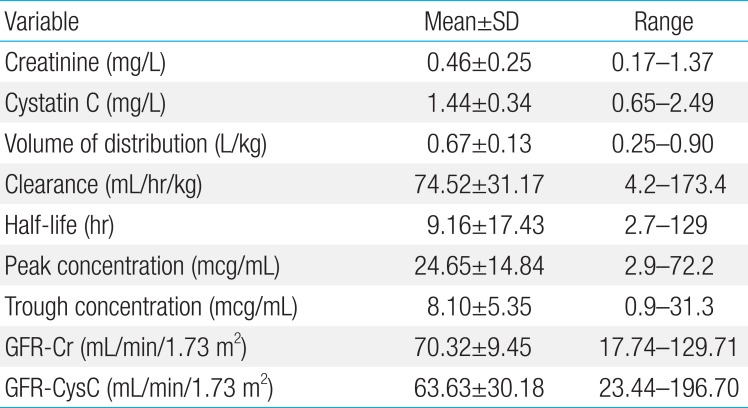
Demographic characteristics and biochemical parameters of patients
2. Vancomycin administration and sample collection
Vancomycin (10 mg/kg to 15 mg/kg of single dose) was administrated via intravenous infusion over 60 minutes with a dosage interval of 8 to 12 hours according to postmenstrual age of the patients. The blood sampling time of peak and trough vancomycin concentration were right before vancomycin infusion and 1 hour after the end of vancomycin infusion. All blood samples were collected in a steady state. Serum sample for Cys-C and SCr was drawn at one of the vancomycin sampling time. Other laboratory results including serum blood urea nitrogen, aspartate aminotransferase (AST), alanine aminotransferase (ALT), albumin, C-reactive protein were also obtained.
3. Laboratory analysis methods
Serum concentrations of vancomycin were analyzed by fluorescence polarization immunoassay methods (Abbott TDx analyzer, Abbott Laboratories, Abbott Park, IL, USA). This method has a coefficient of variation of less than 6% for between-day as well as within-run imprecision. The lower limit of detection was 2.0 µg/mL. SCr concentrations were measured by an enzymatic method (a kinetic picrate method in an alkaline medium in an Advia 1650 analyzer [Bayer HealthCare Ltd., Tarrytown, NY, USA]; OutoL MIZUHO CRE (N); [Mizuho Co., Saga, Japan]) using an autoanalyzer (HITACHI 7600, Hitachi Co., Tokyo, Japan). This method has a coefficient of variation of less than 3.0%, and the range of measurement is 0 to 100 mg/dL. Serum concentrations of Cys-C were determined using Latex immuno-turbidimetric assay using IatroCys-C (Mitsubishi Kagaku Iatron Co., Tokyo, Japan) with an auto-analyzer (HITACHI 7170, Hitachi Co., Tokyo, Japan). This method has a coefficient of variation of less than 10% in the range of 0.1 to 8.0 mg/L. Reference range of Cys-C were 0.65-1.10 mg/L for term neonates. Serum albumin concentration and the activities of AST, ALT, and alkaline phosphatase were determined in an Advia 1650 analyzer.
The predicted creatinine clearance (CLcr) was calculated according to the Schwartz formula using the height of the patients, and the results were normalized to a body surface area of 1.73 m2. The predicted values of GFR derived from serum Cys-C concentrations were calculated according to the expression proposed by Larsson et al.8): GFR (mL/min)=99.43×(serum Cys-C)-1.5837, and the results were normalized to a body surface area of 1.73 m2.
4. Pharmacokinetics analysis and evaluation of renal function
The pharmacokinetic analysis was carried out using the Abbott base Pharmacokinetics Systems program from Abbott Laboratories using a Bayesian model. The model considered for vancomycin was a linear 2-compartment model, and the population pharmacokinetic parameters used were: volume of distribution= 0.21±0.04 L/kg; clearance (CL)=0.05±0.01 mL/min/kg; CL renal (slope)=0.75±0.25; rate constant for distribution from central to peripheral compartment (K12)=1.12±0.28/hr; Rate constant for distribution from peripheral to central compartment (K21)=0.48±0.12/hr. In all the cases, the estimations of the pharmacokinetic parameters, peak concentration, CL, and half-life (t1/2) were carried out by entering the creatinine clearance predicted by the serum creatinine concentration and the GFR predicted by the serum concentration of Cys-C as GFR value into the programming.
CLcr (mL/min) was estimated using the Schwartz formula9) as follows:
GFRcys-c (mL/min) was estimated using Larsson's formula8) as follows:
5. Statistical analysis
Data are presented as the mean±standard deviation. The relationship between CLvcm and parameters of renal function (Cys-C, SCr, GFRcys-c, CLcr) was assessed by correlation analysis and linear regression using Spearman's correlation coefficient. IBM SPSS Statistics ver. 22.0 (IBM Co., Armonk, NY, USA) was used. A P value of <0.05 was considered to be significant.
Results
The mean gestational age was 39.40±0.94 weeks and the mean birth weight was 3.20±0.35 kg. The mean age at examination was 19.12±15.45 days from birth. The mean serum Cys-C level and creatinine level were 1.44±0.34 mg/L and 0.46±0.25 mg/L. Other laboratory results showed no remarkable findings. The volume of distribution of vancomycin was 0.67±0.13 L/kg and CLvcm was 74.52±31.17 mL/kg/hr. SCr showed 0.46±0.25 mg/dL, and serum Cys-C showed 1.44±0.34 mg/L. Peak and trough concentration of vancomycin showed 24.65±14.84 mcg/mL and 8.10±5.35 mcg/mL. Calculated GFR-Cr and GFRcys-C were 70.32±9.45 mL/min and 63.63±30.18 mL/min (Tables 1, 2).

Pharmacokinetic analysis
The reciprocal of cystatin C (1/Cys-C) was correlated well with CLvcm (c=0.479, P=0.001) and the reciprocal of serum creatinine (1/SCr) was also correlated with CLvcm (c=0.286, P=0.044). To conclude, the correlation constant of CLvcm and 1/Cys-C was significantly higher than that CLvcm and 1/Cr. GFRcys-c was strongly correlated with CLvcm (P=0.001) and the constant was 0.496. GFRcr also had significant correlation with CLvcm (c= 0.527, P=0.036) (Fig. 1).
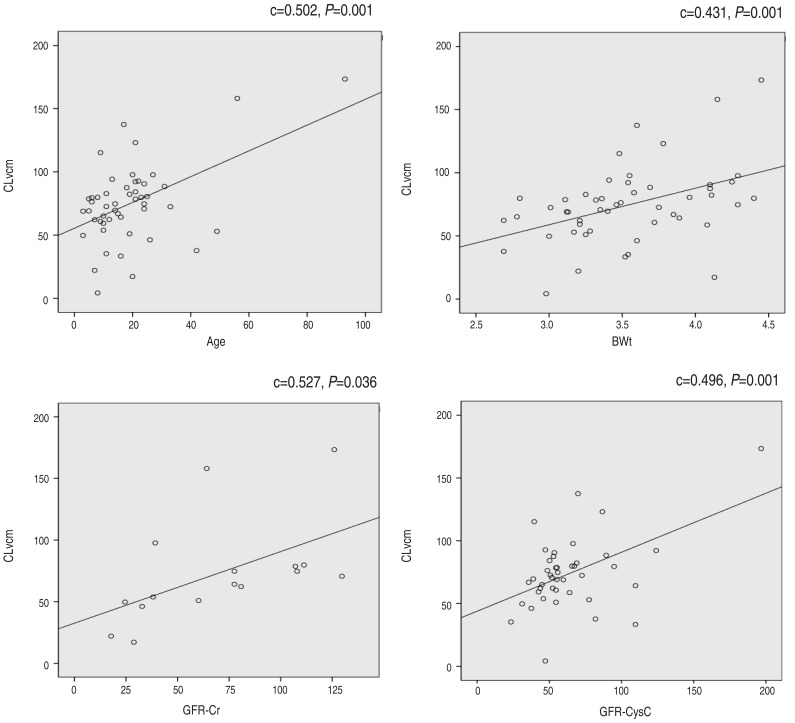
Correlation analysis between CLvcm and 1/SCr, 1/Cys-C, GFRcys-c, and GFR-Cr. CLvcm, vancomycin clearance; SCr, serum creatinine; Cys-C, serum cystatin C concentration; GFR, glomerular filtration rate; GFRcys-c, GFR based on Cys-C; GFR-Cr, GFR based on serum creatinine concentration.
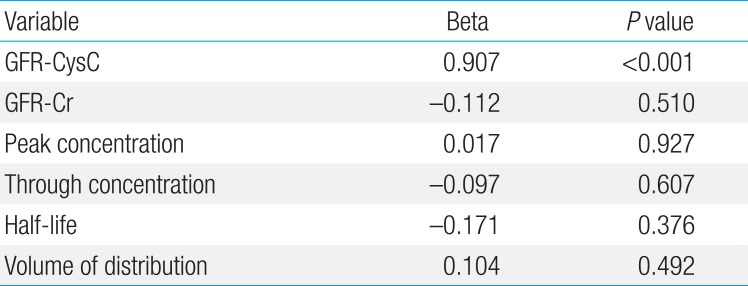
However, linear regression analysis showed that only GFRcys-c were independently positively correlated with CLvcm (F=41.9, P<0.001) (Table 3). None of the patients showed nephrotoxicity of vancomycin; decreased urination or increased serum creatinine after the drug administration.

Linear regression analysis of vancomycin clearance
Discussion
So far, there has been no report that serum Cys-C concentration is useful for adjusting the dose of vancomycin in Korean neonate population. This study showed the use of serum Cys-C as a marker of vancomycin clearance had more reliable predictions of serum vancomycin concentrations than the use of SCr particularly among neonates.
Vancomycin, a glycopeptide antibiotics, has been used effectively against aerobic gram positive, especially MRSA infections. However, due to elimination via kidney, vancomycin has the potential to cause severe nephrotoxic adverse reactions. Especially in neonates, the renal function is quite different from that of adults and older children. Despite a rapid decrease after birth in normal newborns, SCr is frequently higher than 90 mol/L during the first days of life10). An appropriate dose and dosage intervals must be chosen to achieve the maximal effect and to avoid toxicity according to the degree of renal function.
The pharmacokinetics of vancomycin in neonates is different from that in adults because of the variation in the amount of body water and maturation of renal function. Neonates have a larger volume of distribution and decreased total clearance, and that results in wider interindividual differences in neonates than in adults11). From our study, the peak concentration of vancomycin was 24.66±14.84 mcg/mL and the trough concentration was 8.10±5.35 mcg/mL. The volume of distribution was 0.67±0.13 L/kg. Reported average volume of distribution at steady state in term neonates ranges from 0.57 to 0.69 L/kg which is larger than that of adults3). Nephrotoxocity has been related to trough concentration >10 mg/L, but in most studies, it remains unclear whether elevated serum trough concentration are the cause or consequence of renal failure1213). Although many studies could not detect nephrotoxicity, there are some reports of vancomycin-related nephrotoxicity in neonates. Leonard et al.14) reported that three out of 12 very low birth weight infants treated with vancomycin had a rise of SCr of more than 0.3 mg/dL. Therefore, it is imperative to apply TDM to neonates treated with vancomycin.
Direct techniques for evaluating GFR, which involve inulin or radiopharmaceuticals, are expensive and impractical in clinical work or for screening large populations. The most common method utilized to estimate the GFR are the SCr concentration, the CLcr. However, CLcr may be less accurate in some individuals with children, and those with unusual muscle mass, body habitus, and weight. Cys-C, a low molecular weight protein is filtered at the glomerulus and not reabsorbed. The rate of production has been thought to be relatively constant, and not affected by changes in diet, gender, age or muscle mass1415). The serum Cys-C concentration may correlate more closely with the GFR than the SCr concentration1617181920). In multiple studies, serum Cys-C was more sensitive in identifying mild renal insufficiency than SCr1720). Using the clearance of radioactive iothalamate as the gold standard, serum Cys-C levels began increasing at GFR levels of approximately 90 mL/min per 1.73 m2, while the SCr only increased when the GFR was approximately 70 mL/min per 1.73 m2. Meta-analysis of recent studies suggests that serum Cys-C may be a better marker for GFR estimation than SCr21). A report for a population pharmacokinetic model of vancomycin using NONMEM software (Icon Development Solutions, Ellicott City, MD, USA) from a total of 1,373 vancomycin concentration measurements in 678 Korean patients whose serum creatinine concentrations were lower than 1.2 mg/dL were noted. A population pharmacokinetic model of vancomycin was revealed that Cys-C was the most influential factor and had negative influence (-0.78) in the relationship. Total body weight, sex, age, and serum creatinine were also significantly correlated with the clearance. A 14-fold difference in predicted trough concentrations was observed according to only Cys-C concentrations22). Several studies including adults and children with different renal diseases with various kidney function have suggested serum Cys-C to be a better marker of GFR than SCr23).
One TDM study pointed out the risk of overestimation of GFR when using SCr, and suggested Cys-C as a valid alternative as a GFR marker with regard to drug dose adjustment for vancomycin and amikin24). Okamoto et al.4) reported higher correlation for CLvcm and the GFRcys-c compared to that for CLvcm and CLcr with smaller coefficient of variation, which suggests that Cys-C as a more reliable marker for predicting CLvcm in elderly patients treated with vancomcyin.
The major limitation of this study is a single center study and small sample size. Furthermore, the effective range of vancomycin in neonates has not yet been determined. Because of the use of vague standards to determine efficacy, we could not assess whether the desired therapeutic effects were achieved. Further research with a larger study population and longer follow-up is necessary.
We investigated the utility of serum Cys-C concentration for predicting CLvcm compared with SCr as a marker of the renal function. So far, no study has investigated the direct relationship between CLvcm and GFR estimated based on Cys-C in neonates. To conclude, the present study suggests that the use of serum Cys-C as a marker of CLvcm is reliable and we expect this result would be useful particularly among neonates.
Notes
Conflict of interest: No potential conflict of interest relevant to this article was reported.