Association between serum alanine aminotransferase level and obesity indices in Korean adolescents
Article information
Abstract
Purpose
To analyze the correlation between serum alanine aminotransferase (ALT) and obesity indices including body mass index (BMI), body fat percentage (BFP), total fat mass (FM), truncal fat mass (TFM), waist circumference (WC), and waist-to-height ratio (WHtR) in Korean adolescents.
Methods
This was a cross-sectional study based on data derived from the 2010-2011 Korean National Health and Nutrition Examination Surveys (KNHANES). Subjects were Korean adolescents aged 10-18 years (871 total; 475 boys and 396 girls) who participated in KNHANES.
Results
In both sexes, BMI, FM, TFM, WC, and WHtR were higher when ALT levels were in the 4th quartile. In boys, there was a significant positive correlation between ALT level and BMI, BFP, FM, TFM, WC, and WHtR (r=0.55, P<0.0001 for BMI; r=0.52, P<0.0001 for BFP; r=0.58, P<0.0001 for FM; r=0.61, P<0.0001 for TFM; and r=0.56, P<0.0001 for WC; r=0.62, P<0.0001 for WHtR), and the correlation coefficient was higher than that in girls.
Conclusion
Our results suggest a significant positive association between serum ALT level and obesity indices in male adolescents.
Introduction
Obesity is qualitatively defined as the storage of excess fat in the body resulting from a positive energy balance. The prevalence of obesity-associated complications is related to this excessive accumulation and distribution of body fat. Since a simple and precise method for determining body fat composition in children and adolescents has not yet been clearly established, childhood obesity is generally defined as a body mass index (BMI) at or above the sex- and age-specific 95th percentile. Since BMI has limitations as a definitive surrogate index for adiposity levels when assessing obesity, recent studies have also applied body composition analysis to screen adiposity to detect excessive fat mass (FM) and distribution1).
The most common metabolic complication in adolescents is nonalcoholic fatty liver disease (NAFLD). While the prevalence of NAFLD has increased with rising pediatric obesity, it is difficult to determine the true prevalence of NAFLD, because its diagnosis is based on histologic examination of a liver biopsy. According to a study conducted by Loomba et al.2), the prevalence of NAFLD in the pediatric population ranged from 3% to 10%, and the it ranged from 20% to 53% among those who were either overweight or obese. The prevalence of NAFLD in overweight or obese Korean adolescents with serum ALT levels >40 U/L varies from 9.7% to 33.4% based on different groups345). According to data derived from the 1998 Korean National Health and Nutrition Examination Survey (KNHANES), prevalence of NAFLD in children and adolescents aged 10-19 years was 3.6% and 2.8% in boys and girls, respectively6).
Although a diagnosis of NAFLD can be confirmed through invasive procedures such as a liver biopsy, a probable diagnosis can also be made based on the patient's elevated ALT levels or evidence of some degree of steatosis on ultrasonography. Serum ALT levels>40 U/L usually represent liver damage in the general population, but the cutoff level in children may need to be decreased, since children and adolescents should have less exposure to liver-damage risk factors such as smoking or alcohol7). According to Schwimmer et al.7), the normal pediatric values from the 1999-2006 National Health and Nutrition Examination Survey (NHANES) for healthy-weight, metabolically normal, liver disease-free boys and girls who were in the 95th percentile for ALT levels were 25.8 U/L and 22.1 U/L, respectively.
The correlation between child and adolescent obesity and NAFLD has been extensively investigated, but there is insufficient evidence regarding the correlation of obesity indices, other than BMI, with NAFLD in Korean adolescents. Thus, this study may help us to enhance our understanding of obesity in Korean adolescents by interpreting the correlations of serum ALT level with obesity-related indices including BMI, total fat mass (FM), truncal fat mass (TFM), waist circumference (WC), body fat percentage (BFP) and waist-to-height ratio (WHtR).
Materials and methods
1. Subjects
The present cross-sectional study was based on data acquired from the 5th KNHANES, which was conducted from 2010 to 2011 by the Korean Centers for Disease Control and Prevention to assess the health and nutrition of a large, representative sample of noninstitutionalized Korean civilians8). The household units in KNHANES were selected using stratified, multistage, systemic sampling and a rolling survey sampling design. More detailed information on KNHANES' data collection methods is available at their website. Overall, 2 018 subjects aged 10-18 years participated in the 2010-2011 KNHANES. Within this group, the study included 871 Korean adolescents (475 boys and 396 girls), aged 10-18 years, who had both a negative test result for hepatitis B surface antigen and complete data for analysis in further studies. All participants in the survey provided written informed consent, and all clinical procedures involved were approved by the Korean Centers for Disease Control and Prevention before the study commenced.
2. Anthropometric and laboratory measurements
Height was measured to the nearest 0.1 cm using a stadiometer (Seca, Hamburg, Germany). Body weight was measured to the nearest 0.1 kg using a balance beam scale (G-TECH, Uijeongbu, Korea), with participants wearing a standardized gown. Based on Quetelet's formula: weight (kg)/height (m)2, we calculated BMI9). The WC was measured to the nearest 0.1 cm at the midpoint between the lower border of the rib cage and the iliac crest. The BFP, FM, and TFM were measured using a dual-energy x-ray absorptiometry (DXA) (QDR 4500A, Hologic Inc., Waltham, MA, USA) located in the mobile examination centers.
Systolic blood pressure (SBP) and diastolic blood pressure (DBP) were measured using a standard mercury sphygmomanometer (Baumanometer, W.A. Baum Co., Copiague, NY, USA) on the right arm. Two measurements were taken 5 minutes apart, and the mean values were used for the analysis. A blood sample was collected after an 8-hour overnight fasting period, labelled and stored in a refrigerator, and arrived at a central laboratory within 24-hour collection. Serum aspartate aminotransferase (AST) and ALT levels were measured and analyzed using enzymatic method (Pureauto S AST and Pureauto S ALT, Sekisui, Japan). Plasma concentration of glucose, gamma-glutamyl transpeptidase (GGT), total cholesterol (TC), triglyceride (TG), and high-density lipoprotein cholesterol (HDL-C), low-density lipoprotein cholesterol (LDL-C) levels were measured by enzymatic colorimetry (Automatic Analyzer 7600, Hitachi, Japan). Fasting plasma insulin level was measured by immunoradiometric assay (Biosource, Nivelles, Belgium) with a gamma counter (1470 Wizard, PerkinElmer, Turku, Finland). Homeostasis model assessment of insulin resistance (HOMA-IR) was calculated as: [fasting insulin (µU/mL)×fasting glucose (mg/dL)]/40510). Lastly, the presence of hepatitis B surface antigen was detected by electrochemiluminescence immunoassay (Modular E-170, Roche, Mannheim, Germany). Each piece of health data was acquired and described based on the content of KNHANES8).
3. Statistical analysis
Statistical analysis was performed using the statistical software package SAS 9.2 (SAS Institute Inc., Cary, NC, USA). All results are given as mean±standard deviation. The Student t test and chi-square test for continuous and discrete variables, respectively, were performed to investigate the differences in variables according to the ALT quartile. Pearson correlation coefficients were used to evaluate the association between obesity-related indices and ALT quartiles. For all analyses, 2-sided P values of <0.05 were considered statistically significant. The z score of obesity indices was calculated based on sex and age.
Results
1. Subject characteristics
A total of 871 adolescents (475 boys and 396 girls) aged 10-18 years participated in the study. As shown in Table 1, the mean ALT level, BMI, and WC measurements for boys were 19.0±0.6 U/L, 21±0.2 kg/m2, and 71.6±0.6 cm, respectively, which were higher than the girls' respective measurements of 16±0.4 U/L, 20.3±0.2 kg/m2, and 67.3±0.6 cm. In contrast, BFP, FM, and TFM were higher in girls. The mean WHtR showed no difference between sexes. Blood pressure (SBP and DBP), AST levels, and ALT levels were higher in boys. The mean levels of TC, TG, LDL-C, and HDL-C were higher in girls. There was no significant difference in glucose and insulin levels, and HOMA-IR score between boys and girls.

Study participant characteristics
2. Study participants' characteristics according to ALT quartile
Study population characteristics by sex and ALT quartile (1st, 2nd, and 3rd quartile vs. 4th quartile) are presented in Table 2. For both sexes, BMI, FM, TFM, WC, and WHtR were higher in the 4th quartile than in the 1st through 3rd quartile group. Both SBP and DBP were higher in the 4th quartile in boys, but showed no significant quartile differences in girls. Levels of AST, ALT, GGT, TC, TG, and LDL-C were higher in the 4th quartile for both sexes. In boys, no statistical difference in HDL-C level among the quartiles was seen, compared to girls who showed lower levels of HDL-C in the 4th quartile. Insulin level and HOMA-IR score were higher in the 4th quartile for both sexes, but glucose level had no apparent correlation with ALT level.

Study participant characteristics according to ALT quartile
3. Correlation of obesity-related indices with serum ALT
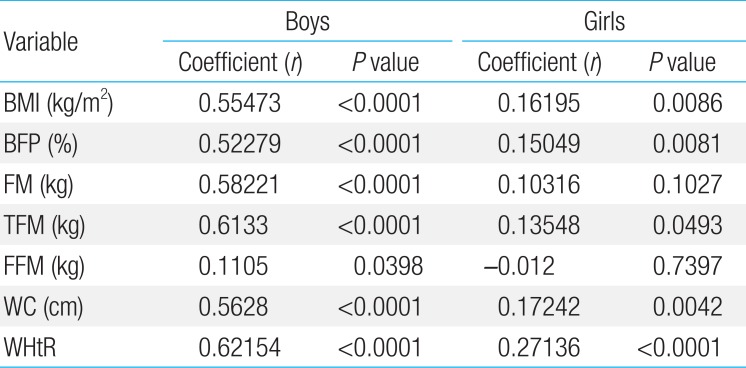
Table 3 represents the correlation of serum ALT level with obesity indices. In boys, significant positive correlations were seen between ALT level and BMI, BFP, FM, TFM, WC, and WHtR (r=0.55, P<0.0001 for BMI; r=0.52, P<0.0001 for BFP; r=0.58, P<0.0001 for FM; r=0.61, P<0.0001 for TFM; r=0.56, P<0.0001 for WC; and r=0.62, P<0.0001 for WHtR). Overall, the correlation coefficients were higher in boys than in girls. Among the indices, the correlation coefficients for WHtR (r=0.62) and TFM (r=0.61) were the highest, suggesting a positive, linear relationship with ALT level. In girls, BMI, BFP, TFM, WC, and WHtR were positively correlated with ALT level (r=0.16, P=0.0086 for BMI; r=0.15, P=0.0081 for BFP; r=0.1, P=0.1027 for FM; r=0.14, P=0.0493 for TFM; r=0.17, P=0.0042 for WC; and r=0.27, P<0.0001 for WHtR). The correlation coefficient for WHtR (r=0.27) was the highest.

Correlation of obesity-related indices with ALT among Korean adolescents (n=871) aged 10-18 years, KNHANES 2008-2009
4. Obesity indices' z scores by ALT quartile
In both genders, the obesity indices' z scores increased with ALT quartile, and the gap between the 4th quartile and other quartiles was wider in boys compared to girls (Fig. 1). For boys, the TFM and FM z scores were the highest in the 4th quartile, and for girls, the WHtR and WC z scores were highest in the 4th quartile.

Z-score of obesity indices according to alanine aminotransferase (ALT) quartile. (A) Boys' obesity incidences' z score by ALT quartile. (B) Girls' obesity incidences' z score by ALT quartile. BMI, body mass index; FM, total fat mass; TFM, truncal fat mass; FFM, Fat free mass; BFP, body fat percentage; WC, waist circumference; WHtR, waist-to-height ratio.
Discussion
The goal of this study was to analyze the potential correlation of serum ALT levels with obesity indices (BMI, PBF, FM, TFM, WC, and WHtR) in Korean adolescents. Serum ALT levels showed significant correlation with several of these obesity indices in male group. The correlation between BMI and ALT levels was especially significant in boys; boys overall had a higher mean concentration of serum ALT than girls. These results are consistent with those of previous studies that suggested a strong positive association between BMI and increased serum activities of liver enzymes1112). The most common metabolic disorder in childhood obesity is NAFLD, characterized by accumulation of fat in the hepatocytes13). Subjects with substantial amounts of abdominal fat present with activated lipolysis of adipocytes, resulting in increased free fatty acids in the portal venous system1415). This is concerning, as exposing the liver to high amounts of fat can increase the risk of NAFLD up to 5-6 times16).
Body FM and its distribution have long been known to be major determinants of obesity-related metabolic complications. Among the direct and indirect methods available to assess body fat, BMI is the most widely used index due to its simplicity and low cost. Although many studies have addressed its limitations for analyzing body fat, resulting in a considerable level of misclassification, studies have also found that the accuracy of BMI depends on the degree of fat in growing children1718). Thus, several countries have recently begun measuring body fat using whole-body DXA, bioelectrical impedance analysis, or skinfold measurements to assess body fat composition and diagnose obesity. According to Choi19), serum ALT, AST, and GGT activities in overweight men and women were significantly correlated with total body fat as measured by bioelectrical impedance analysis. Using DXA to assess total and regional body fat composition, our study found 4th quartile BFP to be 30.5%±0.9% in boys and 34.1%±0.6% in girls. In contrast, mean BFP in the 1st, 2nd, and 3rd quartiles was 21.3%±0.7% in boys and 31.6%±0.4% in girls. This indicated significantly high BFPs in groups with high ALT levels. The strength of DXA is its proven ability to more accurately quantify body fat deposits than other anthropometric measurements such as bioelectrical impedance analysis or skinfold measurement, and ability to calculate fat distribution by assessing regional body composition20). Perlemuter et al.21) conducted a study in which DXA was used as a criterion reference of TFM in adults. The authors found a positive correlation with liver enzyme levels in the obese and an inverse correlation with leg FM, which provided a protective effect against obesity-associated liver damage.
According to the modified NCEP-APT III (National Cholesterol Education Program-Adult Treatment Panel III) criteria, WC is an indirect measure used to assess abdominal obesity (defined as WC≥90th percentile for age and sex), which is then used for the diagnosis of metabolic syndrome22). Lin et al.23) reported that the WC was also a better predictor of liver steatosis than BMI and could be considered a substitute for the central obesity assessment. According to Monteiro et al.24), WC had greater potential for and success in identifying children and adolescents at increased risk of developing NAFLD. The group was represented by a higher area under the curve value (AUC=0.720) than TFM (AUC=0.661). The WC was also almost as useful as ultrasonography (AUC=0.741). Due to its simplicity and success, WC could be used more often to measure intra-abdominal adipose tissue.
Limitations of WC include the potential for underestimating the relative amount of abdominal fat in short subjects while overestimating abdominal fat in tall subjects25). Several reports indicated that the WHtR corresponded better to metabolic risk than WC262728). According to Lee et al.29), the cutoff visceral fat area in children aged 10-15 years was 68.57 cm2 at which point the risk of obesity-related disorders increased, and the WHtR corresponding to this area was 0.54 in boys and 0.61 in girls.
For children aged 16-18 years, the cutoff visceral fat area was 71.70 cm2 with a WHtR of 0.51 in boys and 0.56 for girls. In our study, the following abdominal obesity-related indices had a significant correlation with ALT level, particularly in boys, as shown by the correlation coefficients: WC, WHtR, and TFM were 0.56, 0.62, and 0.61, respectively, in boys, and 0.17, 0.27, and 0.13, respectively, in girls.
Our study showed that the mean ALT level was higher in boys (19.6 U/L) than in girls (16.8 U/L). The mean ALT level in boys was 17.9 U/L from the 1st to 3rd quartile and 25.2 U/L in the 4th quartile. In girls, the mean ALT levels were 16.0 U/L from the 1st to the 3rd quartile and 19.2 U/L in the 4th quartile. The ALT level difference between the 1st to 3rd quartile and the 4th quartile was 3.2 U/L in girls compared to 7.3 U/L for boys, who showed significantly wider gap between the quartiles. Our results were consistent with those of previous studies that had reported both the ALT levels in normal or obese children and that prevalence of NAFLD was significantly higher in boys than girls83031). The mean ALT level for the total population was higher in boys (15.4±6.5 U/L) than in girls (12±5.2 U/L)8). Grotti Clemente et al.32) reported that boys with NAFLD presented significantly elevated serum ALT levels (52.06±34.13 U/L) than girls (25.29±8.70 U/L in girls). The reason for differences in serum ALT concentration and NAFLD prevalence between sexes remains unclear. Previous studies suggested the estrogen-testosterone ratio as a potential reason for this sex-based difference, as the ratio is an important mediator for insulin resistance. Sex hormones affect both fat and muscle distribution. Globulin, which binds sex hormones and is produced in the liver, is strongly correlated with insulin sensitivity and higher ALT level33). The male preponderance of liver enzyme levels may be mediated by higher androgen levels and lower levels of sex-hormone-binding globulin in adolescent boys34).
Our study had some limitations. The study was cross-sectional, and temporal sequence could not be inferred. Furthermore, it was a simple correlation-based analysis between ALT level and obesity indices, and no possible cutoff value of obesity indices was proposed to assess the risk of NAFLD.
In conclusion, serum ALT levels are significantly correlated with various obesity indices in Korean male adolescents. In the future, studies with larger populations from various environments should be conducted to establish generalized cutoff values of obesity indices for diagnosing obesity-related metabolic disorders in Korean adolescents.
Notes
Conflicts of interest: No potential conflict of interest relevant to this article was reported.