Analysis of causes of injuries among children in Daegu, Korea
Article information
Abstract
Purpose
The purpose of this study was to determine the mechanisms and exact causes of injuries to children by analyzing the medical records of children who visited emergency medical centers.
Methods
We reviewed the medical records of 7,114 pediatric patients (aged below 15 years) who visited the emergency care center (ECC) of a Yeungnam university hospital in Daegu between January 2007 and December 2009.
Results
Among the pediatric patients who visited the ECC, 1,526 (27.2%) were admitted for injuries (boys, 979 [64.2%] and girls, 547 [35.8%]); the boy-to-girl ratio in this study population was 1.8:1. The proportion of boys was higher than that of girls over all age ranges, except for children aged less than 1 year. The highest incidence of injury due to slipping (20.5%) was noted in the 1-year-old group, and nearly half the total number of cases (49.3%) involved children who were under 4 years of age. Of the sites of injury, 999 involved the head and face (73.7%) and 134 involved the hand and wrist (9.9%). Seventy-one injuries (5.7%) occurred on the bed, 70 (5.6%) at the door, and 67 (5.3%) on the stairs. Of the approximately 250 types of injuries classified by cause, 17 accounted for 50.4% of all the injuries.
Conclusion
The cause of injury could be attributed to approximately 20 causes in more than half the cases of pediatric injuries. A classification of the types of injuries and the development of appropriate preventive strategies can help avoid such injuries.
Introduction
Injuries in children are a medically important subject because injuries account for the largest proportion of the causes of children's deaths. According to data from the Statistics Korea (Korean national statistical office), of the 10 major causes of children's deaths, 3 to 4 causes related to unexpected accidents were responsible for deaths of children1). For children 1-9 years of age, the number of deaths due to injuries is comparable with the number of deaths due to all other causes. Moreover, for adolescents 10-19 years of age, unexpected accidents are still the leading causes of deaths, except for suicide2). For global deaths of children (950,000 children) under 18 years of age per annum, injury is the leading cause of death, and death due to unintentional injuries accounts for approximately 90% of all causes of deaths3). In United States, deaths in childhood from injuries exceed childhood deaths from all other causes combined4). As injuries and children's deaths are closely related, reduction of the number of unintentional injuries in children can considerably decrease overall child mortality.
Although there have been many studies on child accidents in Korea, only a few studies have dealt with the 'causes' of child accidents. Thus, more studies on the causes of child accidents are required. Also, many studies have focused on the mechanisms of accidents, but few have addressed the detailed circumstances of accidents, except for a study that was performed with the use of a survey questionnaire. In this context, the detailed causes of accidents were also investigated, in addition to the general mechanisms of the accidents.
Because there are few training materials for children with respect to the prevention of accidents, practical guidelines for the prevention of accidents are required. This study was performed to establish an appropriate preventative measure by identifying the exact circumstances under which childhood injuries occur based on the medical records of the ECC.
Materials and methods
Of the 7,114 pediatric patients under 15 years of age who visited the ECC of Yeungnam university medical center between January 1, 2007 and December 31, 2008, 1,934 cases of children who visited the ECC due to injuries or burns were reviewed. Among the 1,934 patients, 408 who were not eligible for inclusion in the study based on the predetermined criteria were excluded from the study and the emergency room outpatient records of the 1,526 children who were eligible were analyzed. The cases that were excluded were: ECC visits due to traffic accidents, inadequate records of the cause of the accident, accidents due to basal diseases (e.g., gait disturbance or Moyamoya disease), ECC visits due to assaults, revisits within 2 days, and absence of a medical chart, although the patient's name was listed on the computerized database received from the patient records department.
The computer-based data on the subject included the visit date, arrival time, discharge date, registration number, gender, age at the time of the visit, and other necessary information that were not available in the computer-based data and were obtained from the relevant medical charts. The causes of the accidents that were determined from the charts were classified according to the mechanism of injury (full version) of ICECI (international classification of external causes of injury) in 2003 (Table 1)5). The mechanism of an accident that was listed on the ICECI classification, but was not among the subjects of this study, was excluded from the results. The classification of the injured body parts followed S00-T98 of KCD-5 (XIX. injury, poisoning, and certain other consequences of external causes). Also, the detailed causes of the accidents were organized using the authors' classification chart.
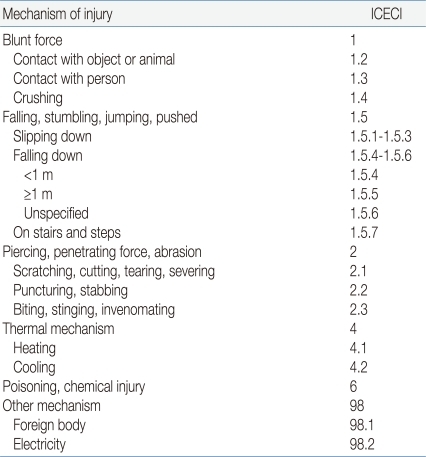
Mechanism of Injury and ICECI
The frequency of the accidents by age and gender, the associations between gender and the mechanism of the accident, age and the mechanism of the accident, time or season and the mechanism of the accident, the ECC visit time and the mechanism of the accident, the injured body part and the mechanism of the accident, and the detailed causes of the accidents were examined and organized for use as basic data for establishing proper preventative measures.
The data collected was assessed with a frequency analysis for which SPSS Statistics 17.0 was used.
Results
The proportion of pediatric patients who visited the ECC for injuries due to causes other than traffic accidents among the total number of pediatric patients who visited the ECC was 27.2%.
The number of male and female pediatric patients were 979 (64.2%) and 547 (35.8%), respectively, with a male-to-female ratio of 1.8:1. The greatest number of accidents occurred among children 1 year of age [313 accidents (20.5%)]. Nearly one-half of all of the accidents occurred in children under 4 years of age [753 accidents (49.3%)]. Before 15 years of age, more accidents occurred in boys than in girls, except under 1 year of age, for which the ratio of boys to girls was 1:1.1 (Table 2).
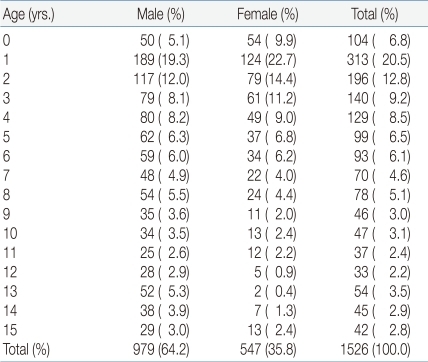
Distribution of the Injured Children Visiting the Emergency Care Center (ECC), January 1, 2007~December 31, 2008, by Age and Sex
Except for crushing and poisoning, the accidents occurred more often in boys than in girls, regardless of the mechanism of the accident and the age. More blunt injuries, falls (including down the stairs), penetrations, lacerations, or animal or insect bites occurred in boys than in girls, whereas more slips, crushing, burns, or swallowing of foreign bodies occurred in girls than in boys. The number of children who visited the ECC due to poisoning or electrical burns was very small, and thus insignificant. Slips were the leading causes of accidents, regardless of the child's gender, with 448 cases (29.4%). No frostbite occurred (Table 3).

Distribution of Injured Children by Sex and Mechanism of Injury
Regardless of the cause of the accident, a large number of accidents occurred at about 1 year of age. There were 9 collisions with humans over 11 years of age (90%). Of all the falls, the proportion of falls from a height over 1 meter in children 0-6 years of age was relatively low. For falls down the stairs, the largest number occurred in children 1 year of age (20 cases [29.9%]). Thirty-five burns (46.1%) occurred in children 1 year of age, which is a high incidence rate considering that 20.5% of all the accidents occurred in children 1 year of age. Electrical burns occurred in 3 children 1 year of age, and poisoning occurred in 3 children 3 years of age. For children under 1 year of age, falls accounted for the largest proportion (31.7%), followed by burns (18.3%), and blunt injuries (16.3%). For children 1 year of age, the proportion of slips was the largest (32.3%), which indicates that there was a considerable difference in the mechanisms of the accidents that occurred between children 0 and 1 year of age (Table 4). The proportion of children inflicted with injuries was highest (8.2-10.4%) from March to September, and under 8% from January to February and October to December, regardless of the type of accident. Most of the accidents occurred from March to September, except that crushing occurred most often in January (19.2%), respectively (Table 5).

Distribution of Injured Children by Age and Mechanism of Injury
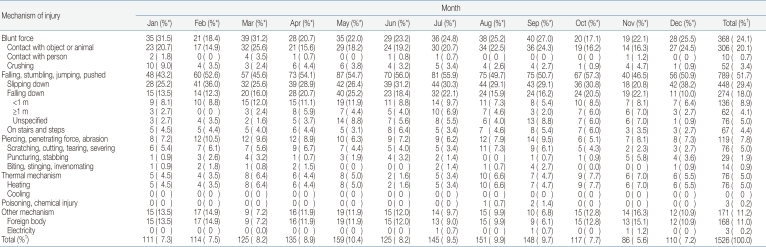
Distribution of Injured Children by Month and Mechanism of Injury
There was no considerable difference in the seasonal distribution, regardless of mechanisms of injury (Table 6).
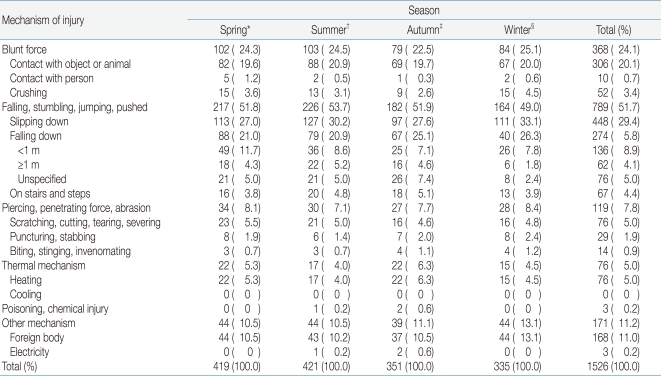
Distribution of Injured Children by Four Seasons and Mechanism of Injury
The largest number of visits occurred between 18:00 and 20:00 (25.9%) (Table 7). Nine hundred ninety-nine cases (73.7%) involved the head and face, followed by the hand and wrist (9.9%) (Table 8).
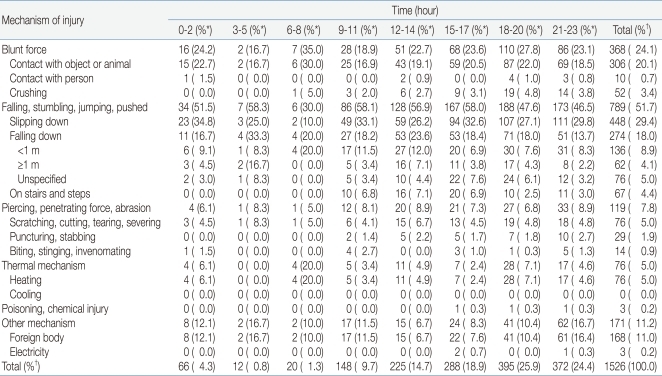
Distribution of Injured Children by Time and Mechanism of Injury
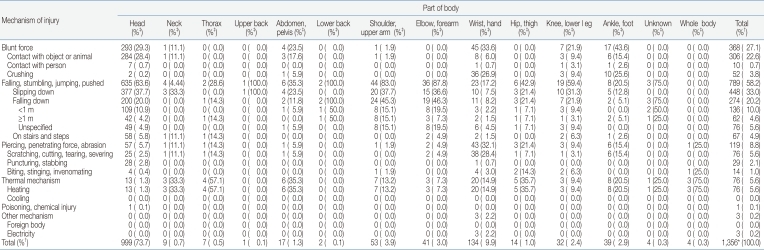
Distribution of Injured Children by Part of Body and Mechanism of Injury
Regarding the detailed causes of accidents, the largest number of accidents occurred in bed [71 cases (5.7%)]. Of the more than 250 detailed causes of accidents, 17 types accounted for 50.4% of all accidents (Table 9).
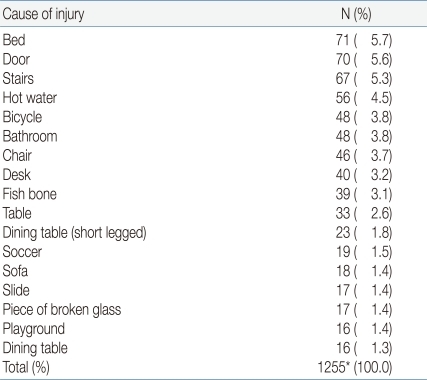
Distribution of Injured Children by Specific Cause of Injury
Regarding the relationship between the mechanism of the accident and the detailed cause of the accident, blunt injuries caused by collision occurred mostly due to collisions with structures or furniture in the house, and blunt injuries caused by collision with other people occurred mostly due to sports activities. For crushing injuries, 31 cases (59.6%) occurred at the door. Although slips accounted for 29.4% of all accidents (448 cases), the exact causes were not identified in most cases (Table 10).
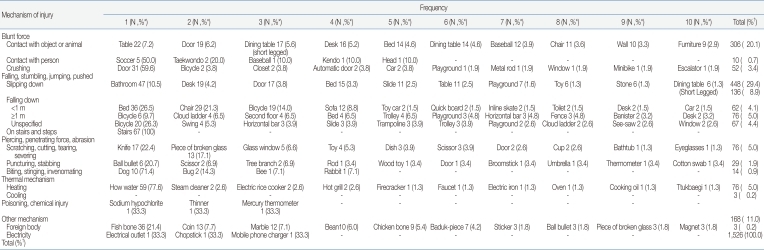
Distribution of Injured Children by Frequency of Cause and Mechanism of Injury
Discussion
The total number of children who visited the ECCs was 7,114 during the 2-year period, 1,526 (27.2%) of whom visited the ECC due to accidents other than traffic accidents. A previous study conducted at the same ECC from January 1, 2001 to December 31, 2002 showed, however, that the proportion of children who visited the ECC due to accidents other than traffic accidents was 23.0%6). Based on the increased proportion of children who visited the ECC for accidents other than traffic accidents, overcrowding of the emergency room and childhood accidents were associated.
Similar to the results of other studies, the ratio of boys to girls who visited the ECC was 1.8:1, which can be attributed to the characteristics of boys who have strong curiosity and are very active6-20). Notably, under 15 years of age, the proportion of boys to girls was higher except under 1 year of age, at which age the ratio of boys to girls was 1:1.1. This seems to be related to the developmental process of children. There is little difference in the amount of activity between boys and girls under 1 year of age, when they can start to walk due to improved motor ability. Although the frequency of slips, which is considered most closely related to physical activity, was the fourth highest in children under 1 year of age, it was the first and second highest in children over 1 year of age. Based on this finding, it is suggested that accidents due to physical activity can occur more in boys than in girls.
Although for children under 1 year of age, falls accounted for the largest proportion of injuries (31.7%), followed by burns (18.3%) and blunt injuries (16.3%), for children 1 year of age, slips accounted for the largest proportion of injuries (32.3%), which indicates that there is a big difference in the mechanisms of accidents between boys and girls. This also suggests that the ability to ambulate considerably affects the mechanism of accidents.
The age at which the largest number of accidents occurred was 1 year, which accounted for 20.5% (313 cases) of all accidents. Similar to one report, nearly one-half of all the accidents occurred under 4 years of age [753 cases (49.3%)]. Under 1 year of age, accidents mostly occur with parental supervision, and at 1 year of age accidents may occur without parental supervision because children can already move on their own. Thus, the incidence of accidents is higher at 1 year of age than under 1 year. In addition, at 12-18 months, children tend to explore the things around them1), which may cause accidents.
Except for crushing and poisoning, more accidents occurred in boys than in girls in all the classifications, regardless of the mechanism of the accident. The proportions of blunt injuries, falls, falls down the stairs, penetrations, lacerations, and animal or insect bites was higher among the boys who visited the ECCs than among girls, whereas the proportions of slips, crushing, burns, and swallowing of foreign bodies were higher than among the boys. The number of children who visited the ECCs due to poisoning or electrical burns was small, and thus insignificant for this study.
Slips were the leading causes of accidents in boys and girls, with 448 cases (29.4%). Previous studies did not classify slips as among the separate causes of accidents9-11) or classified them in the same category as other causes7), which made it difficult to compare the results of previous studies with those of this study. Two studies that were conducted relatively recently, however, showed that slips were the leading causes of accidents8, 21).
Regardless of the cause, accidents occurred at approximately 1 year of age, and 9 cases of collisions with other people (90%) occurred over 11 years of age. Those collisions with other people were related to sports activities.
The proportion of falls from a height over 1 m at age 0-6 years was low. This might have been because children at 0-6 years of age cannot climb to a height over 1 m in most cases.
The largest number of falls down the stairs 20 cases (29.9%) occurred at 1 year of age. This was because children at 18 months of age can go up the stairs by holding other people's hands1). Before 18 months of age, children cannot go up the stairs on their own. It appears that the number of falls increases as they start to go up the stairs on their own. Incomplete motor function, unstable body posture while going up the stairs, and higher stairs than children's height can cause accidents.
For burns, 46.1% (35 cases) occurred at 1 year of age, which is a considerably high incidence rate, considering that the proportion of accidents that occurred at 1 year of age was 20.5% of all accidents. The largest number of burns occurred due to hot water. In this study, the meaning of hot water includes hot water in a cup, a pot, and a bowl. Considering that many burn accidents occurred due to parents' mistakes or children spilling hot water by mistake, parents should be cautious and hot water should be placed away from children to prevent burns. Two cases of burn accidents due to a steam cleaner also occurred.
Most of the mechanisms of the accidents occurred from March to September, except for crushing and pricking, with the largest number of crushing and pricking cases occurring in January (19.2%) and November (17.2%), respectively. Generally, the proportion of accidents related to physical activity was high. It is postulated that this was because there are more hours of outdoor activity when the weather is suitable and because days are longer from March to September. For the seasonal distribution of the accidents, more accidents occurred in spring and summer than in fall and winter. This appears to be related to the amount and length of physical activity, as in the case of the monthly distribution of the accidents. The number of slips slightly increased from 97 cases (21.7%) in the fall to 111 cases (4.8%) in the winter. Most of the crushing was indoors, which was unrelated to outdoor activity, and the largest number of crushing incidents occurred in winter, when there are more hours of indoor activity.
The time when the largest number of accidents (25.9%) occurred was from 18:00 to 20:00 hours. This was based on the ECC visit time, so that the actual accident time could be slightly earlier than 18:00 to 20:00 hours.
For the injured body parts, 999 cases (73.7%) occurred in the head and face, followed by the hand and the wrist (134 cases [9.9%]). The hands are generally highly used body parts and are used to protect other body parts in cases of slips or falls. The high incidence rate of accidents in the hands and wrists could be related to this. In the cases of falls, many face injuries occurred because the head and face bump strongly against the floor.
Seventy-one cases (5.7%) occurred in bed. As the bed is related to falling down, slips or blunt injuries, it should be checked first to prevent accidents in the home. Of the more than 250 detailed causes of accidents, 17 were related to 50.4% of the accidents. As childhood accidents occur under certain circumstances, the identification of the common causes of such accidents can be very useful for their prevention.
Blunt injuries due to collisions with things appeared to have been caused by structures or furniture in the house, and blunt injuries due to collisions with other people appeared to have been related to sports activities. As for crushing injuries, 31 cases (59.6%) were caused by doors. Slips accounted for the largest proportion of mechanisms of the accidents [448 cases (29.4%)]. In most of the cases, however, the relevant medical charts did not contain information on the place where the slip occurred. For the accidents with identified causes, the number of slips in the bathroom was the largest [47 cases (10.5%)]. Notably, no frostbite occurred, which could have been because this study was conducted in a downtown hospital where the living environment has improved from the past and where parental supervision of children is good. As for swallowing of foreign bodies, fish bones were the major causes. Thus, parents should avoid giving fish to young children or should give them fish after removing all of the fish bones. In addition, bicycle accidents accounted for a large proportion of the accidents. Thus, children must wear protective gear when riding a bicycle.
This study was conducted on pediatric patients who visited ECCs using the outpatient medical chart. As the emergency room outpatient medical chart was not prepared for the purpose of the study, it had limitations with respect to the use of its contents as basic data, unlike had data been prepared precisely for the purpose of this study. The main limitation of this study was that some emergency room medical charts did not contain the detailed causes or mechanisms of the accidents. However, the selection of relatively more serious injuries can be the strength of this study.
It appeared that during the preparation of the ER chart, more focus was give to the outcome of the accidents than to the mechanisms of the accidents. In particular, in most of the cases of slips, the place where the slip occurred, and whether the injury was due to the slip itself or was caused secondarily by bumping into things after the slip, were not mentioned in the chart. Had the causes of the accidents been classified as primary, secondary, or tertiary when the chart was prepared, the data in the chart could have been used more systematically.
Even when the cause of an accident was described in the medical chart, its classification was not easy because the exact height of the falls was not mentioned and some injuries occurred due to various reasons, through a complex process. In such cases, one cause that was considered the direct cause of the accident was referred to as the primary cause of the accident. Although every effort was made to perform the analysis based on the given data, avoiding subjective judgment, there may have been some subjective opinions in the course of this study. To overcome these limitations, the classification criteria to be used for future studies should be used in the preparation of the outpatient medical chart.
If a system for monitoring injuries will be established, many studies on subjects similar to the subject of this study are expected to be conducted. Previous studies had limitations in terms of the inconsistency of the classification system, which limited comparison between the studies. Also, the existing classification of the mechanisms of accidents is too broad to be used to establish practical preventative measures. In this context, a novel classification system and criteria are required. A new classification system that covers the mechanisms and detailed causes of accidents and that can be used for future studies is necessary. As ICECI is too complex to be used and unsuitable for the local situation, a classification system based on it will need amendment and complementation. Because many studies have focused on the mechanisms of accidents, future studies must focus on the relationship between the mechanisms and the causes of accidents to be useful in the prevention of accidents.
Acknowledgment
This work was supported by research grant for medical student from Yeungnam University college of medicine.