Secular trends of body sizes in Korean children and adolescents: from 1965 to 2010
Article information
Abstract
An anthropometric survey is one of the most important approaches to use when evaluating the health status of children. Secular trends in body sizes, such as height, weight, head circumference, chest circumference, and body mass index showed significant changes over 40 years in Korea. A series of periodic surveys were conducted in 1967, 1975, 1985, 1997, and 2005 by the Korean Pediatric Society and Ministry of Health and Welfare. The quality of data from school health examinations and the Korea National Health and Nutrition Examination Survey has improved, so we can use them now as resources for anthropometric analysis. The final height differences between 1965 and 1997 were 4.5 cm both in boys (168.9 cm in 1965; 173.4 cm in 1997) and girls (155.9 cm in 1965; 160.4 cm in 1997). The differences between 1997 and 2005 were 0.9 cm in boys (174.3cm in 2005) and 0.8 cm in girls (161.2 cm in 2005). There was no difference in final height measurements between 2005 and 2010. An increase in body size at earlier teen ages was pronounced during these decades compared to the previous generation; however, little change has been identified more recently. Body size has been increasing, and obesity has become more prevalent. Systems that gather data should be updated in order to cope with these secular trends. In an upcoming era of secular trends that would be in a slow transition, several surveys that include body measurements should be prepared to meet future needs.
Introduction
Body size is known to change in response to socioeconomic changes1). Many historical approaches in anthropometry, performed mainly in Western countries, have clearly shown that the height and weight of children and adolescents had changed a great deal during the last centuries. An anthropometric survey is one of the most important approaches used to evaluate the health status of individual children and to provide information for public purposes2). In Korea, a series of periodic surveys was performed in 1967, 1975, 1985, 1997, and 2005 by the Korean Pediatric Society and Korea Ministry of Health and Welfare3-7). These surveys were developed at teaching hospitals, selected based on regional allocation, and were non-randomized. Data under 2 years of age was gathered mostly by hospitals and after around 2 years of age was by community based survey. Recently, the Ministry of Education, Science, and Technology, with the support of the Korean Pediatric Society, revised school health examinations to reflect modern statistics, such as adopting updated growth references and stratified random sampling. In addition, the Korea National Health and Nutrition Examination Surveys were ongoing since 1998 under the supervision of Korea Centers for Disease Control and Prevention8,9). These recent surveys can be the resources to study about the body measurements in children. The goal of this article was to provide an overview about the secular trend in Korean children's growth by briefly reviewing past data and comparing the data to the updated surveys.
Age adjustment and analysis
There are many data with anthropometric information; however, few have proved useful in making scientific comparisons. Many of them lack the exact age of children. As a result, in this review, only previously published data and raw data with exact ages were compared. To make exact comparisons, ages were adjusted. Data from recent surveys with ages rounded to the year generally needed to be recalculated because old reports, to which recent surveys were to be compared, generally rounded ages down to the nearest age. It was the previous standard to make groups based on the closest year of age because most nationwide surveys that were to be used to make growth charts were made in an era without personal computers10,11). In this article, statistical software Stata ver. 12 (Stata Co., College Station, TX, USA) and MS Excel (Microsoft Inc., Seattle, WA, USA) were used to generate the new results.
Rapid secular trends of body sizes in Korea
1. Dramatic incremental changes in height and weight in accordance with a rapid socioeconomic transition
1) Height
According to the 2005 survey report performed by the Korean Pediatric Society, in association with the government12), the mean height of boys was 50.4 cm at birth, 77.3 cm at 12 months, and 174.3 cm at 20 years. The mean height of girls was 49.9 cm at birth, 76.4 cm at 12 months, and 161.2 cm at 20 years. To demonstrate the secular trend, in 1965, the mean height of boys was 74.8 cm at 12 months, and in 2005, the mean height was 77.3 cm (2.5 cm gain). In 1965, the mean height of girls at 12 months was 72.8 cm, and, in 2005, the mean height was 76.4 cm (3.6 cm gain). In 1965, the mean height of boys at 7 years was 112.5 cm, and in 2005, it was 124.9 cm (12.4 cm gain). In 1965, the mean height of boys at 20 years was 168.9 cm; in 1997, it was 173.4 cm; and in 2005, it was 174.3 cm (4.5 cm, 0.9 cm gain, respectively). In 1965, the mean height of girls at 7 years was 112.0 cm, and in 2005, it was 123.7 cm (11.7 cm gain). In 1965, the mean height of girls at 20 years was 155.9 cm; in 1997, it was 160.4 cm; and in 2005, it was 161.2 cm (4.5 cm, 0.8 cm gain, respectively). Compared to 2010 school health examination data8), there was almost no change in the final height of late adolescents in 2005 (173.5 cm in boys, 160.6 cm in girls). In summary, there were great secular changes in height from 1965 to 1997; nevertheless, there were few changes in the final height after 1997. As for growth acceleration in puberty, during the past decades it seemed quite pronounced; however, the rate now seems much slower (Fig. 1, 2).
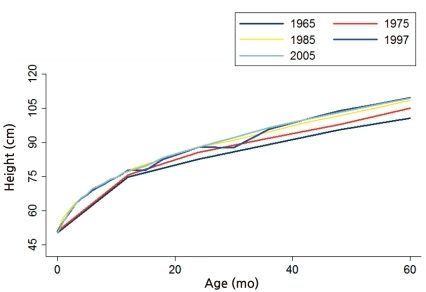
Plotted mean height in boys less than 60 months showed pronounced changes from 1965 to 1985. This pattern of secular change has varied. Differences were reduced from 1997 to 2005.
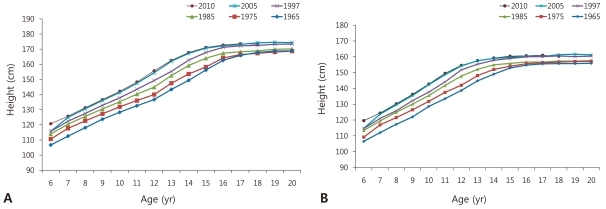
Plotted mean height from 6 to 20 years showed pronounced changes from 1965 to 1997 (boys in A, girls in B). This pattern of secular change has varied. Differences were reduced from 1997 to 2010. In mid adolescents, growth acceleration in puberty appeared rapid during the decades.
2) Weight
The mean weight of boys was 3.3 kg at birth, 10.3 kg at 12 months, and 70.9 kg at 20 years. The mean weight of girls was 3.2 kg at birth, 9.8 kg at 12 months, and 55.1 kg at 20 years. To illustrate the secular trend, in 1965, the mean weight of boys at 12 months was 8.9 kg; in 1985 it was 10.3 kg, and in 2005, it was also 10.3 kg. In 1965, the mean weight of girls was 8.3 kg, and in 2005, it was 9.8 kg. In 1965, the mean weight of boys at 7 years was 19.1 kg; in 1985, it was 22.3 kg, and in 2005, it was 26.8 kg. In 1965, the mean weight of boys at 20 years was 58.2 kg; in 1985, it was 61.9 kg, and in 2005, it was 70.9 kg. In 1965, the mean weight of girls at 7 years was 19.1 kg; in 1985, it was 21.2 kg, and in 2005, it was 25.5 kg. In 1965, the mean weight of girls at 20 years was 51.5 kg; in 1985, it was 51.8 kg, and in 2005, it was 51.5 kg in 2005. Weight also has changed dramatically during the past decades and there seemed no stagnation in the secular trend. Recent school examination data showed that there seemed little change in weight across age ranges during the last few years.
3) Head circumference
The mean head circumference (HC) of boys was 34.5 cm at birth and 46.3 cm at 12 months. The mean HC of girls was 34.1 cm at birth and 45.4 cm at 12 months. To demonstrate the secular trend, in 1965, the mean HC of boys at 12 months was 45.8 cm; in 1985, it was 46.5 cm, and in 2005, it was 46.3 cm. In 1965, the mean HC of girls was 44.8 cm, and in 2005, it was 45.4 cm.
4) Chest circumference
The mean chest circumference (CC) of boys at birth was 33.0 cm; at 12 months it was 47.5 cm, and at 17 years it was 77.5 cm. The mean CC of girls at birth was 32.7 cm; at 12 month, it 46.6 cm, and at 17 years it was 77.5 cm. To demonstrate the secular trend, in 1965, the mean CC of boys at 12 months was 46.4 cm; in 1985, it was 47.2 cm, and in 2005, it was 47.5 cm. In 1965, the mean CC of girls at 12 months was 45.3 cm, and in 2005, it was 46.6 cm. In 1965, the mean CC of boys at 7 years was 56.8 cm; in 1985, it was 57.6 cm, and in 2005, it was 61.6 cm. In 1965, the mean CC of boys at 17 years was 83.3 cm; in 1985, it was 82.3 cm, and in 2005, it was 77.5 cm. In 1965, the mean CC of girls at 7 years was 55.9 cm; in 1985, it was 55.8 cm, and in 2005, it was 59.6 cm. In 1965, the mean CC of girls at 17 years was 75.8 cm; in 1985, it was 76.2 cm, and in 2005, it was 77.6 cm. Detailed data of body measurements are summarized in Table 1.

Summary of the Anthropometric Measurements from 1975 to 2010
2. Obesity epidemic, ongoing Problem
According to the 2005 survey, in 1997, the mean body mass index (BMI) of boys at 12 months was 17.2 kg/m2, and in 2005, it was 17.2 kg/m2. In 1997, the mean BMI of girls at 12 months was 16.9 kg/m2, and in 2005, it was 16.7 kg/m2. In 1997, the mean BMI of boys at 7 years was 16.4 kg/m2, and in 2005, it was 17.1 kg/m2. In 1997, the mean BMI of boys at 20 years was 22.1 kg/m2, and in 2005, it was 23.3 kg/m2. In 1997, the mean BMI of girls at 7 years was 16.0 kg/m2, and in 2005, it was 16.5 kg/m2. In 1997, the mean BMI of girls at 20 years was 21.5 kg/m2, and in 2005, it was 21.1 kg/m2. The prevalence of obesity increased significantly during the period. In 2005, 9.7% (11.3% for boys, 8.0% for girls) of Korean children and adolescents were obese, and 19.0% (19.7% for boys, 18.2% for girls) were overweight or obese. The prevalence of obesity increased from 5.8% in 1997 to 9.7% in 200513). In 2010, the prevalence of overweight or obesity was still high-approximately 20% in high school boys and over 17% in girls (Table 2).
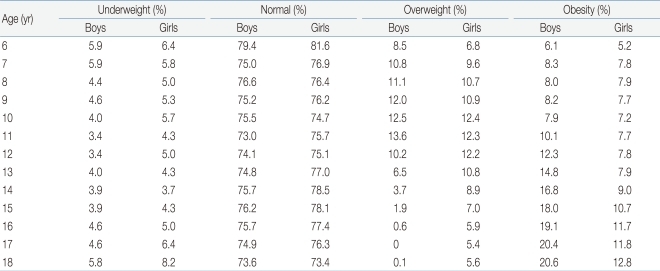
Prevalence of Underweight and Obesity in School-Aged Children in 2010
Discussion
1. The need to improve the quality of surveys and data management
In Korea, the primary aim of periodic anthropometric surveys is to gather data to construct the reference growth charts, which would be an appropriate fit for local needs. Growth charts have been important tools in pediatrics in order to keep pace with children's growth in various fields of clinical medicine in Korea. In public health, charts were also used as references to assess the prevalence of obesity and under-nutrition and to monitor the trend of children's growth. To improve the quality of the growth charts updated methodologies are necessary, and it would be also essential to get the anthropometric data together, if there were any childhood survey conducted in scientific and strategic way, even though the primary purpose of the survey was something else. Currently, changes in final adult height, which is usually achieved in the late teenage years, has plateaued in Korea, in contrast with the changes in previous decades. Therefore, the need to track changes in all the children's heights has diminished. Regarding surveys for the next generation, we should establish a new purpose for anthropometric surveys, such as to monitor the trend in obesity or underweight, to find the most prevalent regions with problems, and to discover health risk-related factors. These needs usually require more structured approaches, which would require additional funding. We also need to improve the systems for data imputation, data cleaning, descriptive statistics, and analytic approaches, and we need to develop strategies to open available databases to the public as much as possible. The largest and most robust database related to health and disease in Korea is that of the National Health Insurance Company; however, it is not easy to access that data because of such strong legal barriers. There has been some effort to build new systems to access this national database through legislation. Currently available anthropometric databases in Korea are described in Table 3.
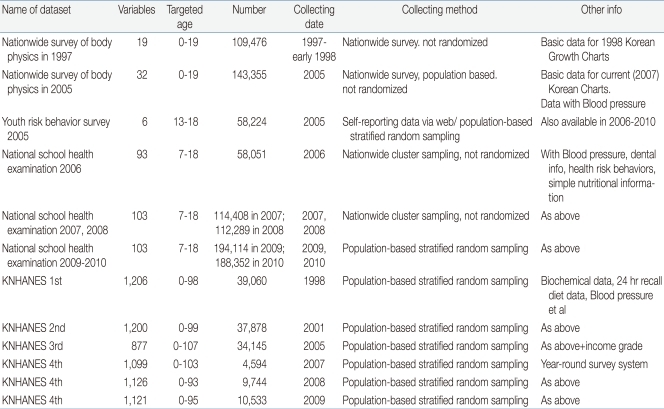
Currently Available Korean Databases with Childhood Anthropometric Information
School health is one of the very important issues in many countries in the world in the era of the global epidemic of non-communicable diseases. Schools are key spots for physicians, healthcare workers, and policymakers to intervene in the disease process and health-related behaviors, both for the individual and the population at large. In Korea, the national school health-screening program was reformed in 2006, according to the School Health Law, which was promulgated in 2005. With this new health program, Korean National School Health Samples were also revised from 2009, which had been based on random and stratified sampling. A recently published government report addressed the Korean National Sample Data from the National School Health Examination in 2009 and 20108).
2. Future directions
Secular trends over forty years in Korea have shown dramatic changes, which was accompanied by rapid socioeconomic transition. Even though those changes seem to have plateaued recently, there is still no evidence to say that the secular trend has reached its goal. Many observations show that an increase in the body size of a population correlates with improved health outcomes1). If the environments for children and adolescents could be improved optimally, the secular trend in height would resume.
Acceleration of the start of puberty has been an important medical issue more concerned with obesity and precocious puberty. It seems that obesity could speed up the start of puberty in some children, with general trend of increasing prevalence of precocious puberty. It will be more important for a pediatrician, or primary care physician, to deliver precise information about puberty and the normal trend of growth acceleration to parents and children.
Many parents are concerned about their children's growth and are sometimes eager to increase their children's height if possible. To improve the current pattern of using growth charts, research will be needed regarding the adoption of new World Health Organization Growth Standards and the improvement of our 2007 Korean references.
It would also be a great challenge to assess the exact anthropometric status in North Korea. According to a 2005 report from United Nations Children's Fund (UNICEF), the prevalence of stunted children (height-for-age <-2 Z-score) aged 0 to 71 months in 2004 was 37.0%15). The prevalence of severe stunting (<-3 Z-score) was 12.2%. The prevalence of underweight children (weight-for-age <-2 Z-score) aged 0 to 71 months in 2004 was 23.4%. These findings suggest that severe stunting in children, attributed to chronic malnutrition, was quite prevalent in North Korea, even though they share the same genetic background with South Korea. It would be necessary to know about the exact burden of nutritional intervention in terms of anthropometry. Co-operation with the international non-governmental organizations, such as UNICEF, will be crucial to gain access to them.