The correlation of blood pressure with height and weight in Korean adolescents aged 10-19 years; The Korean National Health and Nutrition Examination Surveys (2009-2011)
Article information
Abstract
Purpose
Height-specific blood pressure (BP) is the standard parameter used to diagnose childhood hypertension. However, there has been some argument that weight may be a better variable than height in the reference BP standards. Therefore, before assessing the BP status using the reference BP standards, a basic understanding of the fundamental association of weight and height with BP is required.
Methods
In the present study, we analyzed the correlation of BP with height and weight in Korean adolescents (age, 10-19 years), using data from the Korean National Health and Nutrition Examination Surveys (2009-2011).
Results
Systolic BP (SBP) was more closely correlated with weight than with height in the normal weight (body mass index [BMI], ≤85th percentile) and overweight (BMI, >85th percentile) groups and in the normal waist circumference (WC, ≤90th percentile) and high WC (>90th percentile) groups in both sexes. Diastolic BP (DBP) had a higher correlation with height than with weight in the normal weight and normal WC groups, whereas weight was more closely associated with DBP than height in the overweight and high WC groups in both boys and girls.
Conclusion
In Korean adolescents, weight had a greater effect on SBP than height in both the normal weight and overweight groups. DBP was mainly affected by height in the normal weight group, whereas weight was the major determinant of DBP in the overweight group. Therefore, it may be necessary to consider weight in the establishment of reference BP standards.
Introduction
Hypertension is a major health problem in most developed and developing countries. Worldwide, about one billion people were found to have hypertension1), and 13% of all deaths were closely related to hypertension2). Hypertension at an early age has been shown to develop into adulthood hypertension3), and it is thus important to identify and control childhood hypertension.
Recent guidelines on the diagnosis of high blood pressure (BP) in children and adolescents provide reference BP standards based on sex, age, and height1). There has been some argument that using weight is better than using height as a variable in the reference BP standards4), because a number of studies have shown that weight is more closely associated with BP levels than height in children and adolescents1,4,5). However, weight-specific BP standards are not generally adopted because they would conceal any effects of obesity on BP5).
Both growth and obesity are known to contribute to BP changes. Height and growth are correlated, and weight is associated with both growth and obesity. Before assessing BP status using the reference BP standards in children or adolescents, a basic understanding of the fundamental correlation of weight and height with BP is required.
In the present study, we analyzed the correlations of weight and height with systolic BP (SBP) and diastolic BP (DBP) in Korean adolescents using data from the Korean National Health and Nutrition Examination Survey (KNHANES). Additionally, we examined these relationships in (1) different age groups, (2) normal and overweight groups, and (3) normal and high waist circumference (WC) groups.
Materials and methods
1. Data
Data from the KNHANES, conducted from 2009 to 2011, were used in the present study6). Every year, the KNHANES collects health-related information from stratified multistage probability samples of Korean households representing the civilian, noninstitutionalized population. The KNHANES used population and housing census data (2005) as a sampling frame and conducted rolling sampling surveys for national representativeness6). A health interview survey, health behavior survey, and health examination survey were performed in a mobile health examination center, and a nutrition survey was conducted at home. More details about study design and methods are provided elsewhere (http://knhanes.cdc.go.kr/)6). For the present study, we analyzed 3,363 adolescents aged 10-19 years (1,757 boys and 1,606 girls), who completed both anthropometric and BP measurements. Data are publicly available from the Korea Centers for Disease Control and prevention (CDC)6). This study was approved by the institutional review board of Inje University Sanggye Paik Hospital.
2. Anthropometry and obesity measures
Body weight was measured to the nearest 0.1 kg on a calibrated balance-beam scale with participants wearing a lightweight gown or underwear. Height was measured in the standing position to the nearest 0.1 cm using a stadiometer. WC was measured to the nearest 0.1 cm at the midpoint between the bottom of the rib cage and the top of the lateral border of the iliac crest with minimal respiration. Body mass index (BMI) was calculated using the following formula: BMI=weight (kg)/height (m)2. We determined the sex- and age-specific percentile cutoffs for BMI and WC, using Korean CDC reference data7). We defined the 85th percentile for BMI as the cutoff for "overweight" and the 90th percentile for WC as the cutoff for "high WC."
3. BP measurement
BP was measured in a seated position after 5 minutes of quiet rest using a mercury sphygmomanometer with an appropriately sized cuff, with the right arm positioned at the level of the heart. The same instruments (baumanometer, W.A. Baum Co. Inc., Copiague, NY, USA; sphygmomanometer, Littmann Stethoscopes, 3M, St. Paul, MN, USA) were used for BP measurements in all of these surveys, and BP measurements were performed by trained healthcare personnel (nurses and technicians). The first (K1, the first appearance of sound) and fifth (K5, the disappearance of sound) Korotkoff sounds represented SBP and DBP, respectively. BP was measured 3 times in the same part of the arm at 30-second intervals for each participant, and mean SBP and mean DBP were calculated as an average of the second and third SBP and DBP measurements, respectively.
4. Statistical analysis
Data are presented as means±standard deviation. The partial correlations of weight and height with SBP and DBP were analyzed. Because of the known influence of sex on body size and BP, analyses were performed separately for boys and girls. Additionally, we conducted analyses in different age groups (10-12, 13-16, and 17-19 years), in normal and overweight groups, and in normal and high WC groups in boys and girls.
We used various sets of adjustments in a partial correlation analysis; M1 represented the adjustment for age, M2 for age and weight, and M3 for age and height. Two-tailed P values<0.05 indicated statistical significance.
Results
1. Characteristics of the participants
The characteristics of the participants are presented in Table 1. A total of 3,363 adolescents aged 10-19 years (1,757 boys and 1,606 girls) were evaluated. Height, weight, BMI, WC, SBP, and DBP were higher in boys than in girls.
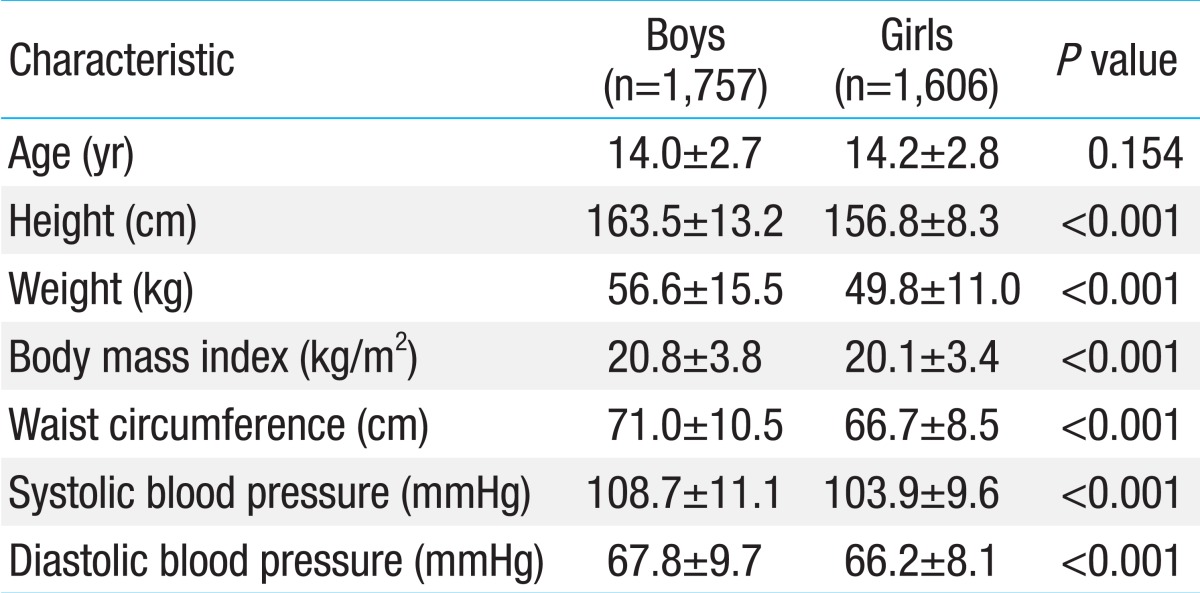
Characteristics of the study participants
2. Correlation of SBP with height and weight
Table 2 shows the correlation of SBP with height and weight in total and separate age groups (10-12, 13-16, and 17-19 years) in boys and girls. After adjustment for age, SBP was more closely correlated with weight than with height in total and in all age groups in both boys and girls (Table 2). After additional adjustment for weight, height maintained its positive association with SBP only in girls aged 10-12 years, but not in the other groups of boys or girls. After additional adjustment for height, weight maintained its positive correlation with SBP in total and in all age groups in both genders.
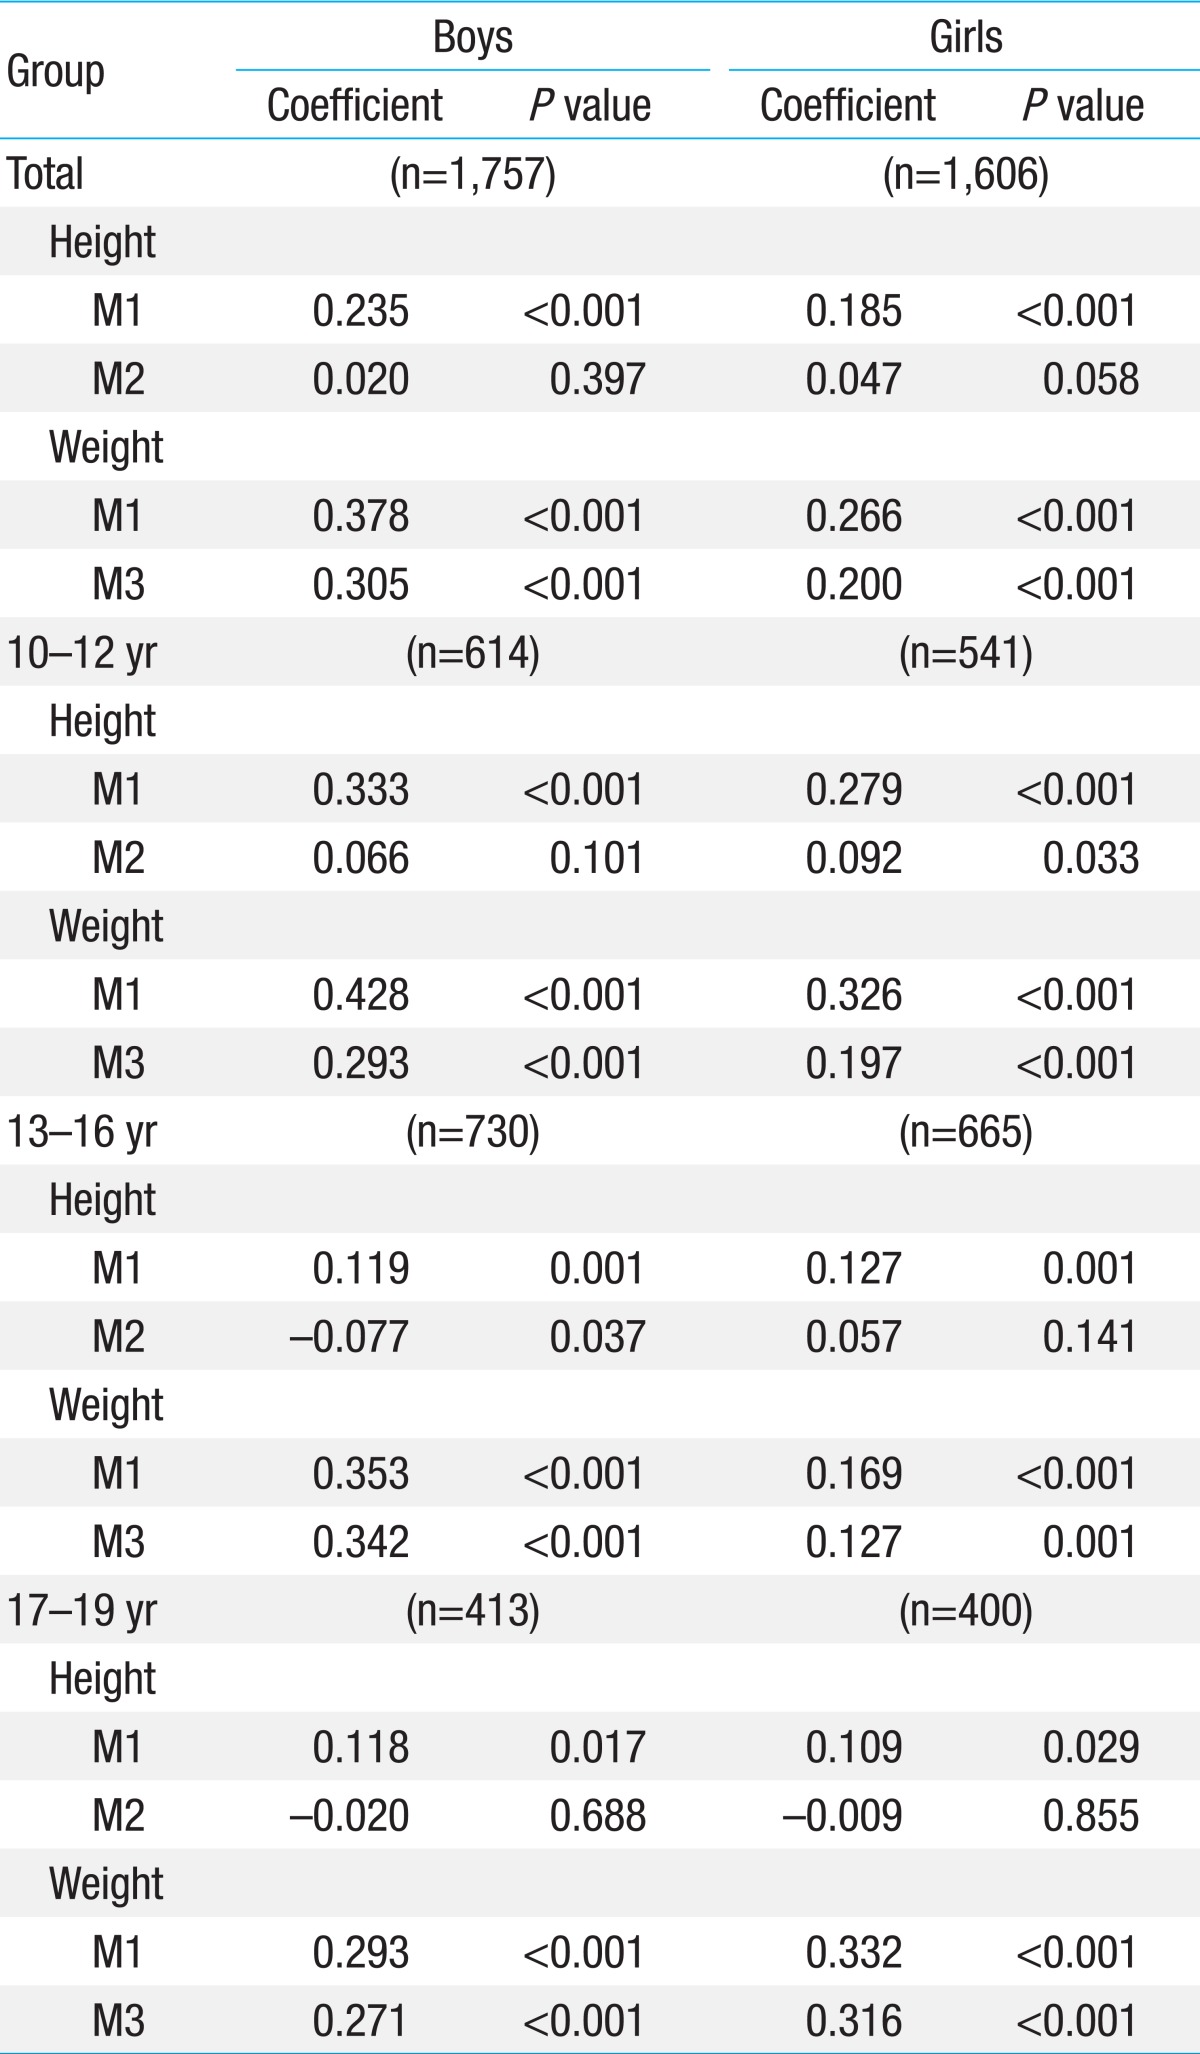
Correlation of systolic blood pressure with height and weight (overall and by age group)
We analyzed the correlations of height and weight with BP, separately, in the normal weight (BMI≤85th percentile) and overweight (BMI>85th percentile) groups (Table 3). After adjustment for age, SBP had a stronger correlation with weight than with height in the normal weight and overweight groups in both sexes. Additional adjustment for weight eliminated the association between height and SBP in the normal weight and overweight groups in both boys and girls. In contrast, the correlation between weight and SBP was well preserved after additional adjustment for height in the normal weight and overweight groups in both genders.
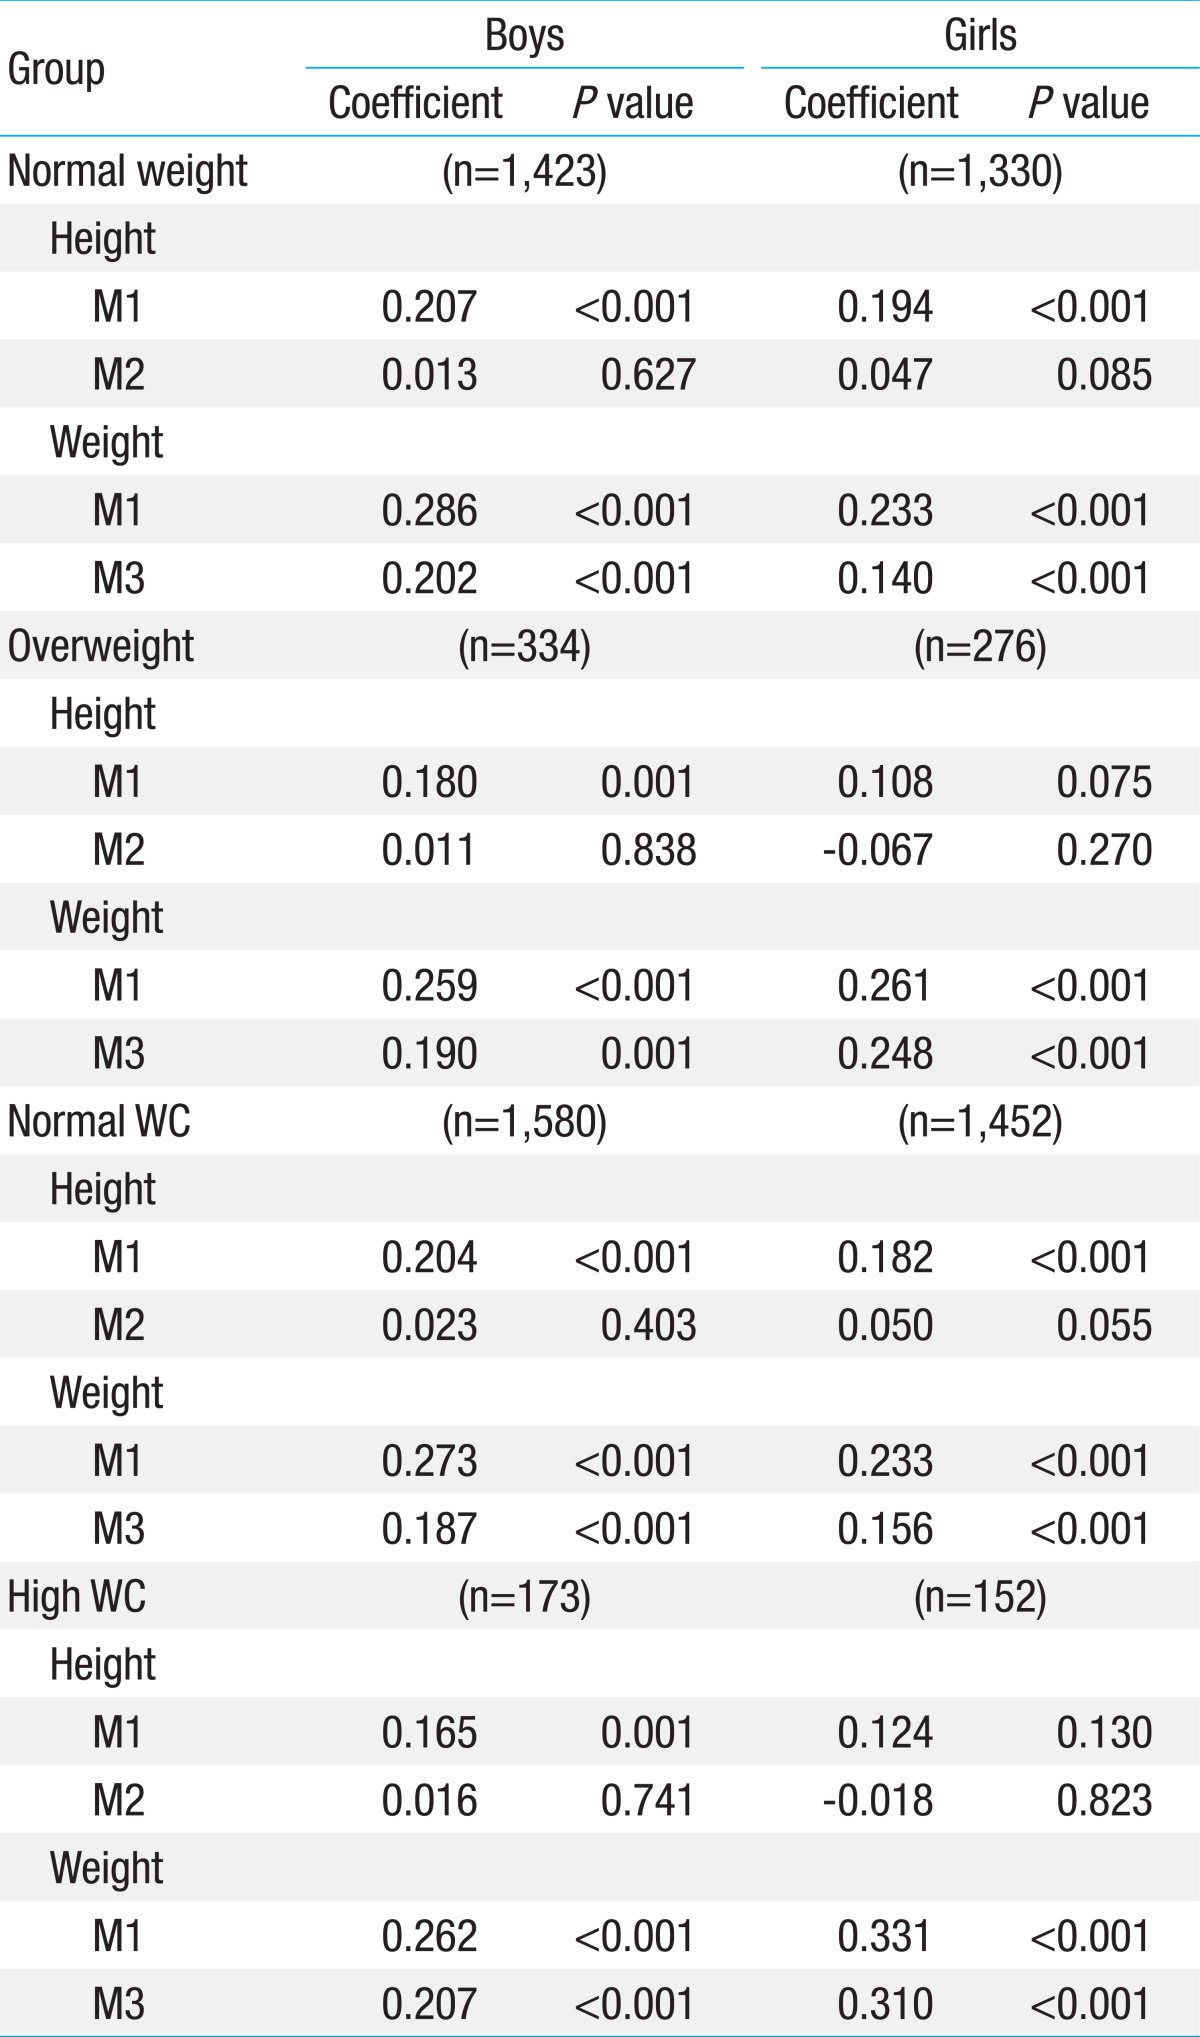
Correlation of systolic blood pressure with height and weight in the normal and overweight groups and in the normal and high waist circumference groups
Additionally, analysis of the association of height and weight with BP was performed separately in the normal (WC≤90th percentile) and high (WC>90th percentile) WC groups (Table 3). After adjustment for age, SBP was more closely associated with weight than with height in the normal and high WC groups in boys and girls. After an additional adjustment for weight, height lost its positive association with SBP in the normal and high WC groups in both sexes. However, even after additional adjustment for height, SBP was still positively correlated with weight in the normal and high WC groups in both genders.
3. Correlation of DBP with height and weight
In the analysis of the age-adjusted correlation of DBP with height and weight, DBP had a stronger correlation with weight than with height in total and in all age groups among boys (Table 4). In contrast, DBP was more closely associated with height than with weight in total and in all age groups among girls. After additional adjustment for weight, height maintained its positive correlation with DBP in total and in all age groups in girls, but not in boys. After additional adjustment for height, the association between weight and DBP was preserved in total and in all age groups only in boys, but not in girls.
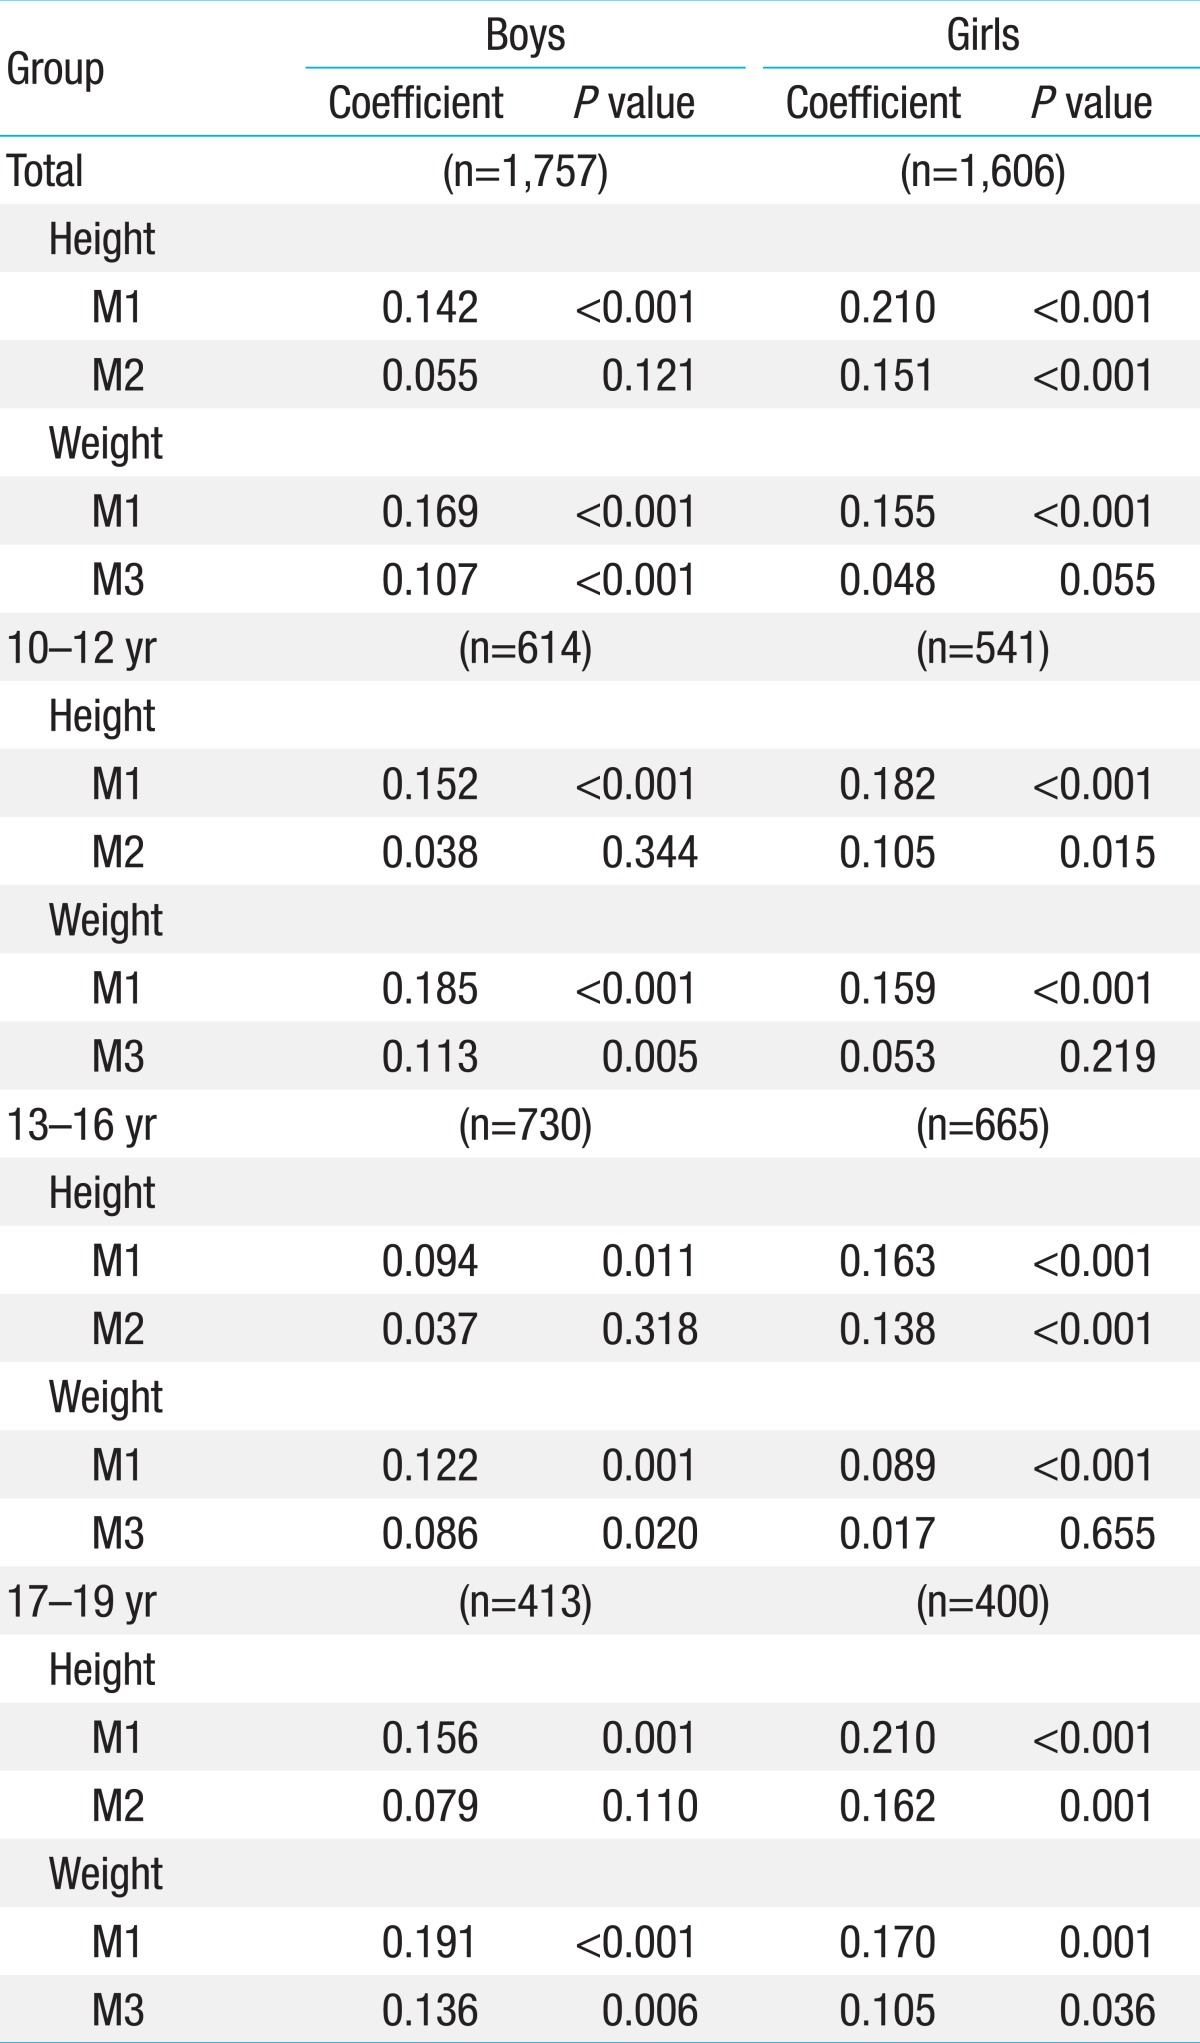
Correlation of diastolic blood pressure with height and weight (overall and by age group)
In the normal weight and normal WC groups, DBP was affected more by height than by weight in the age-adjusted analysis of both sexes. After additional adjustment for weight, height maintained its association with DBP, whereas additional adjustment for height eliminated the correlation between weight and DBP in both boys and girls (Table 5).
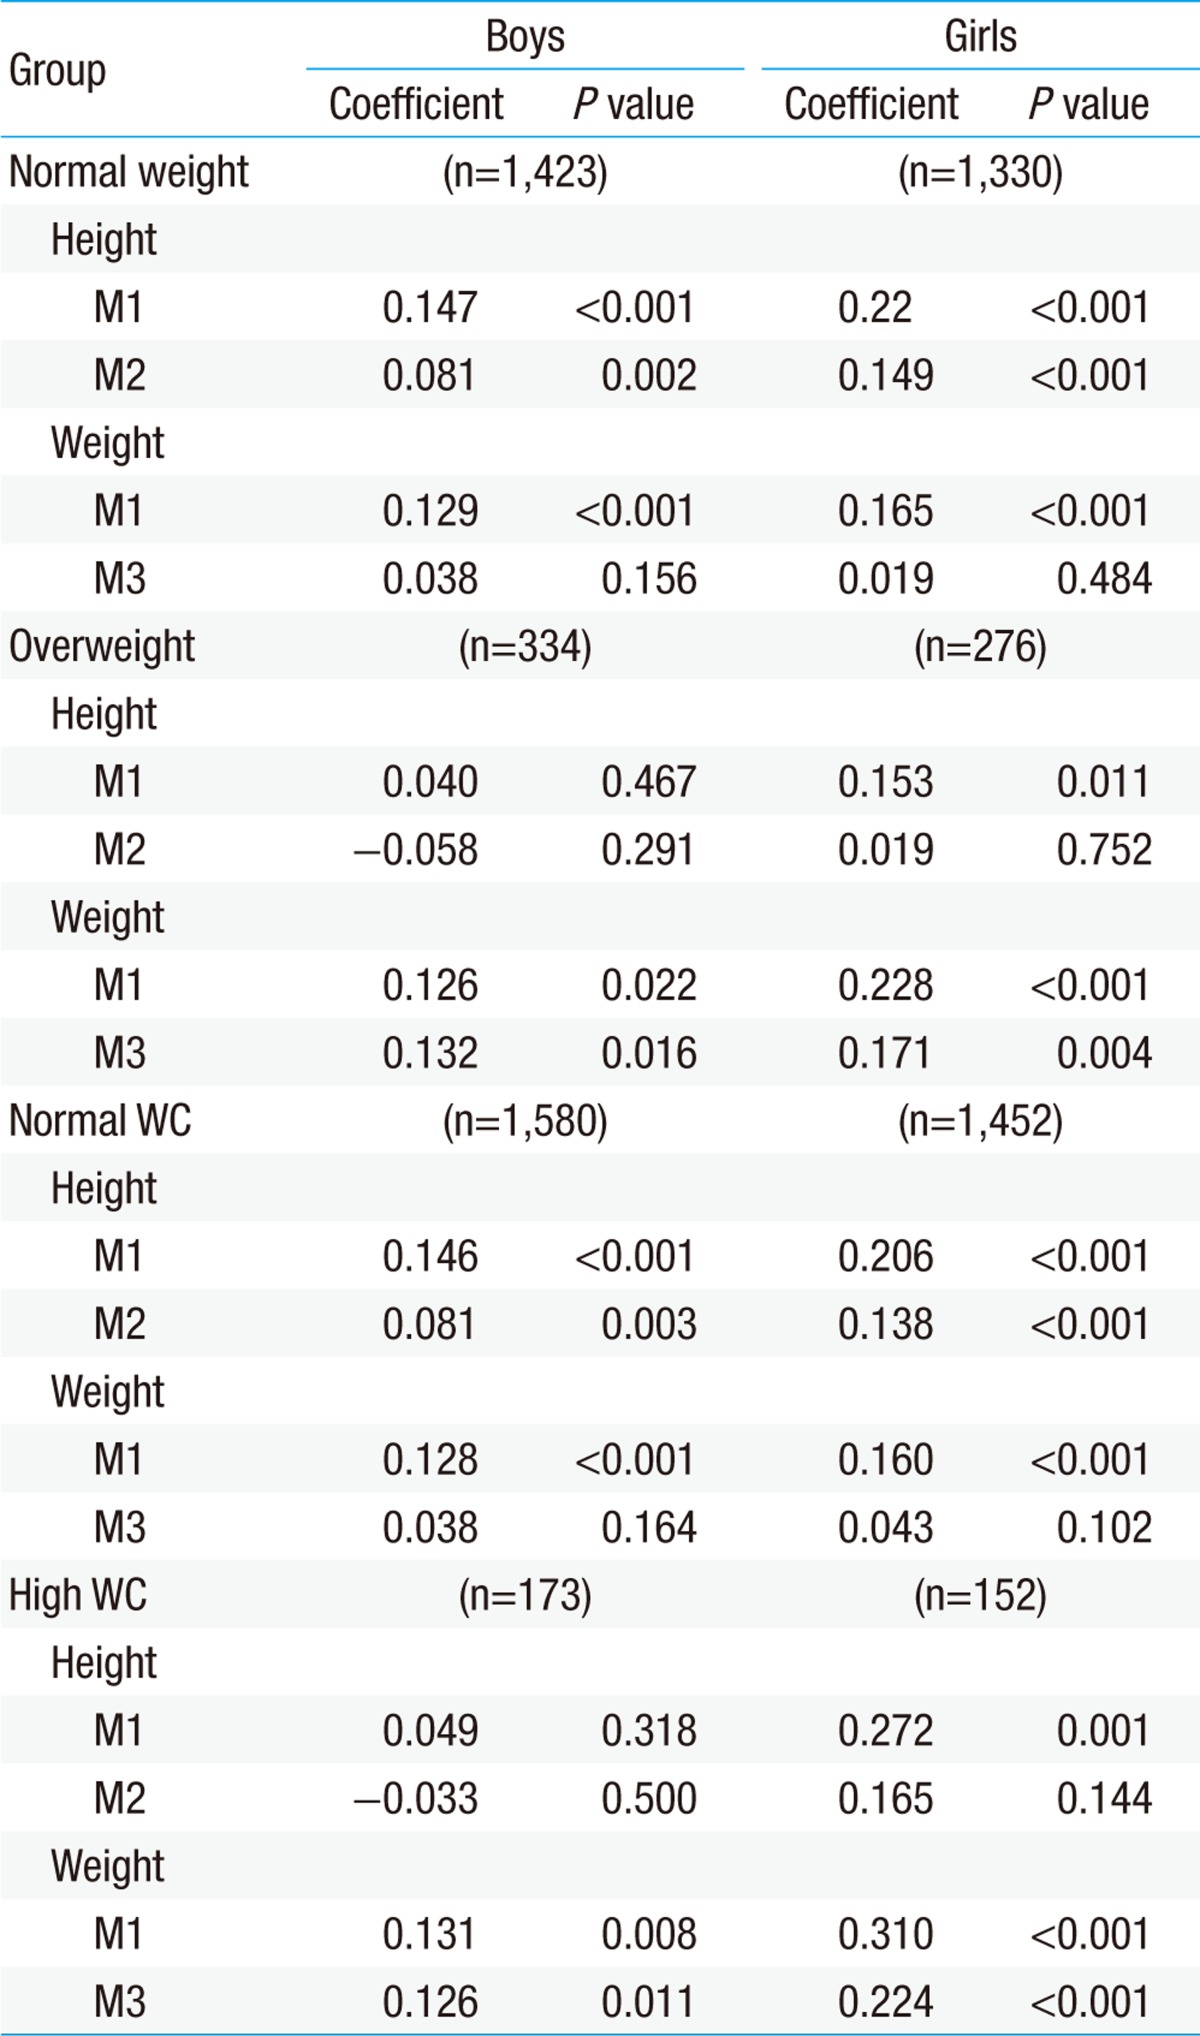
Correlation of diastolic blood pressure with height and weight in the normal weight and overweight groups and in the normal and high waist circumference groups
The analysis in the overweight and high WC groups indicated that DBP had a stronger correlation with weight than with height in both genders, when adjusted for age. Upon additional adjustment for weight, the association between DBP and height was eliminated, while weight maintained its positive influence on DBP in both boys and girls after additional adjustment for height (Table 5).
Discussion
The present study provides an understanding of the fundamental relationship of BP with weight and height in Korean adolescents. The main findings of this study are that (1) SBP is more closely associated with weight than with height in all age groups, in normal and overweight groups, and in normal and high WC groups in both boys and girls; (2) DBP has a stronger correlation with weight than with height in all age groups in boys, whereas height is more closely correlated with DBP than weight in all age groups in girls; (3) in the normal weight and normal WC groups, DBP has a stronger association with height than with weight in both genders, while DBP is more closely related with weight than with height in the overweight and high WC groups in both boys and girls. To the best of our knowledge, this is the first nation-wide population study of the correlation of height and weight with SBP and DBP among Korean adolescents.
Most previous studies reported that SBP and DBP are more closely associated with weight than with height in children and adolescents1,4,5,8,9), while only a few studies showed a greater association of SBP and DBP with height than with weight10). Park et al.4) found that weight, but not height, was an independent predictor of SBP and DBP levels in 7,208 children aged 5-17 years in the United States (US), and suggested that normative BP standards presented according to age in a graphic form showing percentile curves may be more useful and logical, since they found no rationale for presenting BP standards according to age and height percentiles4). Rosner et al.5) reported that weight rather than height was a major determinant of SBP and DBP in 49,967 normal-weight children aged 1-17 years in the US. Sung et al.9) showed that SBP and DBP had stronger correlations with weight than with height in 14,842 children aged 6-18 years in Hong Kong. In contrast, Taksande et al.10) reported that SBP and DBP were more closely correlated with height than with weight in 2,643 children aged 6-17 years in India.
Consistent with most previous studies, the present study found that SBP has a higher correlation with weight than with height in all different groups of Korean adolescents. When adjusted for weight or height, only weight, but not height, was independently associated with SBP in all cases in both sexes. These results suggest that the increase in body mass elevates SBP in all age groups in both boys and girls regardless of height or obesity (general or central).
In the present study, there was a difference between boys and girls in the relationship of DBP with height and weight; DBP was more closely correlated with weight than with height in boys, and with height than with weight in girls. Upon adjustment for weight or height, only weight in boys, and only height in girls were independent determinants of DBP in all age groups. However, this gender difference in the association of DBP with weight and height disappeared after the subjects were divided into normal and overweight groups or into normal and high WC groups. In both genders, DBP had a stronger correlation with height than with weight in the normal weight and normal WC groups, and with weight than with height in the overweight and high WC groups. After adjusting for weight or height, we found that height, but not weight, was independently associated with DBP in the normal weight and normal WC groups, whereas weight, but not height, was an independent determinant for DBP in the overweight and high WC groups among both boys and girls.
It is possible that the intravascular hydrostatic pressure gradients between baroreceptors (especially the carotid sinus) and other vessels become greater in taller individuals because of gravity, resulting in a high DBP set-point through inhibition of the baroreflexes11). This hypothesis provides an explanation for the relationship between height and DBP in the normal weight and normal WC groups in our study.
The hemodynamic changes related to obesity are characterized by an increase in cardiac output associated with expanded intravascular and cardiopulmonary volume, and with an inappropriate peripheral vascular resistance12). It has been suggested that the BP control mechanism by diuresis and natriuresis is shifted toward higher BP levels in obesity13,14). During the early phase of obesity, primary sodium retention occurs because of renal tubular reabsorption13). Thereby, extracellular-fluid volume is expanded, and the renal-fluid apparatus is reset to high BP levels13). A number of studies found that the sympathetic nervous system is activated in obese individuals15-17), which is likely to cause an elevation in BP. Plasma renin, angiotensin II, and aldosterone activities are also increased in obesity18), and can contribute to elevated BP. Insulin resistance induced by obesity may promote changes in vascular function, also resulting in BP elevation19,20). Leptin and other neuropeptides are also known to play roles in the elevation of BP in obese individuals21-23). Considering that weight is closely associated with obesity as well as with growth, these theories related to BP and obesity explain our results that weight is the main determinant of SBP in all groups and DBP in the overweight and high WC groups in both genders. However, in nonobese groups (the normal weight and normal WC groups), height seems to have a greater effect on DBP than weight in Korean adolescents.
In summary, the present study showed that weight has a stronger correlation with SBP in all subjects and with DBP in the obese group compared with height. Therefore, it may be necessary to consider weight during the establishment of reference BP standards.
This study used the KNHANES data, which has nationwide representation, by using census data and conducting a rolling sampling survey. However, a nationwide school-based study may be required in order to achieve more representative data in Korean adolescents.
Acknowledgments
This work was supported by research funds (2010) from Inje University College of Medicine.
Notes
No potential conflict of interest relevant to this article was reported.