The usefulness of soluble transferrin receptor in the diagnosis and treatment of iron deficiency anemia in children
Article information
Abstract
Purpose
Soluble transferrin receptor (sTfR) is a truncated extracellular form of the membrane transferrin receptor produced by proteolysis. Concentrations of serum sTfR are related to iron status and erythropoiesis in the body. We investigated whether serum sTfR levels can aid in diagnosis and treatment of iron deficiency anemia (IDA) in children.
Methods
Ninety-eight patients with IDA were enrolled and were classified according to age at diagnosis. Group 1 comprised 78 children, aged 6-59 months, and group 2 comprised 20 adolescents, aged 12-16 years.
Results
In group 1, patients' serum sTfR levels correlated negatively with mean corpuscular volume; hemoglobin (Hb), ferritin, and serum iron levels; and transferrin saturation and positively with total iron binding capacity (TIBC) and red cell distribution width. In group 2, patients' serum sTfR levels did not correlate with ferritin levels and TIBC, but had a significant relationship with other iron indices. Hb and serum sTfR levels had a significant inverse relationship in both groups; however, in group 1, there was no correlation between Hb and serum ferritin levels. In 30 patients of group 1, serum sTfR levels were significantly decreased with an increase in Hb levels after iron supplementation for 1 month.
Conclusion
Serum sTfR levels significantly correlated with other diagnostic iron parameters of IDA and inversely correlated with an increase in Hb levels following iron supplementation. Therefore, serum sTfR levels can be a useful marker for the diagnosis and treatment of IDA in children.
Introduction
Iron deficiency is the most common nutritional deficiency in the world and 15%-20% of the entire population has iron deficiency anemia (IDA)1). Especially, IDA is the most common cause of anemia in infants aged 9-24 months. Even, in patients without anemia, iron deficiency still causes psychomotor and cognitive impairment, developmental delay and also induces an increase in susceptibility to infectious diseases and mortality2,3).
To assess the body's iron status in IDA, various tests including serum iron, unsaturated iron binding capacity (UIBC), serum ferritin, total iron binding capacity (TIBC), transferrin saturation, and zinc protoporphyrin concentration in erythrocytes are used4,5). Soluble transferrin receptor (sTfR) is produced by proteolysis of membrane transferrin receptor (TfR). sTfR represents the state of TfR as a cleaved portion of it and TfR increases when intracellular iron concentration is low. Therefore, sTfR is a useful clinical parameter for assessing functional iron deficiency and erythropoiesis. The sTfR level is elevated in various iron deficiency states such as iron-deficient erythropoiesis, and IDA. Also, there are reports suggesting that sTfR is effective in distinguishing anemia due to chronic inflammation from IDA6,7,8). Although ferritin has a problem that its level rises in chronic inflammation, sTfR is better to make a distinction between IDA and chronic inflammation because it is less related to it.
This study was performed to assess the correlation between sTfR concentration and various diagnostic tests for IDA in anemic children and adolescents in whom IDA occurs frequently. We also attempted to evaluate the utility of sTfR as an indicator of the diagnosis and treatment efficacy in IDA through the change in sTfR levels after iron supplementation.
Materials and methods
1. Subjects
This study was conducted in 6- to 59-month-old children and 12- to 16-year-old adolescents who visited or who were hospitalized in the Pediatrics Department of School of Medicine of Wonkwang University Hospital from January 1 2004 to December 31 2013 and received the diagnosis of IDA. The patients were categorized into 2 groups according to the World Health Organization (WHO) standard which based on age. The first patient group included 78 patients aged 6 to 59 months, and the second patient group included 20 patients aged 12 to 16 years.
2. Methods
Complete blood count was obtained using Sysmex XE-2100 automated analyzer (TOA Medical Electronics Co., Kobe, Japan). UIBC (Roche, Mannheim, Germany) and serum iron (Roche) were assessed with colorimetric assays, and ferritin was assessed with an electrochemiluminescence immunoassay (Roche). sTfR was assessed using an immunoturbidimetric method (Roche).
3. Definition
We defined anemia as the state in which the hemoglobin concentration is 2 standard deviations (2SDs) lower than the mean hemoglobin concentration in the normal population of the same gender and age, exactly as defined by the WHO9). Based on this WHO report, anemia was defined as hemoglobin concentration less than 11.0 g/dL in children from 6 to 59 months of age, hemoglobin concentration less than 12.0 g/dL in 12- to 14-year-old adolescents, and hemoglobin concentration less than 13 g/dL in males more than 15 years old.
We defined iron deficiency as a state in which there is insufficient iron to maintain normal physiologic functions, and IDA as an anemia that results from iron deficiency10).
4. Statistical methods
All the analysis was performed by IBM SPSS Statistics ver. 21.0 (IBM Co., Armonk, NY, USA), and all of the values were expressed as mean±SD. Continuous variables of the 2 groups were compared using the T-test, and categorical variables were compared using the chi-square test. Linear regression analysis was used to assess the correlation between hematological parameters. The change of hemoglobin and sTfR after iron supplementation for 1 month was analyzed by paired T-test, and the correlation between these two changes was compared using the regression analysis. The correlation coefficient, called the r, was used in order to measure the strength and the direction of a linear relationship between two variables. A value of r greater than 0.8 was described as marked correlation; value from 0.6 to 0.8 was described as moderate correlation; value from 0.4 to 0.6 was described as mild correlation. If the P value was less than 0.05, it was considered statistically significant.
Results
1. Hematologic characteristics
The number of patients enrolled in the study was 98, and the first patient group included 78 children; 52 males and 26 females, and the second patient group included 20 children; 5 males and 15 females. Thus, the first one consists of more male than females while the second one had a significantly greater proportion of females.
Mean levels of hemoglobin, ferritin, serum iron concentration, and transferrin saturation were statistically higher in the first patient group than in the second patient group; but mean levels of TIBC and sTfR were lower in the first patient group than in the second patient group. There was no difference in the mean corpuscular volume (MCV) and mean red cell distribution width (RDW) between the 2 groups (Table 1).
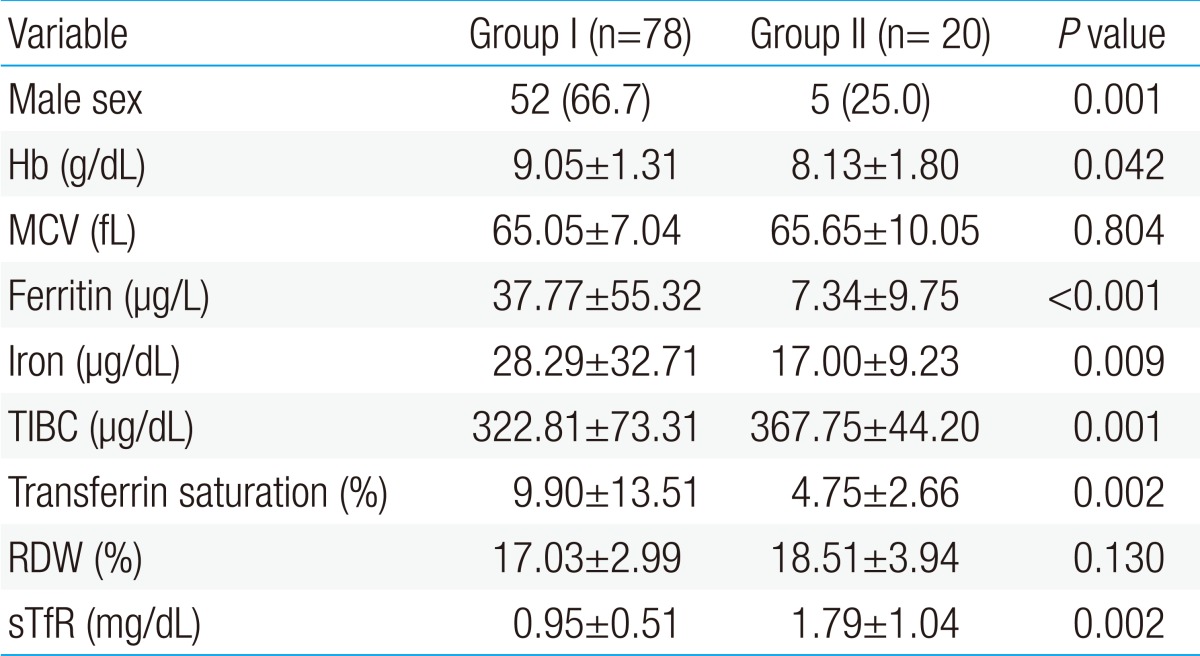
Comparison of clinical and hematological parameters in groups 1 and 2
2. The correlation between sTfR and other hematological parameters
The first patient group showed a significant negative correlation of sTfR with hemoglobin, MCV, ferritin, serum iron, and transferrin saturation, and it showed a significant positive correlation of sTfR with TIBC and RDW in the linear regression analysis, which was conducted to identify the correlation between sTfR and other hematological parameters (P<0.05). There was no significant correlation of sTfR with ferritin and TIBC in the second patient group; but sTfR showed a significant negative correlation with hemoglobin, MCV, serum iron, and transferrin saturation, and significant positive correlation with RDW (P<0.05) (Table 2).
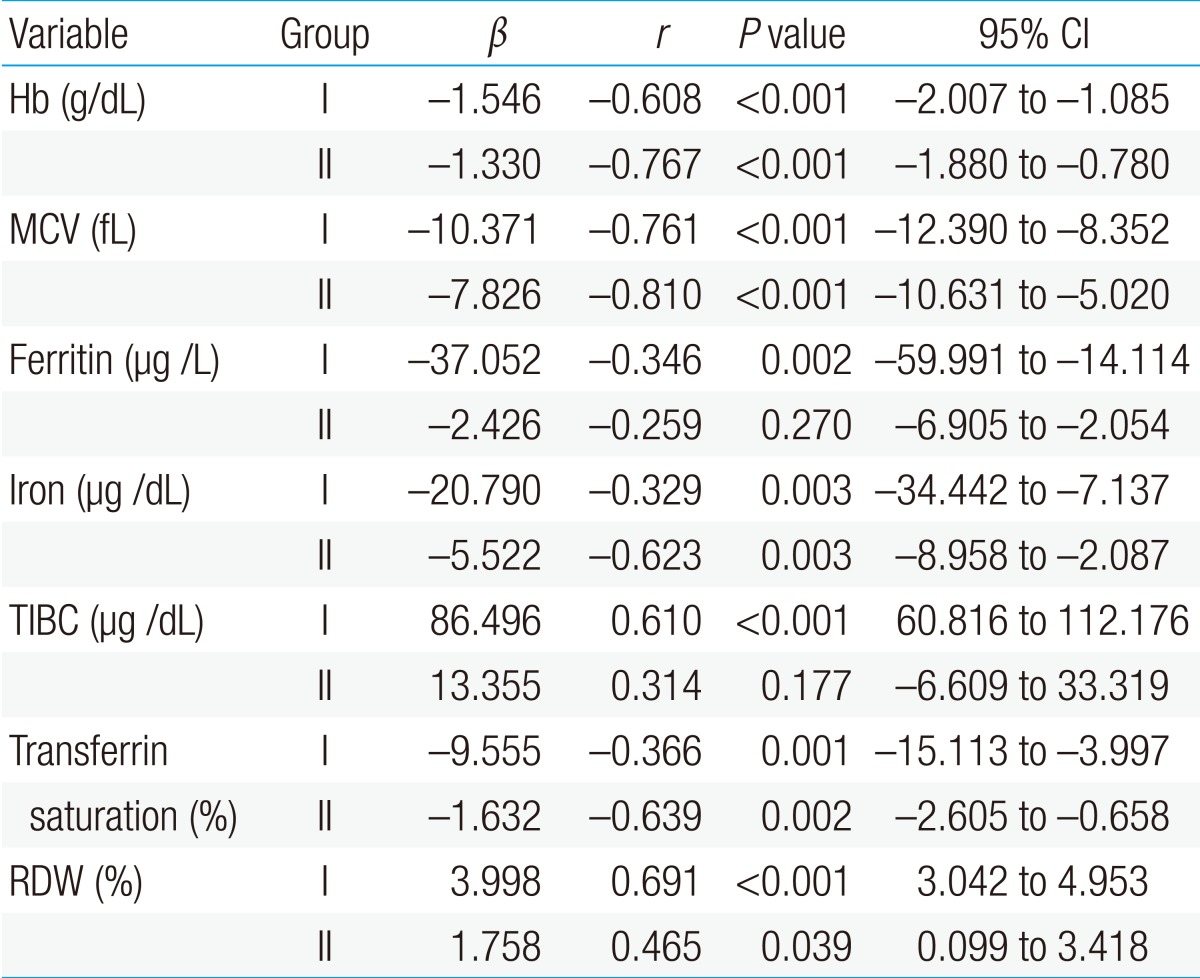
Simple linear regression of sTfR levels and other hematological parameters according to patient group
3. The correlation among hemoglobin, ferritin, and sTfR
In the linear regression analysis conducted to identify the correlation among hemoglobin, ferritin, and sTfR, there was no correlation between hemoglobin and ferritin in the first patient group (r=-0.006, P=0.957), but there was a positive and mild correlation between hemoglobin and ferritin in the second patient group (r=0.478, P=0.033) (Fig. 1). Hemoglobin and sTfR showed a significant negative and moderate correlation in both the groups (r=0.608, P<0.001, r=0.767, P<0.001) (Fig. 2).

Correlations between hemoglobin (Hb) and ferritin concentrations. Common regression lines are shown. (A) Serum ferritin and Hb (r=-0.006, P=0.957) in group 1; (B) serum ferritin and Hb (r=0.478, P=0.033) in group 2.
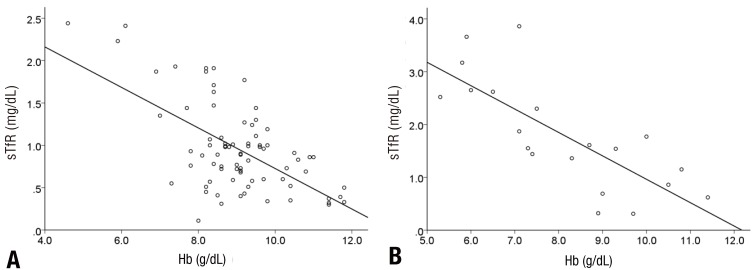
Correlations between hemoglobin (Hb) and soluble transferrin receptor (sTfR) levels. (A) sTfR and Hb (r=-0.608, P<0.001) in group 1; (B) sTfR and Hb (r=-0.767, P<0.001) in group 2.
4. Change in the sTfR level after iron supplementation
To identify the change in sTfR level after iron supplementation, the sTfR level was reassessed in 30 patients of the first patient group who were available for follow-up observation after iron supplementation treatment for 1 month. Hemoglobin level was increased from 8.21±1.64 to 10.39±1.60 g/dL after the treatment (P<0.001), and sTfR level was decreased from 1.45±0.94 to 1.03±0.80 mg/dL after the treatment (P<0.001). Also, these two changes showed a significant negative correlation (β=-0.237, r=-0.476, P=0.008) (Fig 3).
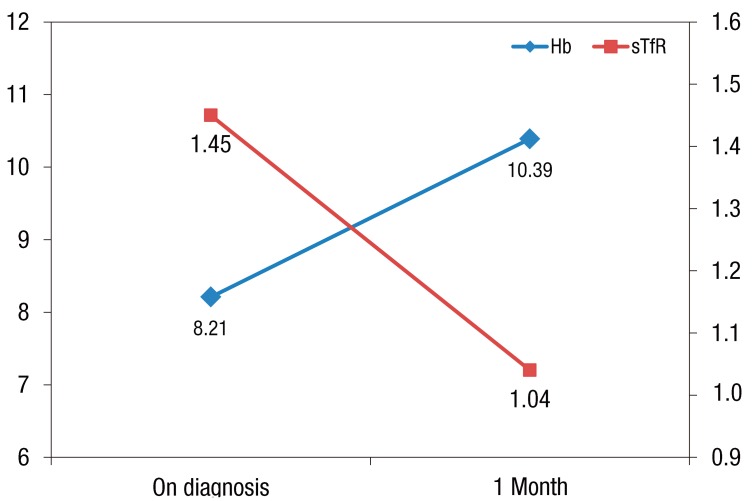
Changes in hemoglobin (Hb) and soluble transferrin receptor (sTfR) levels after iron supplementation for 1 month (β=-0.237, r=-0.476, P=0.008).
Discussion
For the effective diagnosis of IDA, various diagnostic methods has been investigated; such as sTfR concentration, reticulocyte hemoglobin content, and serum hepcidin11,12). Since first measured in 1986, sTfR concentration as diagnostic tool is one of the most active research parts being studied.
TfR is a transmembrane glycoprotein, and it forms a molecule of 190 kDa by disulfide bonding of the 2 same subunits13,14). Transferrin bound with iron in the plasma is combined with TfR, which is a specific receptor existing on the membrane of target cells, and carries iron into cells via the endocytosis mechanism. TfR exists on almost all of the cell surfaces except for that of mature erythrocytes, and it exists especially in large quantities in the erythron, placenta, and liver, and also 80% of the TfR exists in the erythroid marrow in normal adults. Its soluble form exists outside the cells by proteolysis of the membrane TfR. The concentration of serum sTfR is proportional to the amount of TfR in cells, and most of the sTfR is derived from the erythroblasts instead of the reticulocytes15,16).
sTfR responds to the erythropoietic activity in the bone marrow, and the sTfR level increases up to 8 to 20 times higher than the normal value. The assessment of sTfR is very useful for understanding the pathophysiology of anemia. Also, it is able to demonstrate whether the absolute rate of erythropoiesis and bone marrow proliferation are adequate or not. The sTfR level can be decreased in situations where the erythropoiesis activity has been compromised such as hypertransfusion, chronic renal failure, severe aplastic anemia, and chemotherapy. Whereas, it is increased if erythropoiesis is stimulated in conditions such as hemolytic anemia, hereditary spherocytosis, sickle cell anemia, megaloblastic anemia, or ineffective erythropoiesis15,17).
Iron level in the body is able to also affect the sTfR concentration, and it is possible to be increased slightly in iron deficiency (not in anemia) and dramatically in IDA15,18). The increase of the sTfR level was seen in functional iron deficiency, which causes lack of tissue iron, and the sTfR concentration showed a strong correlation with various erythrocyte indices of iron deficiency and it also showed an inverse correlation with serum ferritin8,19). In this study, the sTfR level was increased in both the groups of patients who were prone to IDA (preschool age group and adolescent group). In the preschool age group showed a negative correlation of sTfR with hemoglobin, MCV, ferritin, serum iron, and transferrin saturation and a positive correlation of sTfR with TIBC and RDW. The adolescent group showed a significant correlation of sTfR with other hematological parameters, but sTfR had no correlation with ferritin and TIBC. The reason for lack of correlation between sTfR and ferritin in adolescents is believed to be the absence of differences among patients, most of whom were diagnosed as having severe anemia and they already had a significant decrease in ferritin during the early stage of anemia. Then, there was a negative correlation between hemoglobin and sTfR in both groups; and hemoglobin level had nothing to do with ferritin level in the preschool age group, but in adolescents, it had definitely positive correlation with ferritin level. It suggests that sTfR better reflects the severity of IDA than ferritin in the 6- to 59-month-old children. The difference in these results may be caused by symptoms such as fever associated with inflammation and other underlying conditions of patients. So sTfR is more reliable figure than ferritin because it is less affected to inflammation.
sTfR can be used for monitoring the erythropoietic response to various treatments such as iron supplementation treatment20). Anttila et al.21) have published a decrease in the sTfR concentration in the adolescents who received iron supplementation for 50 days. In our study, the sTfR level was significantly decreased and it had an inverse correlation with an increase in the hemoglobin level in 30 IDA patients aged 6 to 59 months who were available for follow-up observation after iron supplementation for 1 month.
There were several limitations in this study. First, it was performed with a small number of cases and in a single medical center. Second, patients had other symptoms such as fever, and also, their underlying disease and the past medical history wasn't considered.
This study was conducted to identify the correlation between serum sTfR concentration and other diagnostic tests for IDA, and to assess the change in the sTfR level after iron supplementation. Therefore, we believe that the sTfR test can be useful for the diagnosis and treatment of IDA in children and adolescents.
Acknowledgment
This study was supported by Wonkwang University in 2012.
Notes
No potential conflict of interest relevant to this article was reported.