Change in the height of Korean children and adolescents: analysis from the Korea National Health and Nutrition Survey II and V
Article information
Abstract
Purpose
The mean adult height of Koreans has increased since nationwide anthropological measurements began in 1967. The objective of this study was to evaluate differences in heights of Korean late adolescents and young adults within and between the Second and Fifth Korea National Health and Nutrition Examination Surveys (KNHANES II and V).
Methods
Koreans aged ≤22 years with available measurements of height were enrolled from the KNHANES surveys (KNHANES II: n=3,372 [1,732 males and 1,640 females]; KNHANES V: n=6,190 [3,198 males and 2,992 females]). Differences in the height of KNHANES respondents within and between surveys were evaluated according to age and sex.
Results
In KNHANES II, there was no significant difference in height between males aged 17-19 years and those aged 20-22 years (174.3±0.5 cm vs. 174.3±0.6 cm, P=0.995). Females aged 20-22 years were taller than those aged 17-19 years (159.8±0.4 cm vs. 161.0±0.4 cm, P=0.017). Females aged 17-19 years were significantly taller in KNHANES V than in KNHANES II (161.2±0.3 cm vs. 159.8±0.4 cm, P=0.004). Respondents aged 20-22 years were taller in KNHANES V than in KNHANES II, although not significantly so; the difference was 0.3±0.8 cm in males (P=0.721) and 0.5±0.6 cm in females (P=0.386).
Conclusion
Koreans appear to continue growing even in their late adolescence and early twenties. Consequently, it may be necessary to expand the reference age ranges of the Korean growth chart. Additionally, a longitudinal growth survey is needed to determine growth patterns and secular trend in height among Koreans.
Introduction
Physical growth is a dynamic process1). Children and adolescents continue to grow until adulthood, after which height appears to decrease with age234). Analysis of anthropometric data is essential to determine the growth and development of children and adolescents1). Physical growth is considered a valuable marker of children's health56). Growth and final height are affected by genetic, nutritional, and psychosocial factors.
Growth charts are often used for the assessment of physical growth. The Centers for Disease Control and Prevention (CDC) established a growth chart in 20007). Furthermore, the World Health Organization (WHO) recently released new growth standards in 20068). Korean national growth charts have been developed by the Korean Pediatric Society and the Ministry of Health and Welfare approximately every 10 years since 19679). The most recent version was released in 2007 using the data from the national survey of children and adolescents in 200510). In 2007, the references for auxological measurements were included in the Korean national growth charts for the age of 18.5 years, where 18.5 years was considered as the age at which final adult height was attained. However, in other growth charts, the references for height were listed at the age of 20 years, indicating the acquisition of height with increasing age78).
Secular trends for height have been described in many studies. An upward trend has been observed in most European countries since the mid-19th century6). The adult height has also increased in Korea and Japan11). However, the increase in the adult height of the United States population over time is slightly regressive12).
The objective of this study was to evaluate the secular change of the final adult height of the Korean population by using the data from the Second and Fifth Korea National Health and Nutrition Examination Survey (KNHANES II and V).
Materials and methods
1. Subjects
This study was performed using data from the KNHANES II and V. The KNHANES is a nationwide population-based cross-sectional survey with a multistage and stratified sampling design conducted by the Korean Centers for Disease Control and Prevention13). The KNHANES II and V were carried out in 2001 and 2010-2012, respectively. In KNHANES II and V, participants aged ≤22 years with available measurements of height were included. In KNHANES II and V, 3,372 subjects (1,732 males and 1,640 females) and 6,190 (3,198 males and 2,992 females) were enrolled, respectively. Height was measured to the nearest 0.1 cm with a mobile stadiometer (Seca 220, Seca, Hamburg, Germany) by well-trained staff, according to a standardized protocol.
2. Statistical analysis
Statistical analyses were performed with Stata 12.1 (StataCorp LP, College Station, TX, USA). Data were analyzed using Stata survey tools appropriate for the KNHANES sampling design. Results are expressed as the weighted mean±standard error. A Student t-test was used to compare the weighted mean height between subjects in the KNHANES II and V. Graphs for height were constructed using a kernel-weighted local polynomial regression with smoothing. A P value of <0.05 was considered significant.
Results
1. Height of subjects in KNHANES II and V
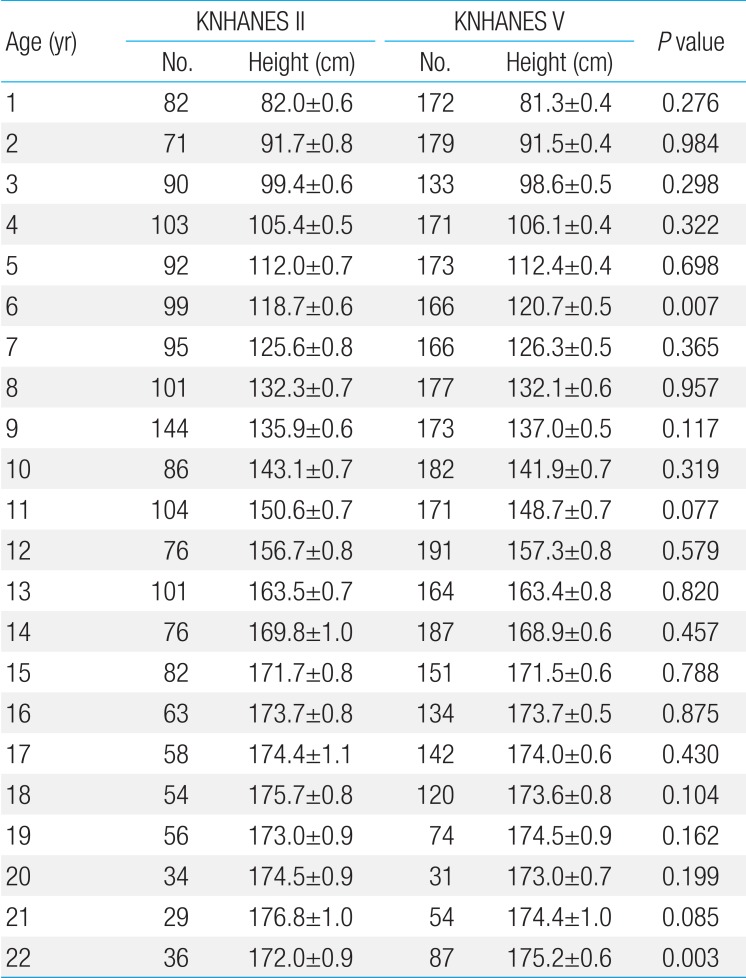
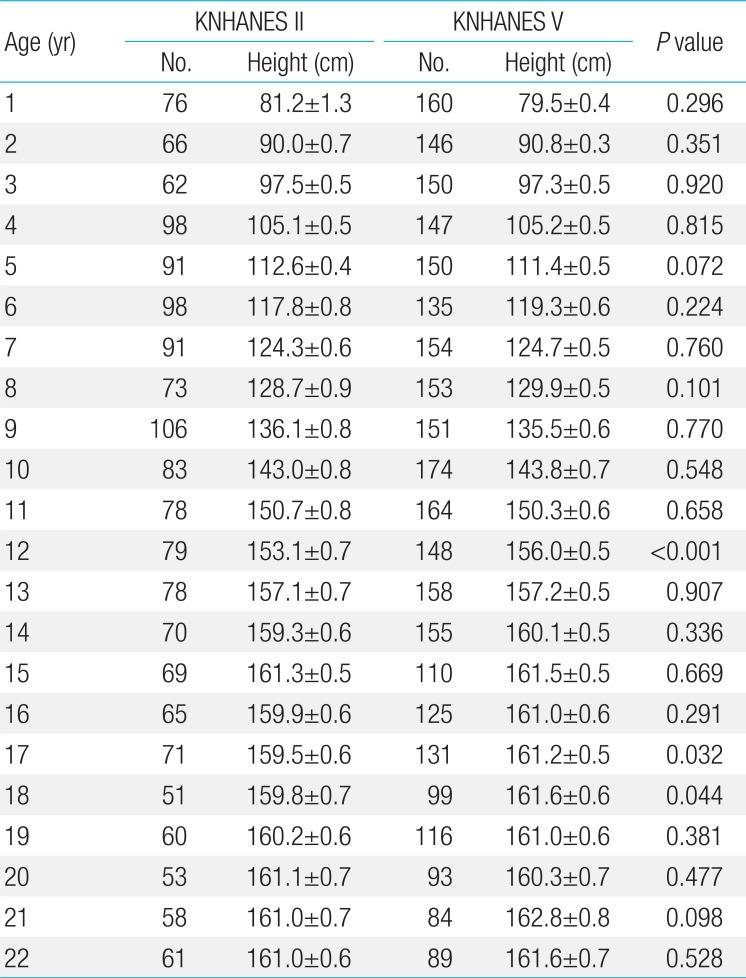
The height of subjects according to sex and age is listed in Tables 1 and 2. No significant changes in height were observed after 16 years of age in males and 15 years of age in females. There were no significant differences in the height of males aged 17-19 years in KNHANES II and V (P=0.105 and P=0.727, respectively). There was no difference in the height of females aged 17-19 years in KNHANES II and V (P=0.388 and P=0.803, respectively).

Height of males in KNHANES II & V

Height of females in KNHANES II & V
The height of males aged 17-19 and 20-22 years was 174.3±0.5 cm and 174.3±0.6 cm in KNHANES II, respectively (P=0.995) (Table 3). The height of females aged 20-22 years was significantly taller than those aged 17-19 years in KNHANES II, respectively (159.8±0.4 cm vs. 161.0±0.4 cm, P=0.017). However, the height of males aged 17-19 and 20-22 years was not significantly different in KNHANES V (174.0±0.5 cm vs. 174.6±0.5 cm, P=0.331). The height of females aged 17-19 and 20-22 years was 161.2±0.3 cm and 161.5±0.4 cm in KNHANES V, respectively (P=0.568).

Comparison of height according to sex and age within each KNHANES
2. Comparison of height between KNHANES II and V
In males aged ≤22 years, there was no significant difference in the height between the KNHANES II and V, except in males aged 6 and 22 years (Table 1). The height of 6-year-old boys was higher in subjects of the KNHANES V (118.7±0.6 cm vs. 120.7±0.5 cm, P=0.007). The height of 22-year-old boys was higher in subjects of the KNHANES V (172.0±0.9 cm vs. 175.2±0.6 cm, P=0.003) (Fig. 1).
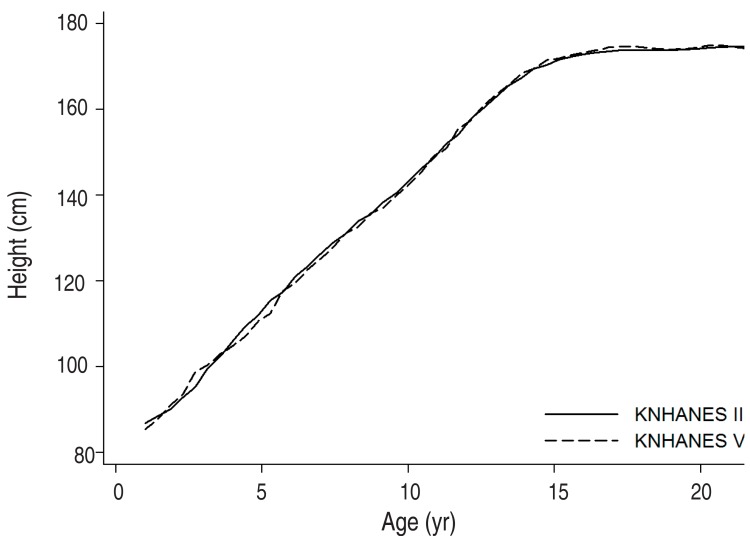
Growth curve of males aged 1-22 years. KNHANES, Korea National Health and Nutrition Survey.
The height of girls aged <12 years showed no difference between KNHANES II and V. The height of females aged ≥12 years tended to be higher in KNHANES V, with significant differences at the age of 12, 17, and 18 years (153.1±0.7 cm vs. 156.0±0.5 cm, P<0.001; 159.5±0.6 cm vs. 161.2±0.5 cm, P=0.032; and 159.8±0.7 cm vs. 161.6±0.6 cm, P=0.044, respectively) (Table 2) (Fig. 2).

Growth curve of females aged 1-22 years. KNHANES, Korea National Health and Nutrition Survey.
The height of males aged 20-22 years was taller than those aged 17-19 years with no significant difference between KNHANES II and V (Table 4). However, the height of females aged 20-22 years was higher in KNHANES V (P=0.004). In females aged 20-22 years, the height measurements were higher in KNHANES V, which was not statistically significant (P=0.368).

Comparison of height according to sex and age between KNHANES II and V
Discussion
Height is considered the best single index for the assessment of human growth and development1). For the assessment of physical growth, many growth charts have been used. The CDC updated the growth chart in 20007). The WHO developed new growth standards in 20068). Only 25 countries use their local charts for monitoring growth14). In Korea, the most recent version of the national growth chart was developed by the Korean Pediatric Society and the Ministry of Health and Welfare in 200710). In the 2007 Korean National Growth Charts, the references for anthropometric measurements were included for 18.5 years of age. Therefore, the final adult height was regarded as the height attained at 18.5 years of age. However, in other growth charts, height reference was listed by the age of 20 years, which indicating the acquisition of height with increasing age78).
In Korea, the first nationwide measurement of anthropometry in children was performed in 1967. The growth chart was revised in 1975, 1985, 1998, and 2007. The most recent version of the national growth chart was released in 2007; it was developed using the data from the national survey of children and adolescents in 2005. The mean final adult height of Korean males was 168.9 cm in 1967 and 173.3 cm in 2007, according to the Korean growth chart. Thus, a growth of approximately 4.4 cm was observed over a 40-year period. In females, this growth in final adult height was 5.4 cm, from 155.9 cm in 1967 to 161.3 cm in 2007. In the two most recently released growth charts in 1998 and 2007, an increase of 0.9 cm in males and 0.4 cm in females in the final height was noted.
Similar trends in change have been reported in several studies. In the Netherlands, the mean height of military draftees increased from 165 cm in 1860 to 181 cm in 199015). In Germany, the mean height of military draftees increased from 174.0 to 179.8 cm between 1957 and 199316). However, this trend in increased height seems to have reduced in the last few decades, especially in northern Europe1718). A Japanese study showed an increase of height in increments of 1.0-2.0 cm per decade in young males and 1.1-1.9 cm per decade in young females between 1900 and 2000. The overall difference in the mean height at the age of 17 was 12.9 cm in males and 11.1 cm in females over this 100-year period. After 1980, the rate of change in height seemed to decrease11). In China, the mean height of boys and girls during 1950-1985 increased by 1.12-2.66 cm and 1.42-2.67 cm per decade, respectively19). Between 1985 and 2010, the increase in adult height per decade was 1.0 cm in males and 0.7 cm in females20).
In our study, subjects aged 17-19 and 20-22 years in KNHANES II and V showed no significant difference in height in males. Males aged 20-22 years were observed to be taller than those aged 17-19 years without significant difference (0.7±0.7 cm, P=0.331). In KNHANES II, females aged 20-22 years were significantly taller than those aged 17-19 years, with a height difference of 1.2±0.5 cm (P=0.017). These findings may suggest that males and females grow in height even through the late adolescence period. This may further indicates that height measurements in the early twenties are more indicative of the final adult height than measurements made in late adolescence. Therefore, the next version of the Korean growth chart might contain the height reference measurements with an expanded age range. However, a longitudinal study is required to confirm these growth patterns because this study was based on cross-sectional data.
This study analyzed the difference in growth patterns of children and adolescents over 10 years, as the interval between the KNHANES II and V was 10 years. The height in subjects aged 20-22 years seemed to be higher in KNHANES V, with a difference of 0.3±0.8 cm in males and 0.5±0.6 cm in females. The height difference in this study was lower in males and higher in females, compared to the findings using the reference measurements of the 1998 and 2007 growth charts, demonstrating a positive height change of 0.9 cm in males and 0.4 cm in females. The difference between the height change in the growth charts and that obtained in this study may be because of the difference in the study population and the age at height measurement. Even though there was no significant difference in the final height of males and females over the past 10 years, there seemed to be a general increase in the height. Even though the developmental tempo showed recent increases, the growth chart and curve did not show a shift to the left in males. However, the growth curve of females seemed to shift to the left in the KNHANES V.
A limitation of this study includes the fact that it was based on the KNHANES, a cross-sectional survey. Accordingly, it is difficult to ascertain any longitudinal changes in height according to the birth cohort. Furthermore, deviation in the mean height may have occurred, especially in the younger subjects, because ages were described only in years, not in months. Moreover, the accuracy of height measurements can be affected by the time of height measurement, height-measuring staffs, and the stages of KNHANES. Although KNHANES data is a national representation and the weight was applied during statistical analysis in this study, the number of subjects was relatively small, which might be the cause of the mean height variation.
In conclusion, the height of Korean children and adolescents seemed to increase even in their late adolescence and early twenties. Therefore, it seemed to be necessary to increase the age range of the reference heights in the Korean growth chart at the time of the next revision. Moreover, a longitudinal growth survey in Korean youth is essential to delineate growth patterns and secular changes in height.
Notes
Conflicts of interest: No potential conflict of interest relevant to this article was reported.