Reference values of lead in blood and related factors among Korean adolescents: the Korean National Health and Nutrition Examination Survey 2010-2013
Article information
Abstract
Purpose
This study aimed to assess the reference values and factors influencing blood lead levels among Korean adolescents.
Methods
The study population consisted of 1,585 adolescents (801 males, 784 females; aged 10-19 years) who participated in the Korea National Health and Nutrition Examination Survey 2010-2013. We analyzed blood lead concentrations in relation to demographic/lifestyle characteristics for all participants. "Reference values" of blood lead levels were calculated as the upper limit of the 95% confidence interval of the 95th percentile.
Results
The average "reference value" for blood lead concentrations among Korean adolescents was 2.25 µg/dL (2.49 µg/dL for males, 2.07 µg/dL for females), and the geometric mean of the blood lead concentrations was 1.34 µg/dL. Males had higher blood lead concentrations than females (male, 1.48 µg/dL; female, 1.19 µg/dL; P<0.001). Elementary school students had higher blood lead concentrations than junior and senior high school students (1.44 µg/dL vs. 1.31 µg/dL, P<0.001). Participants living in detached houses had higher blood lead concentrations than those living in apartments (P<0.001) and current smokers had higher concentrations than nonsmokers or participants with secondhand smoke exposure (P<0.05). Additionally, participants with excessive alcohol consumption had higher levels than non-drinkers (P<0.001).
Conclusion
This study provides national reference data on blood lead concentrations stratified by demographic and lifestyle factors among Korean adolescents. Further studies are needed to elucidate the relationship between increased lead exposure and demographic factors including type of housing.
Introduction
Lead is a widespread, nondegradable pollutant, which is ubiquitous in the environment. Human beings are exposed to lead from food, water, dust soil, paints, and leaded gasoline1). Lead exposure has been shown to have a number of negative impacts on human health. Particularly, it has a number of negative impacts on children and adolescents, including cognitive and motor deficit, growth impairment, anemia, autism, and attention deficit hyperactivity disorder2).
There have been many studies on the national estimates and negative impacts of heavy metal exposure in Korean adults34). Due to the preventive policies including elimination of lead from gasoline and paint since 1990s, the mean blood lead levels (BLLs) of the Korean adults decreased from 9.46 µg/dL in 1993 to 2.61 µg/dL in 2005 35). However, there have been no nationally representative data on BLLs in Korean children and adolescents. Only a few studies, with small sample sizes, demonstrated negative associations between blood lead concentrations and body iron status, growth of height, or neurocognitive function in children and adolescents567). Large-scale studies with recent data are scarce.
Children and adolescents are more vulnerable to the toxic effects of heavy metals compared to adults, because of their behavioral features, high absorption rate of lead from the gastrointestinal tract and immature hepatic detoxification systems8). Since 1991, "level of concern" for children's blood was over 10 µg/dL2). However, a number of studies have demonstrated adverse health effects of lead exposure in children at lower BLLs below even 5 µg/dL, and virtually no safe BLL in children has been identified678). Therefore, national reference data is essential in the surveillance and diagnosis of environmental overexposure, identifying high-risk groups and setting strategies for reducing lead exposure, particularly in children and adolescents. Some countries including United States (US) and Germany have established reference values including geometric means and upper limit of lead exposure for this purpose. Recently, data on blood concentrations of heavy metals, including lead, among Korean adolescents (≥10 years old) have been included in the Korean National Health and Nutrition Examination Survey (KNHANES) from 2010 to 2013. In the present study, we investigated the blood lead concentrations stratified by socio-demographic and lifestyle factors in Korean adolescents using data from KNHANES.
Materials and methods
1. Study participants
The data for the present study were obtained from the KNHANES, 2010-2013. A total of 4,167 individuals, aged less than 20 years, participated in the 2010-2013 survey. We excluded individuals who did not have adequate blood samples for measurement of lead level. After exclusions made, the sample for the cross-sectional analysis comprised a total of 1,585 children and adolescents aged 10-19 years (801 males, 784 females). Written informed consent was obtained from all participants or from their parents. This study was exempt from institutional review board approval, as the study used publicly available deidentified datasets.
2. Data collection and study variables
Demographic variables include age, gender, and region. Age was categorized as elementary school (10-12 years), junior high school (13-15 years) and senior high school (16-19 years). Regions were grouped as rural (administrative divisions of counties or small cities of less than 500,000 population) and urban (administrative divisions of counties or cities of more than 500,000 population) areas. Household income was calculated based on equivalized income (total household income divided by the square root of the numbers of household members), and grouped into 4 quartiles. Type of housing was categorized into 5 groups; apartment, detached house, row house, multifamily house, and commercial building.
Smoking status was grouped as nonsmoker (participants who never tried smoking in the previous 30 days), secondhand smoke exposure, and current smoker (participants who smoked cigarettes on at least 1 day in the previous 30 days). Alcohol consumption was indicated as 'yes' when the participant consumed at least one glass of alcohol every month over the previous year. Excessive alcohol consumption was defined as consuming 7 drinks or more (for males) or 5 drinks or more (for females) on a single occasion and consuming more than 2 times per week.
3. Determination of lead concentration in whole blood
BLLs were measured using overnight fasting blood samples by graphite furnace atomic absorption spectrometry (AAnalyst 600, PerkinElmer, Finland) with Zeeman background correction (SpectrAA-800, Varian Instruments, Australia). The interassay coefficients of variation were 8.5% at 4.7, 36.8, and 68.7 µg/dL. The detection limits for blood lead were 0.23 µg/dL, and there were no participants whose blood levels were below the detection limit. The reference values of BLLs were calculated as the upper limit of the 95% confidence interval (CI) of the 95th percentile, according to the International Union of Pure and Applied Chemistry guideline9).
4. Statistical analysis
Statistical analysis was performed using IBM SPSS ver. 18.0 (IBM Co., Armonk, NY, USA). Sampling weights were used in all analysis to take the complex sampling into account. Demographic and biochemical data are presented as either means± standard error or proportions, while heavy metal concentrations are presented as geometric means±95% CI. The distributions were skewed; therefore, the BLLs were log-transformed to calculate the geometric means. Selected percentiles were calculated by demographic and lifestyle factors. Adjusted geometric means and 95% CI were calculated using analysis of covariance to compare the BLLs by different demographic and lifestyle groups after adjustment for the covariates. For all analyses, P values were two-tailed and P<0.05 was considered statistically significant.
Results
1. General characteristics and blood lead concentrations of the study population
General characteristics of study population are presented in Table 1. The mean age of the study population was 14.9 years. No significant differences were found between genders in age, region, type of housing, household income, and alcohol consumption. The proportions of participants who are current smokers (4.5% vs. 1.4%) and participants drinking excessive alcohol (8.3% vs. 2.7%) were significantly higher in males than in females (P<0.001).

General characteristics of the participants
Table 2 demonstrates the geometric means presented with selected percentiles and their 95% CI values of blood lead concentration by gender and age. Overall, the geometric mean of BLLs was 1.34 µg/dL (1.48 µg/dL in males, 1.19 µg/dL in females, P<0.001). The reference value of BLLs calculated as the upper limit of the 95% CI of the 95th percentile value was 2.25 µg/dL (2.49 µg/dL in males, 2.07 µg/dL in females). The geometric mean of BLLs in participants aged 10-12 years (1.44 µg/dL) was 9% higher than participants aged 13-19 years (1.31 µg/dL). The reference values of BLLs gradually decreased with age: from 2.52 µg/dL at age 10-12 years to 2.21 µg/dL at age 16-19 years.

Geometric mean and selected percentiles of blood lead concentrations (µg/dL)
2. Comparisons of blood lead concentrations by demographic and lifestyle factors
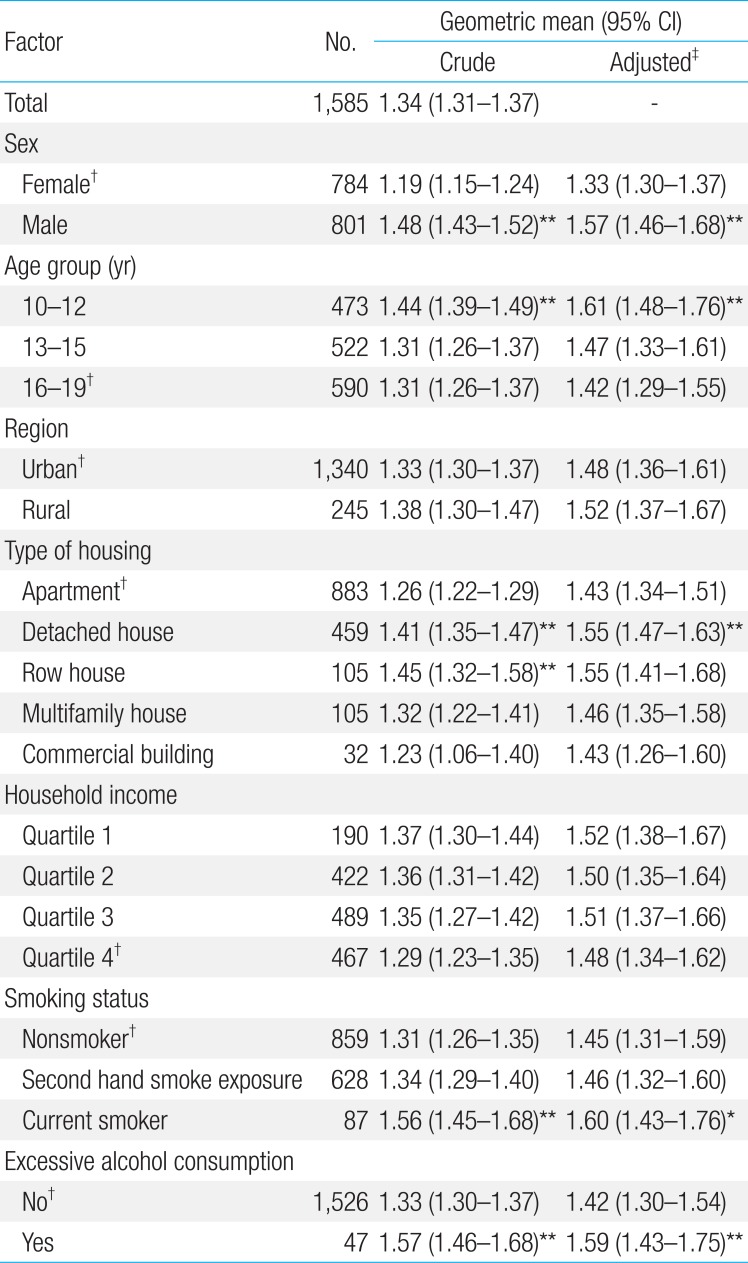
The crude and adjusted geometric means of blood lead concentrations by demographic and lifestyle factors are presented in Table 3. The crude and adjusted geometric means of BLLs were significantly higher in males than in females (P<0.001), and they were significantly higher in participants aged 10-12 years than in participants aged 16-19 years. Participants who lived in detached houses or row houses, who were current smokers, and who drank excessive alcohol had significantly higher blood lead concentrations (P<0.01). Significant differences were not found by region nor household income.

Crude and adjusted geometric mean of blood lead concentrations (µg/dL) by participant characteristics
Discussion
We report the geometric mean (1.34 µg/dL) and reference values (2.25 µg/dL) of BLLs in Korean adolescents, and the suggested demographic and lifestyle factors associated with higher BLLs including: male gender, elementary school age, living in detached houses, smoking and excessive alcohol consumption. The main strength of this study is that it is the most recent and largest scaled study on the reference values of blood lead and the associated factors in Korean adolescents.
We found that the geometric mean BLLs in Korean adolescents was comparable to those of German adolescents (1.57 µg/dL)10), and Belgian adolescents (1.48 µg/dL)11). However, the geometric mean BLLs in Korean adolescents was higher than the reported values of 0.68 µg/dL in US adolescents12), 0.8 µg/dL in Canadian adolescents13) and 0.96 µg/dL in Japanese children14), and lower than 5.7 µg/dL in Chinese adolescents. In Korea, the BLLs have been markedly decreased since 1993 when leaded gasoline had been banned. The mean blood lead value in Korean children, which was as high as 27.8 µg/dL in the early 1990s15), dramatically decreased to 3.05-3.46 µg/dL in 200716), and now it is as low as 1.34 µg/dL. However, recent epidemiological studies demonstrate that there is no safety margin for lead exposure in children; rather a continuum of toxicity17). Therefore, long-term public health plans should be continued to reduce lead exposure in Korean adolescents by the government.
Consistent with other studies18), males had higher blood lead concentrations than females in this study. More frequent outdoor activities in males than females would explain this difference. Also, higher rates of smoking and excessive alcohol use, which are well-described risk factors, may also contribute to the increased lead exposure in males. Male adolescents may need more supervision and health education to prevent lead exposure.
Regarding impact of age in BLLs, a few studies have demonstrated an increasing trend of BLLs from newborn babies to children, which peaks at the age of 3-6 years. This trend then gradually decreases by age, probably due to decreased hand-to-mouth behaviors1920). Among adults aged ≥20 years, blood levels seems to be increased by age, probably due to mobilization of accumulated lead from bone into blood13). However, studies on blood lead concentrations by age among adolescents are scarce. In this study, we demonstrated that elementary school students had significantly higher BLLs than junior and senior high school students. Anecdotally, the students in higher grades tend to spend much more time indoors to study and are more likely to pay attention to personal hygiene. Also, the absorption rate from the gastrointestinal tract, which is higher at a younger age, might be relatively lower among students in higher grades. All of these factors may affect the decreasing trend of BLLs.
In this study, we found that adolescents living in detached houses had higher BLLs than those living in apartments. There is only one previous study that has shown living in detached houses is associated with higher lead exposure than living in apartments21). It is possible that detached houses tend to be older buildings, which might have been painted with lead paints or have deteriorated paints on the outer walls compared with apartments. Also, apartments may have scheduled maintenance programs to reduce possible exposure to heavy metals. Therefore, regular surveillance of lead exposure should be emphasized for indoor dust or water pipes, particularly in detached houses.
Previous studies have shown that lower household income was associated with higher BLLs in adults and children11), and it is possibly explained by older dwellings and a greater absorption rate due to calcium or iron deficiency among low-income families. In this study, participants with lower household income had higher BLLs than participants with higher household income; however, there was no statistical significance. Furthermore, one recent study among Korean adults also failed to show a significant difference in lead exposure according to the household income. We can assume that this difference in lead exposure by household income is relatively weak compared with other variables such as smoking or housing type in the Korean general population in comparison to US Americans or Canadians1322).
In this study, higher BLLs were found to be associated with current smoking and excessive alcohol consumption. The positive associations between smoking and higher lead exposure have been demonstrated in many studies1323), and this is explained by the lead content in cigarettes and its release into the smoke. Also, frequency and amount of alcohol consumption have been reported to be correlated with lead exposure, as there is lead content in various alcohol products23) and in containers of alcohol made by lead crystals24). Since adolescence is an important period during which lifestyle habits are formed, antismoking and antialcohol advertisements for teenagers would be necessary in order to reduce lead exposure during adolescence and in later life.
There were some limitations to our study. Firstly, the study was cross-sectional, and therefore, causality cannot be inferred. Secondly, the construction year of housing was not investigated in KNHANES, so we could not assess the effect of housing type independently from the construction year. Nevertheless, to our knowledge, the present study is the largest scaled study that has demonstrated the reference values of blood lead and the associated factors in Korean adolescents using the most recent nationwide data. This reference data including upper limit of BLLs in Korean adolescents may play a role in the surveillance and diagnosis of environmental overexposure, and can be used in further studies on negative health impacts of lead exposure. Also it offers public health and healthcare providers information that can be used in lead hazard reduction strategy.
In conclusion, we found that BLLs of Korean adolescents are comparable to those of German and Belgian children, while they are greater than in US, Canadian, and Japanese children. This study also provides national reference data on blood lead concentrations stratified by demographic and lifestyle factors among Korean adolescents. We suggest that policies, surveys, and strategies to reduce lead exposure in children and adolescents should be focused on both lifestyle habits and dwelling environment.
Acknowledgments
We thank the Korea Centers for Disease Control and Prevention for providing the data.
Notes
Conflicts of interest: No potential conflict of interest relevant to this article was reported.