The influence of gonadotropin-releasing hormone agonists on anthropometric change in girls with central precocious puberty
Article information
Abstract
Purpose
The potential effect of gonadotropin-releasing hormone agonist (GnRHa) treatment on the weight of girls with central precocious puberty (CPP) remains a controversy. We investigated anthropometric changes during and after GnRHa treatment among girls with CPP.
Methods
This retrospective study evaluated data from 127 girls with CPP who received GnRHa treatment for ≥2 years. Height, weight, and body mass index (BMI) values were compared at the baseline (visit 1), after 1 year of GnRHa treatment (visit 2), the end of GnRHa treatment (visit 3), and 6–12 months after GnRHa discontinuation (visit 4).
Results
The height z score for chronological age (CA) increased continuously between visit 1 and visit 4. No significant differences were observed in BMI z score for CA between visits 1 and 4. However, an increasing trend in the BMI z score for bone age (BA) was observed between visits 1 and 4. The numbers of participants who were of normal weight, overweight, and obese were 97, 22, and 8, respectively, at visit 1, compared to 100, 16, and 11, respectively, at visit 4 (P=0.48).
Conclusion
Among girls with CPP, the overall BMI z score for CA did not change significantly during or after GnRHa treatment discontinuation, regardless of their BMI status at visit 1. However, the BMI z score for BA showed an increasing trend during GnRHa treatment and a decreasing trend after discontinuation. Therefore, long-term follow-up of BMI changes among girls with CPP is required until they attain adult height.
Introduction
Central precocious puberty (CPP) in girls is defined as the onset of secondary sexual development before the age of 8 years, and is caused by premature activation of the hypothalamic-pituitary-gonadal axis1). Gonadotropin-releasing hormone agonists (GnRHa) are the treatment of choice for CPP, where they desensitize the pituitary response to GnRH by down-regulating GnRH receptors and suppressing premature bone maturation and pubertal development2). GnRHa treatment for CPP consistently provides regression or stabilization of pubertal symptoms1), and can help delay menarche and increase the final adult height3).
Children with CPP have a higher prevalence of obesity, compared to the general population45), and there are concerns regarding the potential effect of GnRHa treatment on body weight. Furthermore, the relationship between GnRHa treatment and obesity has been studied for many years and the reported associations remain controversial. For example, some studies have detected associations between GnRHa treatment and increased body mass index (BMI)467891011), although other studies have reported no association between GnRHa treatment and weight status121314151617) or even associations with decreased BMI during GnRHa treatment181920). Moreover, other studies have detected differential effects of GnRHa treatment according to BMI category, with increasing BMI among girls with CPP and normal weight, compared to no change in BMI among overweight girls with CPP172122). Nevertheless, it is crucial to understand the effects of GnRHa treatment on obesity among children with CPP, as the prevalence of childhood obesity is gradually increasing and has a problematic relationship with adult obesity and its complications. In Korea, several reports have described BMI changes during GnRHa treatment for girls with CPP, although those studies evaluated relatively small samples and used a limited duration of GnRHa treatment14212324252627). Therefore, this retrospective study aimed to evaluate the effect of GnRHa treatment on BMI among Korean girls with CPP according to weight status at their diagnosis. The girls had been followed for 6–12 months after discontinuing the GnRHa treatment, and were compared based on their BMI values for chronological age (CA) and bone age (BA).
Materials and methods
1. Patients
This retrospective study evaluated 145 girls with CPP who received GnRHa treatment for ≥2 years at the Inje University Ilsan Paik Hospital between January 2010 and June 2016. The GnRHa was administered subcutaneously or intramuscularly at doses of 60–90 µg/kg every 4 weeks. The patients were advised to exercise regularly for ≥30 min/day and to eat healthy food. The GnRHa treatment was discontinued at CAs of approximately 11–12 years and BA of approximately 12–12.5 years. The inclusion criteria were: (1) breast development before the age of 8 years, (2) BA that was advanced relative to CA, (3) a peak luteinizing hormone concentration of ≥5 IU/L during the GnRH stimulation test, (4) GnRHa treatment for ≥2 years starting between the ages of 7.0 and 8.9 years, and (5) a follow-up of ≥6 months after discontinuation of the GnRHa treatment. The exclusion criteria were: (1) CPP caused by an organic brain lesion (n=0), (2) concomitant recombinant human growth hormone treatment before, during, or after the GnRHa treatment (n=17), and (3) thyroid disorders that could affect obesity (n=1). Thus, data from 127 girls were included in the study. The study's retrospective protocol was approved by the Institutional Review Board of Inje University Ilsan Paik Hospital (ISPAIK 2016-07-010), and the requirement for informed consent was waived. All procedures and treatments complied with the tenets of the Declaration of Helsinki.
2. Data collection
The patients' medical records were retrospectively evaluated to obtain anthropometric and radiological data (i.e., height, weight, abdominal circumference, CA, and BA) that had been collected at 4 visits: on the first day of the GnRHa treatment (visit 1), 1 year after starting the GnRHa treatment (visit 2), on the last day of the GnRHa treatment (visit 3), and 6–12 months after discontinuing the GnRHa treatment (visit 4). Height was measured to the nearest 0.1 cm using the Harpenden Stadiometer (Holtain Ltd., Crosswell, UK) and weight was measured to the nearest 0.1 kg using an electronic balance (150A; CAS Co. Ltd., Seoul, Korea). BMI was calculated as kg/m2. Abdominal circumference was measured at the midpoint between the upper margin of the iliac crest and the lowest rib. Waist-to-height ratio (WHtR) was calculated as abdominal circumference divided by height. The height, weight, and BMI z scores for CA and BA were calculated using the Korean growth chart28). Weight status was classified according to BMI at visit 1 (normal weight vs. overweight/obese), with normal weight corresponding to a BMI of <85th percentiles for age and sex, overweight corresponding to the 85th–94th percentiles, and obesity corresponding to the ≥95th percentile29). BA was measured using the Greulich-Pyle method by a single pediatric endocrinologist (JHK)30).
3. Statistical analysis
All statistical analyses were performed using Stata ver. 14.2 (StataCorp LP, College Station, TX, USA). Data were presented as mean±standard deviation or number (percentage). Continuous variables were compared between groups using Student t test and categorical variables were analyzed using the chi-square test. Continuous variables were compared between visits using the paired t test. Multiple logistic regression analysis was performed to identify the factors that were associated with changes in the z scores between visits 1 and 4. Differences and associations were considered statistically significant at P values of <0.05.
Results
1. Baseline clinical characteristics
The normal weight group at visit 1 included 97 patients (76.4%). At visit 1, no significant differences were observed between the normal weight and overweight/obese groups in terms of CA (P=0.876), BA (P=0.448), and the difference between BA and CA (P=0.48) (Table 1). In addition, there were no significant differences between the groups' height z scores for CA (zHTCA) and BA (zHTBA). However, the overweight/obese group had significantly higher values for the weight z score for CA (zWTCA), weight z score for BA (zWTBA), BMI z score for CA (zBMICA), and BMI z score for BA (zBMIBA) (all P<0.001). There were no significant differences between the groups in their basal and peak hormone values during the GnRH stimulation test. The durations of GnRHa treatment and follow-up were 2.8±0.5 years and 0.73±0.27 years, respectively, and there were no significant intergroup differences in these values.

Baseline clinical characteristics of study participants at V1
2. Changes in BMI between visits 1 and 4
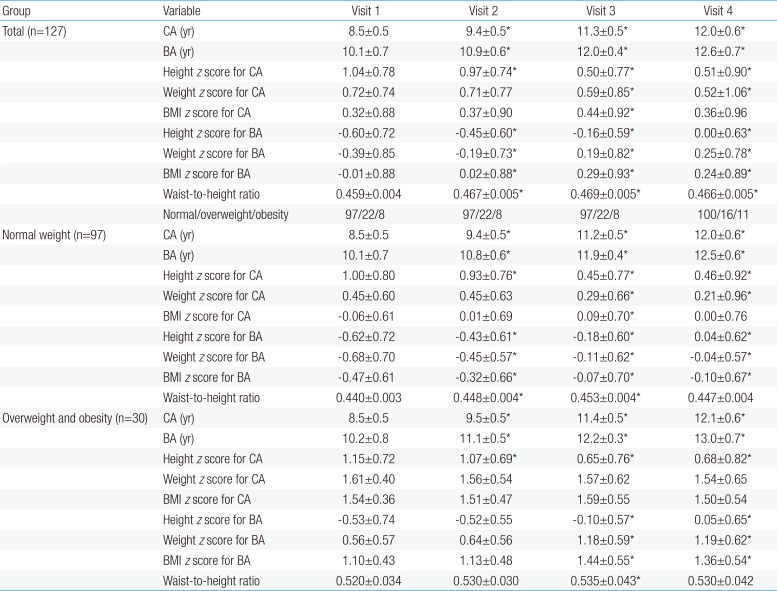
Among all patients, the zBMICA at visit 3 was higher than the value at visit 1 (0.44±0.92 vs. 0.32±0.88, P<0.05) (Table 2). However, the zBMICA at visits 1 and 4 were not significantly different (0.32± 0.88 vs. 0.36±0.96). Compared to visit 1, the zBMIBA were significantly higher at visits 2, 3, and 4. In the normal weight group, the change in zBMICA and zBMIBA were similar to the overall patterns among all patients (Table 2, Fig. 1). In the overweight/obese group, no changes in zBMICA were observed during and after GnRHa treatment, although the zBMIBA at visits 3 and 4 were higher than that at visit 1.

Changes in clinical parameters at each visit
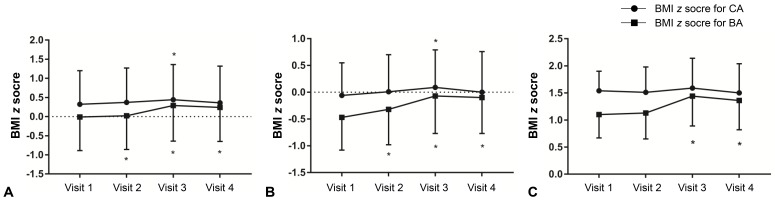
Changes in body mass index (BMI) z score for chronological age (CA) and bone age (BA) in all participants (A), normal weight group (B), and overweight/obese group (C). Asterisk (*) represents significant difference (P<0.05) between visit 1 and each visit. Visit 1, at the start of gonadotropin-releasing hormone (GnRH) agonist treatment; visit 2, at 1 year after GnRH agonist treatment; visit 3, at the end of GnRH agonist treatment; visit 4, at 6–12 months follow-up after GnRH agonist discontinuation.
3. Changes in height and WHtR between visits 1 and 4
A decreasing trend was observed in zHTCA between visits 1 and 3 (Table 2, Fig. 2), although no significant change in zHTCA was observed between visits 3 and 4. A continuous increase in zHTBA was observed between visits 1 and 4. Similar patterns in zHTCA and zHTBA were observed in the normal weight group and the overweight/obese group. The WHtR in the normal weight group increased during the GnRHa treatment (visits 2 and 3) (Table 2, Fig. 3), although no significant change was observed between visits 1 and 4 (0.440±0.003 vs. 0.447±0.004, P>0.05). The WHtR in the overweight/obese group was higher at visit 2 to visit 4, compared to at visit 1.
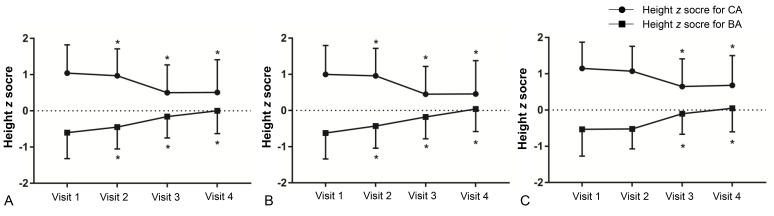
Changes in height z score for chronological age (CA) and bone age (BA) in all participants (A), normal weight group (B), and overweight/obese group (C). Asterisk (*) represents significant difference (P<0.05) between visit 1 and each visit. Visit 1, at the start of gonadotropin-releasing hormone (GnRH) agonist treatment; visit 2, at 1 year after GnRH agonist treatment; visit 3, at the end of GnRH agonist treatment; visit 4, at 6–12 months follow-up after GnRH agonist discontinuation.
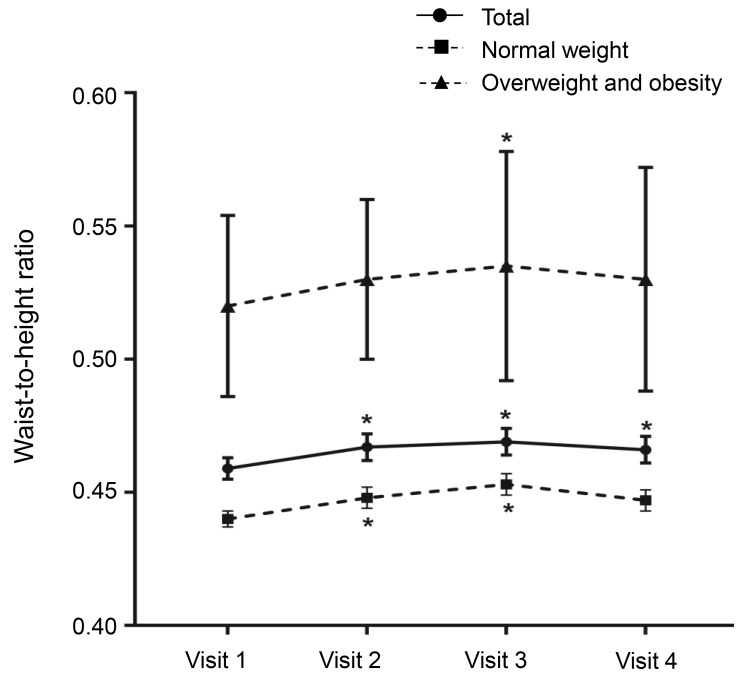
Changes in waist-to-height ratio by body mass index status. Asterisk (*) represents significant difference (P<0.05) between visit 1 and each visit. Visit 1, at the start of gonadotropin-releasing hormone (GnRH) agonist treatment; visit 2, at 1 year after GnRH agonist treatment; visit 3, at the end of GnRH agonist treatment; visit 4, at 6-12 months after GnRH agonist discontinuation.
4. Changes in BMI status between visits 1 and 4
At visit 1, the normal weight, overweight, and obese groups accounted for 76.4%, 17.3%, and 6.3% of the patients, respectively (Fig. 4). At visit 4, the normal weight, overweight, and obese groups accounted for 78.7%, 12.6%, and 8.7% of the patients, respectively. The number of overweight/obese patients decreased from 30 patients at visit 1 to 27 patients at visit 4.
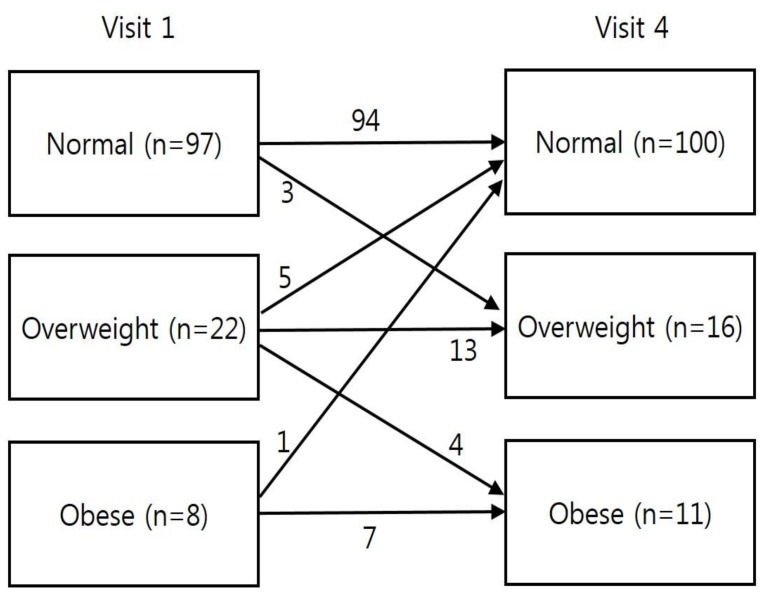
Changes in body mass index category during follow-up peroid in each group. Visit 1, at the start of gonadotropin-releasing hormone (GnRH) agonist treatment; visit 4, at 6–12 months after GnRH agonist discontinuation.
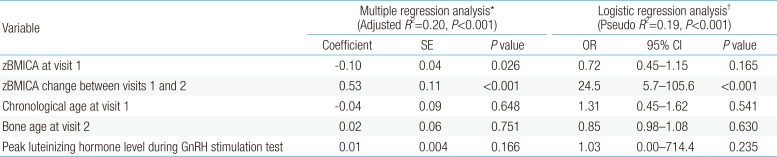
5. Factors associated with changes in zBMICA between visits 1 and 4
In the multiple regression analysis, the change in zBMICA between visits 1 and 4 was negatively associated with the zBMICA at visit 1 (P=0.026) and positively associated with zBMICA change at visits 1 and 2 (P<0.001) (Table 3). In the multiple logistic regression analysis, the change in zBMICA between visits 1 and 4 was associated with the change in zBMICA between visits 1 and 2 (odds ratio, 24.5; 95% confidence interval, 5.7–105.6; P=0.001).

Results of regression analysis determining change in zBMICA between visits 1 and 4
Discussion
The present study evaluated 127 girls who underwent a long-term follow-up, and characterized the changes in height, weight, and BMI that occurred before, during, and after the GnRHa treatment. The results indicate that zBMICA did not increase overall in the normal weight group or the overweight/obese group. However, zBMICA did increase during the first year of GnRHa treatment, which is likely related to the fact that zHTCA decreased while zWTCA remained stable between visits 1 and 2. Nevertheless, both zHTCA and zWTCA decreased after visit 2, which caused a decrease in zBMICA and the nonsignificant difference in the values for visits 4 and 1 (0.32±0.88 vs. 0.36±0.96, P>0.05). In contrast, zBMIBA increased during the follow-up period (-0.01±0.88 at visit 1 vs. 0.24±0.89 at visit 4, P< 0.05), which was caused by a decrease in zHTBA and an increase in zWTBA between visits 1 and 4. However, zBMIBA tended to decrease after GnRHa discontinuation (0.29±0.93 vs. 0.24±0.89), which was caused by a reprogression of puberty that led to a greater increase in height compared to weight.
Previous studies of the effect of GnRHa treatment on weight gain among patients with CPP have revealed controversial findings. The results from the present study agree with findings from an earlier study31) that revealed no significant changes in zBMI among 60 patients with CPP who received GnRHa treatment. Moreover, that study revealed that the patients who received GnRHa treatment had a lower zBMI after a long-term follow-up, compared to patients who did not receive the treatment. Another study evaluated obesity rates and BMI changes among girls with CPP who received GnRHa treatment for >2 years18), and detected a significant decrease in zBMI that was associated with GnRHa treatment. Furthermore, Głab et al.12) reported a decreasing trend in zBMI among 43 patients with CPP after they discontinued GnRHa treatment (3.3±2.2 years). Nevertheless, other studies have revealed conflicting results, with one body composition study of girls who received GnRHa treatment for CPP detecting increases in their fat mass, percentage of body fat, and BMI during the GnRHa treatment7). Moreover, a previous study revealed that zBMICA tended to increase at 6 months after starting GnRHa treatment among 34 patients who received 24 months of treatment for CPP25). Similarly, another study revealed an increase in zBMI during an 18-month period of GnRHa treatment among girls with CPP21).
Interestingly, some studies have revealed BMI changes that varied according to the patient's BMI or weight status before starting GnRHa treatment. For example, Wolter et al.22) monitored the zBMI of patients with CPP and detected a clear increase in zBMI for the normal weight group during their first year of treatment, but no change for the overweight/obese group. Similarly, Yoon et al.27) reported a remarkable increase in zBMI (−0.15±0.72 vs. −0.08±0.66, P<0.05) in the normal weight group after 1 year of GnRHa treatment, although no significant change was observed in the overweight/obese group (1.69±0.51 vs. 1.60±0.48, P>0.05). Furthermore, Park and Kim26) reported a significant increase in zBMI during the first year of GnRHa treatment (−0.1±0.7 vs. 0.1±0.8, P< 0.001), with no change in the overweight/obese group, although an increase was detected in their insulin resistance index. Nevertheless, it is important to note that the reported correlations between BMI and obesity were limited by the studies' small sample size or an insufficient follow-up period72125).
The present study also evaluated WHtR, which is an indicator of abdominal obesity, at each visit. The overweight/obese group had an increased WHtR at visit 3, although the values were not significantly different when we compared visits 1 and 4. Similarly, the normal weight group had an incrementally increased WHtR at visits 2 and 3, although the values were not significantly different when we compared visits 1 and 4. Another domestic study has revealed similar tendencies26), although the present study involved a longer follow-up after the treatment had been discontinued, which allows us to conclude that abdominal obesity did not develop after termination of the GnRHa treatment.
Significant changes in the BMI categories were observed between visits 1 and 4, with some of the 22 overweight patients at visit 1 being reclassified as normal weight (n=5) or obese (n=4) at visit 4 (Fig. 4). Thus, girls with CPP who are overweight and obese require careful attention to weight management during GnRHa treatment. Moreover, the change in zBMICA during the first year of GnRHa treatment was significantly associated with the change in zBMICA during the follow-up period. Therefore, weight control during early GnRHa treatment appears critical to preventing the development of obesity among girls with CPP.
During puberty, sex steroid hormone concentrations are closely related to increasing body fat among girls and increasing muscle mass among boys3233), in addition to the usual weight gain. Furthermore, GnRHa inhibits sex steroid hormone secretion, which could suppress the development of obesity among overweight patients. However, the normal weight group had gradually increasing zBMI values during their GnRHa treatment. The increasing prevalence of obesity after GnRHa treatment may be related to increased leptin and insulin concentrations in overweight patients, which could be caused by the conversion of adrenal androgen to estrogen because of aromatase activation in the adipose tissue34). Nevertheless, the explanation for the BMI-specific differences in zBMI among patients with CPP remains unclear, as is the reason for the inconsistent changes in weight and BMI among those patients. Several factors may be responsible for these inconsistencies in the existing studies, such as the absence of control groups, differences in the patients' ages and sexes, and the lack of data regarding the patients' pretreatment obesity status.
The present study has several limitations. First, the retrospective evaluation of medical records and lack of a control group are associated with known risks of bias. Second, we did not have access to data regarding the patients' adult values for height and BMI, although all patients did complete a 6-to 12-month follow-up after stopping the GnRHa treatment. Third, we did not have access to information regarding the patients' dietary habits, changes in body composition, exercise levels, and family histories of obesity. Fourth, it is possible that the patients were encouraged by their families to improve their diet and physical activity, which could have eliminated any BMI increases during the treatment, although we did not provide any specific lifestyle advice to the patients. Fifth, obesity was classified using BMI and waist circumferences values, which are less accurate than dual energy x-ray absorptiometry35) and may have confounded our analysis of the association between GnRHa treatment and obesity. Finally, there was no analysis of hormonal parameters that might affect changes in BMI during GnRHa treatment. Nevertheless, the present study's findings are strengthened by the relatively large number of patients with idiopathic CPP who were followed for up to 12 months after discontinuing GnRHa treatment.
In conclusion, no increase in zBMICA was observed during or after the GnRHa treatment. However, a consistent increase in zHTBA was observed during and after the GnRHa treatment, which suggests a positive effect on the patients' final adult height. Furthermore, weight management appears to be important during the first year of GnRHa treatment, especially for overweight and obese girls with CPP. A long-term prospective study is needed to confirm the effects of GnRHa treatment on the anthropometric characteristics of girls with CPP until they achieve adult height.
Notes
Conflicts of interest: No potential conflict of interest relevant to this article was reported.