Comparison of effectiveness of growth hormone therapy according to disease-causing genes in children with Noonan syndrome
Article information

Abstract
Purpose
To analyze the growth response to growth hormone (GH) therapy in prepubertal patients with Noonan syndrome (NS) harboring different genetic mutations.
Methods
Twenty-three patients with prepubertal NS treated at Pusan National University Children’s Hospital between March 2009 and July 2017 were enrolled. According to the disease-causing genes identified, the patients with NS were divided into 4 groups. Three groups were positive for mutations of the PTPN11, RAF1, and SOS1 genes. The five genes undetected (FGU) group was negative for PTPN11, RAF1, SOS1, KRAS, and BRAF gene mutations. The influence of genotype was retrospectively analyzed by comparing the growth parameters after GH therapy.
Results
The mean chronological age at the start of GH treatment was 5.85±2.67 years. At the beginning of the GH treatment, the height standard deviation score (SDS), growth velocity (GV), and lower levels of insulin-like growth factor-1 (IGF)-1 levels were not statistically different among the groups. All the 23 NS patients had significantly increased height SDS and serum IGF-1 level during the 3 years of treatment. GV was highest during the first year of treatment. During the 3 years of GH therapy, the PTPN11, RAF1, and SOS1 groups showed less improvement in height SDS, IGF-1 SDS, and GV, and less increase in bone age-to-chronological age ratio than the FGU group.
Conclusion
The 3-year GH therapy in the 23 prepubertal patients with NS was effective in improving height SDS, GV, and serum IGF-1 levels. The FGU group showed a better response to recombinant human GH therapy than the PTPN11, RAF1, and SOS1 groups.
Introduction
Noonan syndrome (NS) is characterized by short stature, distinctive facial dysmorphic features including hypertelorism, down-slanting palpebral fissures and low-set posteriorly rotated ears, congenital heart defects, hypertrophic cardiomyopathy, skeletal anomalies, and webbing of the neck [1]. Other relatively common features are bleeding diathesis, ectodermal anomalies, lymphatic dysplasia, cryptorchidism and cognitive deficits [2]. NS is caused by aberrant RAS-mitogen-activated protein kinase (MAPK) signaling and is genetically heterogeneous. The classical form of NS is principally associated with heterozygous missense mutations in 4 genes: PTPN11, RAF1, SOS1, and KRAS. The proportion of these mutations is 50%, 10%, 10%, and <2%, respectively [3]. The mutations have been identified in 70%–80% of patients with NS [4], with the diagnosis of NS still based on clinical findings in the remaining patients with NS.
NS patients with the PTPN11 mutation tend to display a shorter birth length, lower levels of insulin-like growth factor-1 (IGF-1), and IGF binding protein 3, higher resting and stimulated growth hormone (GH) levels, and poorer response to GH therapy [5]. Several studies have reported final height data after GH treatment of children with NS. However, these studies were relatively small and lacked the matched or randomized controls required for proper comparison [6]. In addition, gene analysis was restricted to PTPN11, and excluded the recently discovered candidate genes RAF1, SOS1, and KRAS.
In Korea, the study of long-term efficacy of GH therapy in short-statured patients with NS was also restricted to PTPN11 mutation [7] and is unclear. The goal of this study was to assess growth response following GH therapy in prepubertal NS patients harboring different genetic mutations.
Materials and methods
1. Subjects and methods
This is retrospective study designed to evaluate the efficacy of 3 years of GH therapy in 23 prepubertal children with NS. Patients with NS were diagnosed based on criteria of van der Burg et al. [8] and genetic investigation at Pusan National University Children’s Hospital, between March 2009 and July 2017. The prepubertal status in girls was breast and pubes Tanner stage I. The prepubertal status in boys was testicular volume less than 4 mL and Tanner stage I in pubic hair and genitalia [9,10]. At division of Pediatric Genetics in Pusan National University Children’s Hospital, when patients are diagnosed with NS, genetic testing and GH therapy are recommended in the short-statured patients with NS. Initially, genetic testing for PTPN11 gene was done in suspected 23 patients with NS. If the result is negative, analysis of causative genes associated with NS (RAF1, SOS1, KRAS, and BRAF gene) was performed in patients with NS. Five genes undetected (FGU) group refers to a group of patients with NS who have no mutations in 5 causative genes (PTPN11, RAF1, SOS1, KRAS, and BRAF gene). According to disease-causing genes identified, patients with NS were divided into 4 groups (PTPN11 [n=7], FGU [n=11], RAF1 [n=3], and SOS1 [n=2] group). The influence of genotype was analyzed by comparing the growth parameters at the start of treatment and at 1, 2, and 3 years after GH therapy.
The rhGH (Norditropin, Novo Nordisk Pharma, Hellerup, Denmark) was subcutaneously administered at a dose of 50–70 μg/kg/day for 6 days a week. The main outcome measures were height standard deviation score (SDS), growth velocity (GV), and IGF-1 SDS. Height and weight were measured at baseline and annually. Height and weight were expressed as SDS on the basis of normative data from Korean references [11]. Complete blood count, routine chemistry, glucose, hemoglobin A1C, free T4, thyroid-stimulating hormone, IGF-1, and IGF binding protein 3 (IGFBP-3) levels were measured at baseline and annually. IGF-1 SDS and IGFBP-3 SDS were calculated on the basis of normative data from a Korean reference [12]. Bone age was determined annually using the Greulich-Pyle method [13]. Each subject received an annual electrocardiogram and echocardiogram.
Puregene DNA isolation kits (Gentra, Minneapolis, MN, USA) were used for genomic DNA extraction from peripheral blood leukocytes. The coding regions and intronic flanking regions of the PTPN11, RAF1, SOS1, KRAS, and BRAF genes were amplified by polymerase chain reaction with specific primers and directly sequenced using an ABI3130xl Genetic Analyzer (Applied Biosystems, Foster City, CA, USA). The study was approved by the Institutional Review Board (IRB) of Pusan National University Yangsan Hospital (approval number: 50-2018-121). Written informed consent was waived by the IRB.
2. Statistical analyses
The Friedman test was used to evaluate the effect of GH therapy. The Wilcoxon signed rank test was used to compare the changes between pre- and post-GH therapy. The relationships between the genotypes of subjects and growth parameters, including bone age, height SDS, GV, and serum IGF-1 and IGFBP-3 levels were assessed by the Mann-Whitney U test. Statistical analyses were conducted using IBM SPSS Statistics ver. 18.0 (IBM Co., Armonk, NY, USA). P<0.05 was considered statistically significant.
Results
1. Clinical and molecular characteristics of 23 prepuberal patients with NS
The 23 prepubertal NS patients comprised 14 boys and 9 girls. Mean gestational age of the 23 subjects at birth was 38+1 weeks. Seven of the 23 children (30.4%) were born prematurely (<37 weeks gestational age). Mean birth weight of the 23 subjects was 3.17±0.76 kg. The mean age at diagnosis was 4.44±3.29 years (1.00 month–10.00 years). The mean chronological age at the start of GH treatment was 5.85±2.67 years (2.0–10.0 years).
Among the 23 children, 17 (73.9%) had congenital heart defects, including atrial septal defect (11 of 17, 64.7%), pulmonic stenosis (6 of 17, 35.2%), hypertrophic cardiomyopathy (5 of 17, 29.4%), ventricular septal defect (4 of 17, 23.5%), and patent ductus arteriosus (3 of 17, 17.6%). Fifteen patients (62.2%) had chest wall deformity. Fifteen patients (65.2%) had developmental delay or intellectual disability. Eleven patients (47.8%) had genital anomalies and scoliosis/kyphosis, respectively. One patient had sensorineural hearing loss. No one had cubitus valgus and a bleeding tendency. Height SDS, GV, serum IGF-1 SDS, and serum IGFBP-3 SDS levels at baseline were -2.58±1.55, 5.3±1.1 cm/yr, -0.64±1.31, and 0.12±0.42, respectively.
Molecular analysis showed that 7 patients (30%) had a PTPN11 mutation, 11 (47.8%) had no mutations in 5 causative genes, 3 (13%) had a RAF1 mutation, and 2 (8.7%) had a SOS1 mutation.
2. Clinical and endocrinological manifestations of 23 prepubertal NS patients at baseline according to disease-causing genes
Baseline clinical characteristics of the four NS groups are shown in Table 1. The birth weight was similar among the 4 groups. In FGU, PTPN11, RAF1, and SOS1 groups, the median chronologic age of the 4 groups at the start of treatment was 7.0 (range, 6.5–10.0), 2.8 (range, 2–10), 4.0 (range, 2.3–5.9), 4.0 years (range, 2.1–6.0 years), respectively. The bone age/chronological age (BA/CA) ratio was not different among the 4 groups (P=0.757). The weight SDS of the 4 groups at the start of treatment was -1.70 (range, -2.74–0.49), -2.47 (range, -3.68 to -0.95), -1.57 (range, -4.30 to -0.98), -4.42 (range, -8.00 to -0.84), respectively. The body mass index (BMI) SDS of the 4 groups at the start of treatment was -0.75 (range, -2.03–1.48), -0.75 (range, -2.03–1.48), 0.68 (range, 0.50–0.81), -0.64 kg/m2 (range, -2.13–0.49 kg/m2), respectively. The height SDS of 4 groups at the start of treatment was -1.55 (range, -2.78 to -0.49), -2.24 (range, -3.63–0.79), -2.72 (range, -6.42 to -2.49), -4.29 (range, -6.79 to -1.79), respectively. The GV of the four groups at the start of treatment was 5.52 (range, 3.80–6.77), 4.90 (range, 2.80–6.93), 6.50 (range, 4.00–7.20), 6.50 cm/yr (range, 4.00–7.20 cm/yr), respectively. The IGF-1 SDS of the 4 groups at the start of treatment was 0.02 (range, -2.81–1.21), -0.91 (range, -2.53–1.40), -0.54 (range, -0.57–0.19), -0.88 (range, -1.31 to -0.46), respectively. The IGFBP-3 SDS of the 4 groups at the start of treatment was 0.24 (range, -0.05–0.93), 0.34 (range, 0.08–0.62), -0.06 (range, -0.29–0.09), -0.40 (range, -0.65 to -0.16), respectively. The initial dose of GH of 4 groups at the start of treatment was 60.0 (range, 55.0–63.0), 62.0 (range, 55.0–65.0), 60.0 (range, 54.0–65.0), 60.0 μg/kg/day (range, 55.0–65.0 μg/kg/day), respectively.
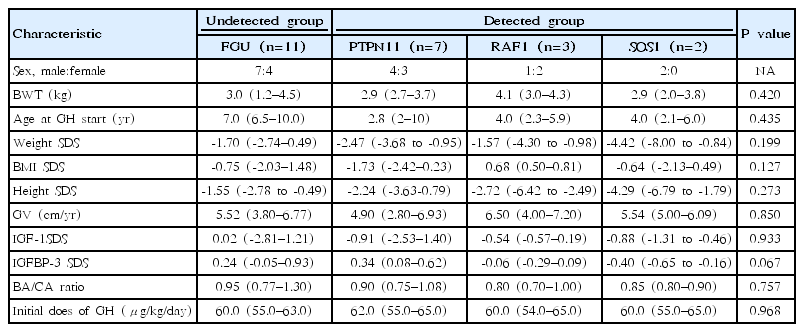
Baseline clinical characteristics of the 23 patients with Noonan syndrome
3. Efficacy of GH therapy in 23 prepuberal patients with NS
Endocrinological parameters of the 23 patients are shown in Supplementary Table 1. Height SDS increased from -2.30 (range, -6.79 to -0.49), to -2.11 (range, 6.59–0.31), to -1.97 (range, -6.15–0.72), to -1.95 (range, -4.77–1.10), respectively, at the year 1, 2, and 3 of treatment (P=0.001). GV during the first year of treatment was highest (8.90; range, 6.00–12.21 cm/yr). GV increased from 5.52 (range, 2.80–7.20) at baseline to 8.18 (range, 5.00–10.70) and 7.80 cm/yr (range, 4.20–9.80 cm/yr) at year 2 and 3, respectively (P<0.0001). Serum IGF-1 SDS increased significantly from -0.54 (range, -2.81–1.40) to 0.73 (range, -1.06–3.80) after 3 years (P<0.0001). Serum IGFBP-3 SDS changed from 0.09 (range, -0.65–0.93) to 0.31 (range, -0.41–0.91), which was not statistically significant (P=0.123). The BA/CA ratio significantly increased from 0.90 (range, 0.70–1.30) at the start of treatment to 0.92 (range, 0.80–1.50), 0.93 (range, 0.80–1.70), and 0.98 (range, 0.80–1.75), respectively, after 1, 2, and 3 years of treatment and at the end of treatment (P=0.026). BMI SDS changed from -0.88 (range, -2.42–1.48) to -0.83 (range, -2.16–1.56), which was not statistically significant (P=0.940).
4. Response to GH therapy according to disease-causing genes in 23 prepubertal patients with NS
During the 3 years of GH therapy, FGU group was much higher in delta height SDS, i.e., height SDS at a given time of treatment minus height SDS at baseline, (Δ height SDS 2.07±0.47, P<0.001) and GV (from 5.33±0.94 cm/yr to 8.73±0.72 cm/yr, P<0.001) (Figs. 1, 2). However, PTPN11, RAF1, and SOS1 groups did not show significant improvement in delta height SDS and GV after 3 years of GH therapy (PTPN11 mutation group: Δ height SDS 0.37±1.02, P=0.318, GV from 5.1±2.1 cm/yr to 6.6±0.9 cm/yr, P=0.259; RAF1 group: Δ height SDS 1.99±1.18, P=0.400, GV from 5.90±1.69 cm/yr to 7.33±0.50 cm/yr, P=0.200; SOS1 group: Δ height SDS 1.62±0.57, P=0.667, GV from 5.55±0.77 cm/yr to 7.40±0.57 cm/yr, P=0.333). The PTPN11 group showed improved growth rate after 1 year of GH therapy (P=0.039), but not after 2 or 3 years of treatment (Fig. 2). Serum IGF-1 SDS levels of the FGU group were significantly elevated from -0.65±1.30 to 1.01±1.33 (P=0.013) after 3 years of GH therapy (Fig. 3). However, serum IGF-1 SDS levels of the PTPN11, RAF1, and SOS1 groups were not significantly elevated after 3 years of GH therapy (PTPN11 group: from −0.71±1.29 to 0.50±1.01, P=0.383; RAF1 group: from -0.31±0.43 to -0.80±1.16, P=0.200; SOS1 group: from -0.88±0.60 to 0.27±0.27, P=0.333). The BA/CA ratio of the FGU group were significantly increased from 0.94±0.17 to 1.14±0.34 (P=0.005) after 3 years GH therapy (Supplementary Fig. 1).
Sequential changes in height standard deviation score (SDS) during growth hormone (GH) treatment in the patients with Noonan syndrome, including PTPN11, FGU, RAF1, and SOS1 groups. The Wilcoxon signed-rank test was used to compare responses to GH therapy according to disease-causing genes. During the 3 years of GH therapy, the FGU group showed more improvement in height SDS. *P<0.05. **P<0.001.
Sequential changes in growth velocity during growth hormone treatment (GH) in the patients with Noonan syndrome, including the PTPN11, FGU, RAF1, and SOS1 groups. The Wilcoxon signed-rank test was used to compare responses to GH therapy according to the diseasecausing genes. The FGU group showed more improvement in GV. *P<0.05. **P<0.001.

Sequential changes in insulin-like growth factor 1 (IGF-1) standard deviation score (SDS) during growth hormone (GH) treatment in patients with Noonan syndrome, including the PTPN11, FGU, RAF1, and SOS1 groups. The Wilcoxon signed-rank test was used to compare the responses to GH therapy according to the disease-causing genes. The serum IGF-1 SDS levels in the FGU group were significantly elevated after 3 years of GH therapy compared with the other groups. *P<0.05.
5. Comparison of response to GH therapy among the 4 groups
Height SDS gain after 2 and 3 years of GH treatment was significantly lower in the PTPN11 group than the FGU group (P=0.004 and P=0.011, respectively) (Fig. 4). The GV after 1, 2 and 3 years during GH treatment was significantly lower in the PTPN11 group than in the FGU group (P=0.015, P<0.001, and P<0.001, respectively) (Fig. 5). The difference in the improvement of GV after 3 years of GH treatment was significantly lower in the RAF1 group than in the FGU group (P=0.011). No statistical difference in improvement of IGF-1 SDS was found between patients with NS concerning the PTPN11, RAF1, and SOS1 mutations (Supplementary Fig. 2).
Comparison of height standard deviation score (SDS) change from before to during growth hormone (GH) treatment among patients with Noonan syndrome with different disease-causing genes. The Mann-Whitney U test was used to compare the response to GH therapy according to the disease-causing gene. The height SDS gain after 2 and 3 years of GH treatment was significantly higher in the FGU group than the PTPN11 group. *P<0.05.
Comparison of growth velocity (GV) changes from before to during growth hormone (GH) treatment among the patients with Noonan syndrome with different disease-causing genes. The Mann-Whitney U test was used to compare the response to GH therapy according to disease-causing genes. The difference in the improvement of GV after 3 years of GH treatment was significantly higher in the FGU group than in the PTPN11 and RAF1 groups. *P<0.05. **P<0.001.
Discussion
Short stature is considered a general characteristic of children with NS irrespective of the affected protein of the RAS-MAPK pathway, suggesting that deregulation of RAS-MAPK signaling confers the growth disturbance found in NS [14]. In this study, we described the clinical and endocrinological manifestations and GH response in prepubertal children with NS after 3 years of GH therapy according to disease-causing genes.
First, the overall NS cohort statistics (2016 Korea National Statistical Office) are characterized by a higher prevalence of premature infants in NS patients than those of the general population (30.4% vs. 7.2%) [15]. In the present study, prematurity occurred in 2 of 7 patients (28.5%) with PTPN11 mutation and 1 of 2 patients (50%) with SOS1 mutation. Patients with NS typically display had normal birth weight [5], which is consistent with our results. The subsequent development of postnatal growth (SDS, -2.5) in the patients with NS was similar to that reported previously with a mean height following -2 SDS in NS patients from childhood to adulthood [16,17]. No statistical difference in height according to disease-causing genes in patients with NS was reported in a previous study, although patients with SOS1 were taller at the different ages than patients with PTPN11 and RAF1 mutations [5]. Short stature is most prevalent in patients with the PTPN11 mutation, probably because Src homology region 2-domain phosphatase-2 (SHP-2) is involved in GH receptor signaling [18].
In the present study, a significant increase in growth parameters, including height SDS, GV, and IGF-1 SDS in prepubertal children with NS was identified after 3 years of GH therapy. Despite the small sample size of the cohorts and the short term of GH treatment, the findings of prior studies have indicated that short-term GH therapy increases the mean height SDS in short children with NS. According to a meta-analysis [19], the range of height gain to adult age varies between 0.6–2.0 SDS, depending on age at GH therapy start, duration of GH therapy, and genotypes. Our study showed 23 patients with NS had a gain in the height SDS of 1.5 SDS (P<0.01) in the third year. To clarify how much the final height increases in our patients with NS through GH therapy, further study will be necessary for longer periods of time.
Patients with NS were divided into 4 groups according to diseasecausing genes (PTPN11, FGU, RAF1, and SOS1 groups) and analyzed the effects of GH during 3 years of GH therapy. At the beginning of GH treatment, the growth parameters including GV, height SDS, and IGF-1 were not statistically different among the disease-causing genes. However, the variance of growth patterns was insignificant according to disease-causing genes after GH therapy except for the FGU group. Annual changes in the BA/CA ratio were significantly greater in the FGU group than in the other groups after 2 and 3 years of GH therapy, which suggest that rhGH treatment in the FGU group has higher effect on bone maturation relative to CA than compared to PTPN11, RAF1, and SOS1 group. Especially, FGU group displayed more improvement in height SDS, GV, and IGF-1 SDS compared to other groups after 2 and 3 years of rhGH treatment. There was a significant difference in GV and height SDS between PTPN11 and FGU groups at 2 and 3 years after GH treatment. A trend toward a higher first-year GV for PTPN11 and FGU group was evident in comparison to that in children with the RAF1 or SOS1 mutation. However, GV in year 2 and 3 of GH therapy was not significantly increased in the PTPN11 group compared to the FGU group, which suggests that the PTPN11 group confer greater GH resistance or insensitivity than in the FGU group after long-term GH therapy. PTPN11 encodes the nonreceptor-type protein tyrosine phosphatase, SHP-2. PTPN11 has been identified as the major NS gene. SHP-2 mutations cause mild GH resistance by a post-receptor signaling defect, which may contribute to growth failure and the relatively poor response to GH in NS [19]. In several NS mouse models carrying a PTPN11, RAF1, or SOS1 mutation, chronic inhibition of the RAS-MAPK pathway improves GV [20-22]. Regarding the mechanisms involved, it has been reported that a PTPN11 mutant impairs the systemic production of IGF-1, the biological mediator of GH acting on growth plate, through a hyperactivation of the RASMAPK signaling pathway [21]. These experimental data are consistent with clinical data indicating partial GH insensitivity in patients with NS. Thus, different IGF-1 levels may explain the differences of height between genotypes [5]. Previous studies have been performed to assess growth response following GH therapy in prepubertal patients with NS restricted to PTPN11. In a prospective study, a lower catch-up height SDS after 2 years was observed in a prepubertal group (n=25, mean age 10.4 years) with PTPN11 mutations [23]. A retrospective study in Brazil reported a slightly worse response to GH in 14 patients (mean age, 10.9 years) with PTPN11 mutations compared to those without PTPN11 mutations (height gain, +0.8 vs. +1.7) [24]. In a retrospective study in Germany, a prepubertal subgroup of 11 children with NS (mean age, 7.1 years) was treated, and height gain was significantly smaller during the first year of therapy in the PTPN11 mutation group (height gain, +0.66 vs. +1.26) [18]. In a retrospective study included a relatively small number of Korean patients, only height SDS was significantly increased in patients without PTPN11 mutations compared to those with PTPN11 mutations after 3 years [7]. On the contrary, no significant differences in height SDS, height velocity and serum IGF-I level in response to GH treatment were found between children with and those without PTPN11 mutations in 2 studies [25,26]. In the present study, FGU group showed a better response to GH therapy than PTPN11, RAF1, and SOS1 groups. Genetic background may have major role in height outcome, but the precise mechanism remains unknown. In addition, the factors such as GH secretary status, GH resistance, skeletal deformity, combined heart anomaly in patients with NS may affect height outcome.
Cardiac anomalies of pulmonary valve stenosis and hypertrophic cardiomyopathy are one of the most important characteristics of NS [27]. In particular, cardiac defects, such as mild or severe hypertrophic cardiomyopathy, have raised concerns related to the anabolic effects of GH and the possible progression of ventricular hypertrophy [28].
However, GH treatment has not been associated with cardiac impairment in this group of patients [28]. In the present study, there were no serious adverse events, such as malignancy, hyperglycemia, or thrombocytopenia with bleeding tendency, in the patients with NS during GH treatment. However, one of patients with the RAF1 mutation with ventricular hypertrophy at the beginning of the therapy experienced progression of the hypertrophic cardiomyopathy during GH treatment that necessitated discontinuation of GH. Therefore, careful monitoring should be performed to detect hypertrophic cardiomyopathy and progression of the underlying heart disease during GH therapy in NS patients, especially those with RAF1 mutation.
This study has some limitations which have to be pointed out. First, the small patient population and the retrospective nature of the study do not allow us to draw any definite conclusion about the effectiveness of GH on prepubertal NS patients harboring different genetic mutations. Second, a relatively high frequency of FGU group was shown in this study, suggesting genetic heterogeneity of NS. However, a mutation screening of only 5 genes commonly observed in patients with NS was conducted. Therefore, FGU group enrolled in the present study is likely to include SHOC2, NRAS, MEK1, MAP2K1, SOS2, LZTR1, A2ML1, and RIT1 mutation that are rare mutations related to NS and were not screened. Third, the effectiveness of GH was significantly remarkable in FGU group. However, this result might be perverted owing to the different frequency of GH secretary status, scoliosis/lordosis, and congenital heart disease between FGU group and detected group which may affect growth response to GH. Unfortunately, GH provocation test was not performed in most of the patients with NS. The frequency of scoliosis or lordosis at baseline was much lower in FGU group (3 of 11, 27.2%) compared with detected group (8 of 12, 66.6%). The frequency of congenital heart disease was also much lower in FGU group (5 of 11, 45.4%) compared with detected group (11 of 12, 91.6%). Therefore, there is need to conduct the statistical calibration for this potential confounder.
In conclusion, this is the first report on the effects of 3 years of GH therapy on growth in patients with NS divided into 4 categories such as PTPN11, FGU, RAF1, and SOS1 groups in a Korean population. FGU group showed a better response to rhGH therapy compared to the groups with PTPN11, RAF1, and SOS1 group. Further prospective studies with larger number of patients are required to better delineate the responsiveness of GH to the growth patterns of Korean patients with NS according to disease-causing genes.
Notes
No potential conflict of interest relevant to this article was reported.
Acknowledgements
This work was supported by a 2-year Research Grant of Pusan National University.
Supplementary materials
Supplementary Table 1 and Figs. 1, 2 can be found via https://doi.org/10.3345/kjp.2018.06842.