Iron deficiency anemia as a predictor of coronary artery abnormalities in Kawasaki disease
Article information

Abstract
Purpose
Coronary artery abnormalities (CAA) are the most important complications of Kawasaki disease (KD). Iron deficiency anemia (IDA) is a prevalent micronutrient deficiency and its association with KD remains unknown. We hypothesized that presence of IDA could be a predictor of CAA.
Methods
This retrospective study included 173 KD patients, divided into 2 groups according to absence (group 1) and presence (group 2) of CAA. Odds ratios (ORs) with 95% confidence intervals (CIs) were calculated using a logistic regression model to estimate the association between CAA and other indicators. Due to collinearity between indicators of IDA, each indicator was paired with anemia in 3 models.
Results
Serum iron, iron saturation, and ferritin concentration, the 3 indicators of IDA, were significantly higher in group 1 than in group 2. Three sets of models including anemia with iron indicators produced the OR of CAA of 3.513, 3.171, and 2.256, respectively. The 3 indicators of IDA were negatively associated with CAA, by OR of 0.965, 0.914, and 0.944, respectively. The areas under the curve (AUCs) of ferritin concentration, iron saturation, serum iron, anemia, and Kobayashi score were 0.907 (95% CI, 0.851–0.963), 0.729 (95% CI, 0.648–0.810), 0.711 (95% CI, 0.629–0.793), 0.638 (95% CI, 0.545–0.731), and 0.563 (95% CI, 0.489–0.636), respectively.
Conclusion
Indicators of IDA, especially ferritin, were highly associated with CAA; therefore, they were stronger predictors of CAA than Kobayashi scores. IDA indicators can be used to predict CAA development and to suggest requirements for early interventions.
Introduction
Kawasaki disease (KD) is an acute febrile systemic vasculitis found predominantly in infants and young children [1]. The cause of KD remains unknown, but certain epidemiologic and clinical features support an infectious origin [2]. Coronary artery abnormalities (CAA), such as aneurysm and ectasia, is the most important complication of KD. While its severity ranges from no invasion to multiple giant coronary aneurysms, it can lead to aneurysm rupture, thrombosis or stenosis, myocardial infarction, and even sudden death [3]. In addition to standard diagnostic criteria, KD patients may experience a variety of nonspecific clinical features, including uveitis, aseptic meningitis, abdominal pain, gallbladder hydrops, hypoalbuminemia, and anemia. Among these, anemia in KD patients is thought to prolong duration of active inflammation [4].
Inflammation-associated anemia represents a significant, highly prevalent clinical problem [5]. There is a previous study that explains children with IDA are prone to frequent infection, due to the impact of IDA on the immune system [6,7]. Recent evidence suggests that iron is an essential element to normal development of the immune system, especially for immune cell proliferation [8]. Its deficiency affects the capacity to have an adequate immune response.
There have been several risk stratification models to determine which patients with KD are at highest risk for CAA. Of the 3 specific risk scores constructed by Japanese researchers, the Kobayashi score is the most widely used and has high sensitivity and specificity. Unfortunately, application of the score in non-Japanese populations does not appear to accurately identify all children at risk for CAA [2]. Since clinicians tend to treat KD with high risk aggressively to minimize progression to CAA, a more accurate identification of predictors is necessary.
Upon discovering a tendency of KD patients often concomitantly diagnosed with IDA, we initiated to search for predictors of CAA in KD. We hypothesized that a potential association might explain the relationship between CAA and IDA. To our knowledge, there are insufficient data available for iron levels in patients with KD. Hence, the main focus of our study was on the evaluation of IDA indicators in a cohort of children diagnosed with KD.
Materials and methods
1. Patient enrollment & data measurement
One hundred seventy-three Korean patients, diagnosed with acute phase of KD according to the American Heart Association criteria, were enrolled in this study from May 2015 to June 2016 [9].
For every patient diagnosed with KD, Iron deficiency anemia (IDA) work-up was performed, and demographic data and clinical features at the onset of KD fever were reviewed.
In the acute phase of KD, before treatment of Intravenous Immunoglobulin and aspirin, fundamental laboratory values including complete blood count, routine chemistry, electrolytes, erythrocyte sedimentation rate, C-reactive protein (CRP), cardiac markers such as N-terminal pro b-type natriuretic peptide, troponin T, were obtained with IDA indicators which are hemoglobin (Hb), mean corpuscular volume (MCV), serum iron, iron saturation, ferritin.
Echocardiogram was performed at the time of diagnosis for all patients. To minimize bias, the guideline of international standard was applied when measuring the coronary artery with echocardiography [10]. Left main coronary artery was measured at mid-position, distal to the aortic orifice and before the bifurcation of the Left coronary artery. Left anterior descending coronary artery was measured at distal to the bifurcation and before the first marginal branch, while right coronary artery was measured in a relatively straight section.
2. Study design
The patients were classified according to the absence (group 1) or presence (group 2) of CAA.
CAA was considered to be present if coronary artery diameter was >3 mm in patients under age 5 and >4 mm in patients over 5 years of age, or if coronary artery diameter was 1.5 times of adjacent coronary artery and/or if coronary artery lumen was irregular on echocardiography [11].
Since the lower limit of normal Hb value varies by age, anemia was defined using the following cutoff value according to age: 11.0 g/dL for under 4 years of age, 11.5 g/dL for ages 5–7, 12.0 g/dL for ages 8–11, 12.0 g/dL for female patients of ages 12–14, and 12.5 g/dL for male patients of ages 12–14 [12].
Iron deficiency was defined as presenting with low serum iron (<50 μg/dL), low iron saturation (<16%), and low serum ferritin(<30 μg/L). In diagnosing iron deficiency under normal circumstances, serum ferritin’s cutoff value is 12 for ages 5 or under, and 15 for ages over 5. However, the cut-off value rises to 30 μg/L in all age groups in the presence of infection, henceforth justifying the application of such standard to our patients in acute stage of KD [2,13].
IDA was diagnosed only when the abovementioned definitions of both anemia and iron deficiency were met.
The indices of Kobayashi score for KD, were also analyzed for association with the presence of CAA [14].
3. Statistical analysis
Values are numbers (column %), means±standard deviations, or medians (Q1, Q3), as appropriate.
Mann-Whitney U test was performed for nonnormally distributed numerical data, while chi-square test or Fisher exact test was done for categorical data.
The odds ratio (OR) with 95% confidence interval (CI) was calculated using a logistic regression model to estimate the association level between CAA and iron deficiency. For this analysis, variables with P<0.05 on the unadjusted analysis were entered.
Because the three indicators of IDA had collinear relationship, each indicator had to be paired with anemia for valid statistical analysis (Fig. 1). Three different models were analyzed for their association with CAA, using multiple logistic regression analysis, and they adjusted by age, sex, and body surface area which were confounding factors.
Relationship between anemia, iron deficiency, iron deficiency anemia (IDA), and IDA indicators using 3 models. Iron deficiency anemia was diagnosed only when the criteria for both anemia and iron deficiency were met. Anemia was defined using the following cutoff value according to age. Iron deficiency was defined as low serum iron (<50 μg/dL), low iron saturation (<16%), and low serum ferritin (<30 µg/L). Due to the collinearity between IDA indicators, each indicator was paired with anemia in 3 different models. Model 1 includes anemia and serum iron; model 2 includes anemia and iron saturation; model 3 includes anemia and ferritin. Hb, hemoglobin.
CAA and IDA indicators were further analyzed by receiver-operating characteristic (ROC) curve and its area under the curve (AUC) to determine predictability of CAA development. Comparison of AUCs was performed using DeLong method.
Statistical analyses were performed using SAS ver. 9.4 (SAS Inc., Cary, NC, USA). The statistically significant level was set at P<0.05.
4. Ethics statement
The present study protocol was reviewed and approved by the Institutional Review Board of Yonsei University College of Medicine (approval number: 2018-0108-001) with waive of informed consent.
Results
Of 173 enrolled patients, 55 patients (group 2=31.8%) had CAA, while 118 patients (group 1=68.2%) did not. Sex and age were not significantly different between the 2 groups. The difference in median Hb value was statistically significant, with 12.1 g/dL in group 1 and 11.4 g/dL in group 2. There was no difference in MCV between the 2 groups. The presence of CAA was significantly associated with the presence of anemia after applying the age-appropriate cutoff value, as well as the iron deficiency indicators and IDA. The median serum iron was significantly higher with 20.5 μg/dL in group 1, compared to 10 μg/dL in group 2. Iron saturation was also significantly higher in group 1 with a median value of 9%, compared to the median value of 4% in group 2. In contrast to total iron binding capacity, which revealed no difference between the 2 groups, serum ferritin level was significantly lower in group 2 with a median of 24.1 μg/dL, than in group 1 with a median value of 69.85 μg/dL. The distributions of serum iron, iron saturation, and ferritin were different in group 1 from group 2, as represented in combined box plot and density plot (Fig. 2).
Combined box plot and dot density plot showing distribution of iron deficiency indicators in Kawasaki disease patients with and without coronary artery abnormalities (CAA). Panel A shows distribution of serum iron with/without CAA (P<0.001); median (interquartile range [IQR]) of the CAA (-) group was 21 (12–40); median (IQR) of the CAA (+) group was 10 (8–20). Panel B shows distribution of iron saturation with/without CAA (P<0.001); median (IQR) of the CAA (-) group was 9 (5–19); median (IQR) of the CAA (+) group was 4 (3–7). Panel C shows distribution of ferritin with/without CAA (P<0.001); median (IQR) of the CAA (-) group was 69.9 (47.4–112.4); median (IQR) of the CAA (+) group was 24.1 (19.7–28.5). The Mann-Whitney U test was performed due to nonnormally distributed numerical data.
In regards to the Kobayashi score, there was a tendency of increased neutrophil percentage and CRP in group 2. However, the overall scoring was not significant with a P value of 0.081 (Table 1).
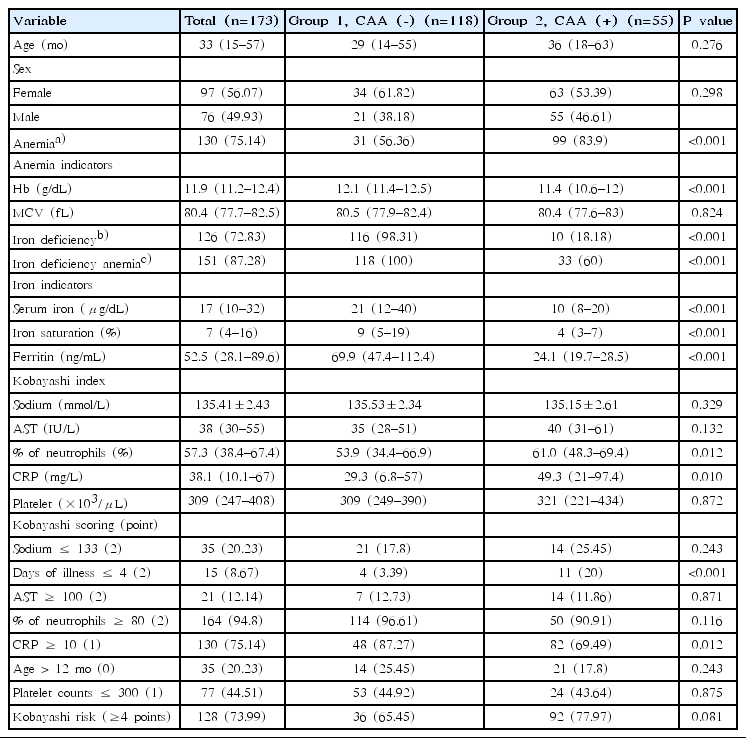
Comparison of demographic characteristics, iron deficiency anemia indicators, and Kobayashi score indices between Kawasaki disease patients with and without coronary artery abnormalities
Table 2 summarizes the results of the multivariate logistic regression analysis of anemia and the relevant IDA indicators for their association with CAA. Among iron deficiency, IDA and anemia, anemia was the only variable which was both clinically and statistically significant. The OR of anemia in model 1 was 3.513, with a 95% CI of 1.634–7.555, while the OR of serum iron was 0.965, with a 95% CI of 0.942–0.989. The OR of anemia in model 2 was 3.171, with a 95% CI of 1.460–6.903, while the OR of iron saturation was 0.914, with a 95% CI of 0.870–0.966. The OR of anemia in model 3 was 2.256, with a 95% CI of 0.878–5.796, while the OR of ferritin was 0.944, with a 95% CI of 0.923–0.965.
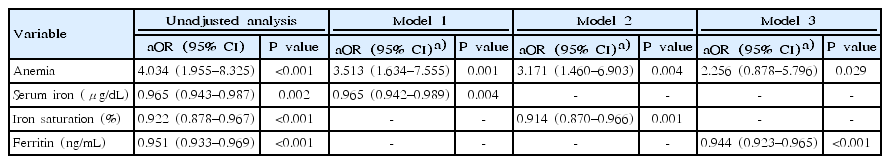
Multivariate analysis of anemia, iron indices for association with coronary artery abnormalities between 3 models
Fig. 3 shows ROC curves of Kobayashi score, anemia, serum iron, iron saturation, and ferritin. The AUC of Kobayashi score, anemia, serum iron, iron saturation, ferritin was 0.563 (95% CI, 0.489–0.636), 0.638 (95% CI, 0.545–0.731), 0.711 (95% CI, 0.629–0.793), 0.729 (95% CI, 0.648–0.810), and 0.907 (95% CI, 0.851–0.963), respectively. The cutoff points of IDA indicators for CAA presence were estimated to be ≤18 for serum iron, ≤6 for iron saturation, and ≤30.6 for ferritin. Among these, ferritin had the most sensitive and specific cutoff point. (Table 3)
Receiver operating characteristic curves of clinical factors for predicting coronary artery abnormalities. The areas under the curve of ferritin concentration, iron saturation, serum iron, anemia, and Kobayashi scores were 0.907 (95% confidence interval [CI], 0.851–0.963), 0.729 (95% CI, 0.648–0.810), 0.711 (95% CI, 0.629–0.793), 0.638 (95% CI, 0.545–0.731), and 0.563 (95% CI, 0.489–0.636), respectively.
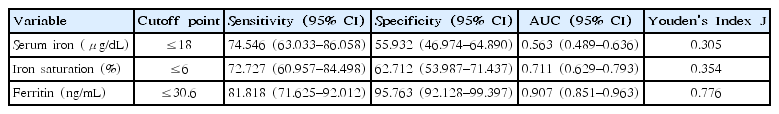
Estimated cutoff points of iron deficiency anemia indicators for coronary artery abnormalities presence by the receiver-operating characteristic curve
Discussion
Normocytic, normochromic anemia is known to be common in KD [2]. IDA’s association with KD has yet to be revealed.
The main purpose of this study was to identify IDA as a predictor of CAA, the most detrimental complication in KD patients. Previous studies discovered the role of iron as necessary for immune cell proliferation [8]. Children with IDA have lower CD4+ lymphocyte levels and CD4:CD8 ratio, which may contribute to the decreased cell-mediated immunity. In acute KD, the inflammatory cells including CD4 and CD8 infiltrate the tissues, which may explain the relationship between KD and immune response to intracellular pathogens. In addition to IDA, impaired cell-mediated immunity may trigger secretion of cytokines and enzymes by the inflammatory cells of the arterial wall, resulting in damage to the vessels, also coronary arteriopathy [6,15].
IDA is the most common type of anemia in pediatric population. The presence of IDA in a child may indicate poor or imbalanced general nutritional support, and if neglected, may lead to development for various conditions and progression of comorbidities in many other diseases. Because of its prevalence in children, IDA has been grossly overlooked as a mere coincidental comorbidity of KD.
Previous studies discovered several predictors associated with poor coronary outcome in KD, such as young age, male sex, and lab abnormalities [2]. Among these, age and sex did not seem to correlate with CAA according to our results. Also, the Kobayashi score, which is known to be less accurate to non-Japanese patients, was not significantly associated with CAA in our patients. On the other hand, anemia, iron deficiency, IDA and its indicators were all significantly associated with CAA.
To exclude the possibility of collinearity, the three indicators of IDA were analyzed independently from each other to anemia for their association with CAA (Table 2). According to the 3 models, anemia increased the risk of CAA by factors of 3.434, 3.218, and 2.663, respectively. The 3 indicators of IDA were negatively associated with CAA, by factors of 0.697, 0.931, and 0.954, respectively (Table 2). Also, the ROC curves showed all three indicators of IDA independently affecting CAA. Ferritin, with an AUC of 0.907 and Youden’s Index of 0.776, seemed to be the strongest independent predictor of CAA. In fact, when compared to the Kobayashi score, the IDA indicators were stronger predictors of CAA, according to our study.
Several limitations arose due to the rather arbitrary definition of IDA in children. The strict definition of IDA, as described in the study design, limited the number of patients with IDA to 22. In turn, multivariate logistic regression analysis yielded significant results for anemia only, but not for IDA and iron deficiency, due to their high collinearity. More sensitive indicators of IDA, including reticulocyte Hb content and serum transferrin receptor, are excellent tools to recognize ID as well as IDA [2]. Their use was limited due to the high cost of commercial assays, and without this limitation, the results could have been more significant.
In conclusion, we found that anemia and several iron indicators that can be utilized in predicting the probability of CAA of KD patients. Although this study does not establish a causal relationship between IDA and CAA, additional future research may explain the pathophysiology of KD related with anemia. If the progression of CAA pauses after the correction of IDA, iron balance could become an essential prophylactic component of KD management. Also, the ongoing controversy over administration of corticosteroids as primary therapy to all children with KD awaits the development of a risk score that identifies high-risk children in a multiracial population [2]. Since IDA and its indicators could be strong predictors of CAA as our study elucidated, further study involving multiracial, multicenter patients may provide valuable insight regarding treatment of KD.
Notes
No potential conflict of interest relevant to this article was reported.