Age-, sex-, and height-based blood pressure reference charts, Yazd children 6–18 years, Iran
Article information
Abstract
Background
Pediatric hypertension is the main cause of morbidity and mortality in pediatric populations.
Purpose
To examine pediatric hypertension in a clinical setting, we used the percentile rank approach and defined hypertension as that above the 95th percentile.
Methods
The present study was linked to the a national analytical cross-sectional community-based Iranian Children and Adolescents’ Psychiatric Disorders (IRCAP) survey. The survey was nationwide and funded by the National Institute of Medical Research Development. The IRCAP survey included 31,000 children and adolescents aged 6–18 years in all 31 Iran provinces. The current study included 1,035 children and adolescents and linked the data of the risk factors of cardiovascular disease only in Yazd province via random cluster sampling.
Results
Of the total participants, 456 (44.1%) were male and 579 (55.9%) were female. The mean age was 11.2±3.8 years (11.7±3.7 years for males, 11.0±3.6 years for females), while mean height was 146±20.0 cm overall, 147.2±22.0 cm for males, and 144.6±17.0 cm for females (P=0.009). The blood pressure distributions and percentiles were evaluated.
Conclusion
Here we determined age- and height-specific 50th, 90th, 95th, and 99th percentiles of systolic and diastolic blood pressures in Yazd boys and girls using 10-cm height intervals.
Key message
Question: What is the 90th, 95th, 99th percentile of blood pressure based on height as the cut point for diagnosis of hypertension in children of our province?
Finding: We used blood pressure of 456 males and 579 females in 6–18 years old in “Iranian Children and Adolescents' Psychiatric Disorders survey.
Meaning: The 90th, 95th, 99th percentiles of systolic and diastolic blood pressure in both sex based on age and 10-cm height intervals were developed in Yazd.
Introduction
Nowadays Pediatric Hypertension has become very common, as in United States and a lot of other countries it is known to be the main reason of morbidity and mortality. The use of tobacco, obesity, and the undertreatment of hypertension is the reason of more than 70% of premature morbidity in the general population. Also, we can trace down a lot of adulthood diseases’ origin back in early stages of childhood [1].
It has been proven that high blood pressure (BP) in adulthood is a result of its negligence in childhood [2-4]. So far, the Fourth Report on the diagnosis, evaluation, and treatment of high BP in children and adolescents has outlined that all the children above 3 years old with medical conditions should have their BP measured [5], nevertheless we see that rarely happens.
Although, scientific evidence insists on the importance of BP elevation in young individuals, still due to lack of data linking specific levels of BP we have difficulties in defining high BP in children and adolescents for a clinical use. To use children with possible cardiovascular outcome in adulthood in a clinical setting and hypertension in childhood, we have used the percentile rank approach and defined the BP elevation above the 95th percentile. Since the BP changes during the process of normal growth through childhood to adolescents, the use of percentile rather the absolute BP is necessary [6].
As BP has been constantly a common distributed feature there is a long history of developing BP percentiles and effort to make it more useful and applicable for primary care physicians. BP percentiles were first published in a report in 1977 [7]. In this report, in a number of epidemiologic studies BP percentiles were presented based on age and sex. However, as the published childhood levels of BP in compare to what would be expected when these children and adolescents become adults, were too high, a great concern was brought up [8].
This led to subsequent task force reports, in which incorporated new data [5]. Moreover, it was found that BP was strongly under the influence of height in addition to age and sex. Among these 3 effective factors height is more applicable and a quite suitable primary reference metric even in comparison with age, it is a precise measure of body size and maturation which are the primary determinants of the natural rise of BP throughout childhood [9,10]. Therefore height percentiles have been included in the determination of BP percentiles.
Unfortunately, in the Middle Eastern countries, especially Iran, we do not have much information about classification of hypertension in children and adolescents so this study aims to provide new normative systolic and diastolic BP charts for Iranian children and adolescents, which now include height percentiles, age, and sex.
Methods
1. Study design
The present study was linked to the national analytical, crosssectional, and community-based survey called “Iranian Children and Adolescents' Psychiatric Disorders (IRCAP).” [11] The survey was countrywide and funded by National Institute of Medical Research Development (NIMAD).
2. Sampling
In this survey included 1,035 children and adolescents aged 6–18 years in Yazd province in 2017 and the data of linked cardiovascular disease risk factors assessment. By multistage random cluster sampling, we analyzed data of Yazd province. In order to do so, according to postal codes, 170 clusters were randomly collected. Six cases from each cluster head were selected. In every cluster, we included both sexes in different age groups (6–9 years, 10–14 years, and 15–18 years). Also, to compare the data in urban and rural areas, in addition to the main city, rural clusters have randomly selected. Forty-eight participants refused to measure BP and in this point attrition rate was about 4 percent. Generally, in this study 987 was stayed.
3. Inclusion criteria
Inclusion criteria for the participants were the following requirements;
(1) To be an Iranian nationality that has residence in Yazd province for at least 1 year.
(2) With age at range of 6 to 18 years old.
4. Exclusion criteria
(1) Children and adolescents with severe physical illnesses
(2) All of refused children.
5. Data collection
At first trained researchers were seek to the doors to describe all about the project and invited the parents to participate their children in the study. After informed consent signed by participants or parents, demographic, socioeconomic, and education information data of children and adolescence and also history of heart disease in their family were collected. The criterion for family history of heart disease was to at least have one first degree relative with a diagnosis of any heart disease. Next step was to invite them and their parents to Afshar hospital for physical examinations, laboratory tests, anthropometrics measurements and psychiatrics interviews.
The process of examinations started with measuring participants’ systolic and diastolic BP. The BP was measured 3 times as below;
(1) 15 to 20 minutes after arrival
(2) After blood sampling
(3) 20 minutes after the second time
BP was measured from the right hand, in a sitting position by an automatic digital BP device (Automatic Blood Pressure Monitor, Model M3 Comfort, Omron Co., Osaka, Japan). All measurements were performed in standard positions and with calibrated tools.
Moreover, experienced nurses measured anthropometric indices including weight, height, body mass index (BMI), and waist circumference. They used a calibrated digital scale to measure weigh of the participants while they were in minimal clothing and also they used a standard wall-height-gauge to measure their height while subjects were standing without shoes and in standard position. Waist circumference was measured using a nonstretchable tape measure at the middle space between the lowest rib and the iliac crest over minimal clothing at the end of exhalation. They also recorded clinical symptoms relating to heart disease including: heart palpitations, shortness of breath, and chest pain in children and adolescents.
6. Statistical analysis
The whole data were analyzed using IBM SPSS Statistics ver. 19.0 (IBM Co., Armonk, NY, USA) and STATA ver. 11 (Stata Corp LP., College Station, TX, USA).
BP in children increases with age and body size [12]. As a result, hypertension in children is defined based on age, sex, and height percentiles. We used percentiles of 5th, 10th, 25th, 50th, 75th, 90th of height and after that we calculated 5th, 10th, 25th, 75th, and 90th in each height percentiles. We used nearest rank methods for percentiles calculation.
In this study according to the fourth report on the diagnosis, evaluation, and treatment of high BP in children and adolescents we calculated 50th, 90th, 95th, and 99th BP percentiles for 7 percentiles of height (5th, 10th, 25th, 50th, 75th, 90th, 95th) in both sex of age rang 6–18 years, This calculations was performed by both Stata 11 (StataCorp LP., College Station, TX, USA) and excel 2010 software. We used mean of 3 measurements of BP for calculation of percentiles. In some age, sex, and height percentiles groups with less than 3 samples, we used 3 measurements of BP absolutely instead of their mean.
According to a little sample in some subgroups so we showed the BP percentile in a 10-cm interval of height subgroup so we can confident more as samples were increased.
7. Ethics statement
The study has been approved by NIMAD’s ethic committee (ethical code: IR.NIMAD.REC.1395.001) and Shahid Sadoughi University of Medical Sciences in Yazd, Iran (IR.SSU.Rec. 1396.49).
Adolescents aged 15 to 18 years participated in this study with their own consent and they have signed the informed consent letter personally but for those who were under the age of 15, parents completed the consent. Independent of age, all children and adolescents were assented to participate. Also, we are obliged to keep all the information about children and adolescents and their families confidential.
Meanwhile, those who were diagnosed with a particular disorder have received professional help free of charge.
Results
The 1,035 participants in age range 6–18 years old were entered in a national survey in Yazd province. The national survey was performed to assess psychiatric disorders in children and adolescence in Iran [11]. In Yazd province we also evaluated the participants according to cardiovascular risk factors. In the participants 456 (44.1%) were men and 579 (55.9%) were female. Mean age was 11.2±3.8 that was in male 11.69±3.7 and in female was 11.03±3.6. Eighty-five percent of them were urban and 15% were from rural.
The mean of BMI was 19.4±5 kg/m2 in total and 19.8±5.4 kg/m2 in male and 19.2±4.5 kg/m2 in female (P=0.05).
The mean of height was 146±20 cm in total and 147.2±22 cm in male and 144.58±17 cm in female (P=0.009).
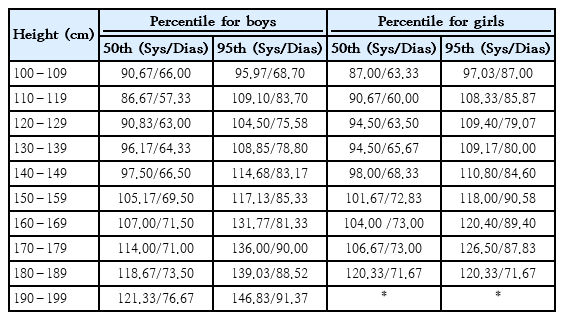
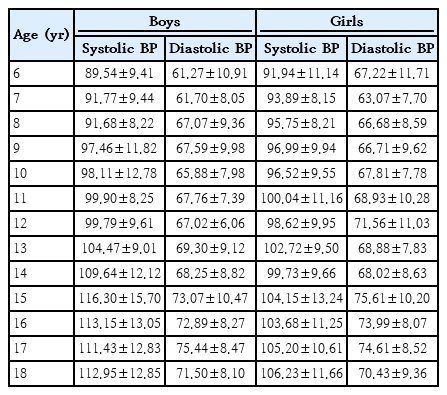
The BP distribution and percentiles were evaluated. Table 1 shows the number of boys and girls based on age groups. Table 2 shows the mean (standard deviation) of systolic and diastolic BP of boys and girls based on age. Table 3 and charts 1–4 shows 50th and 95th percentile of systolic and diastolic BP based on height intervals for boys and girls.

Percentile of systolic (Sys) and diastolic (Dias) blood pressure by height interval for boys and girls
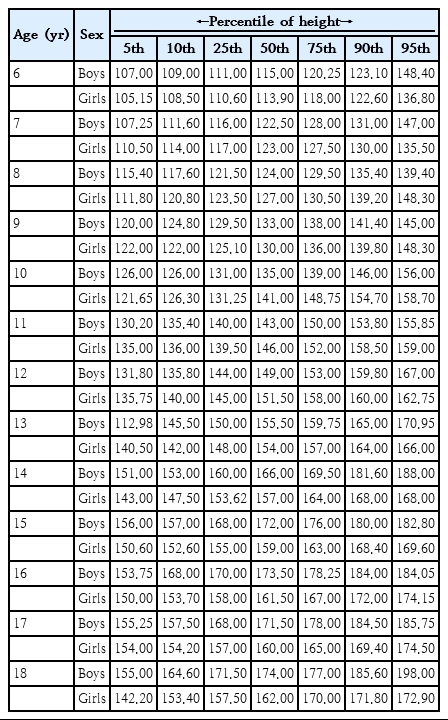
Table 4 shows the age-specific height percentile of 5th, 10th, 25th, 50th, 75th, 90th, 95th, in boys and girls.
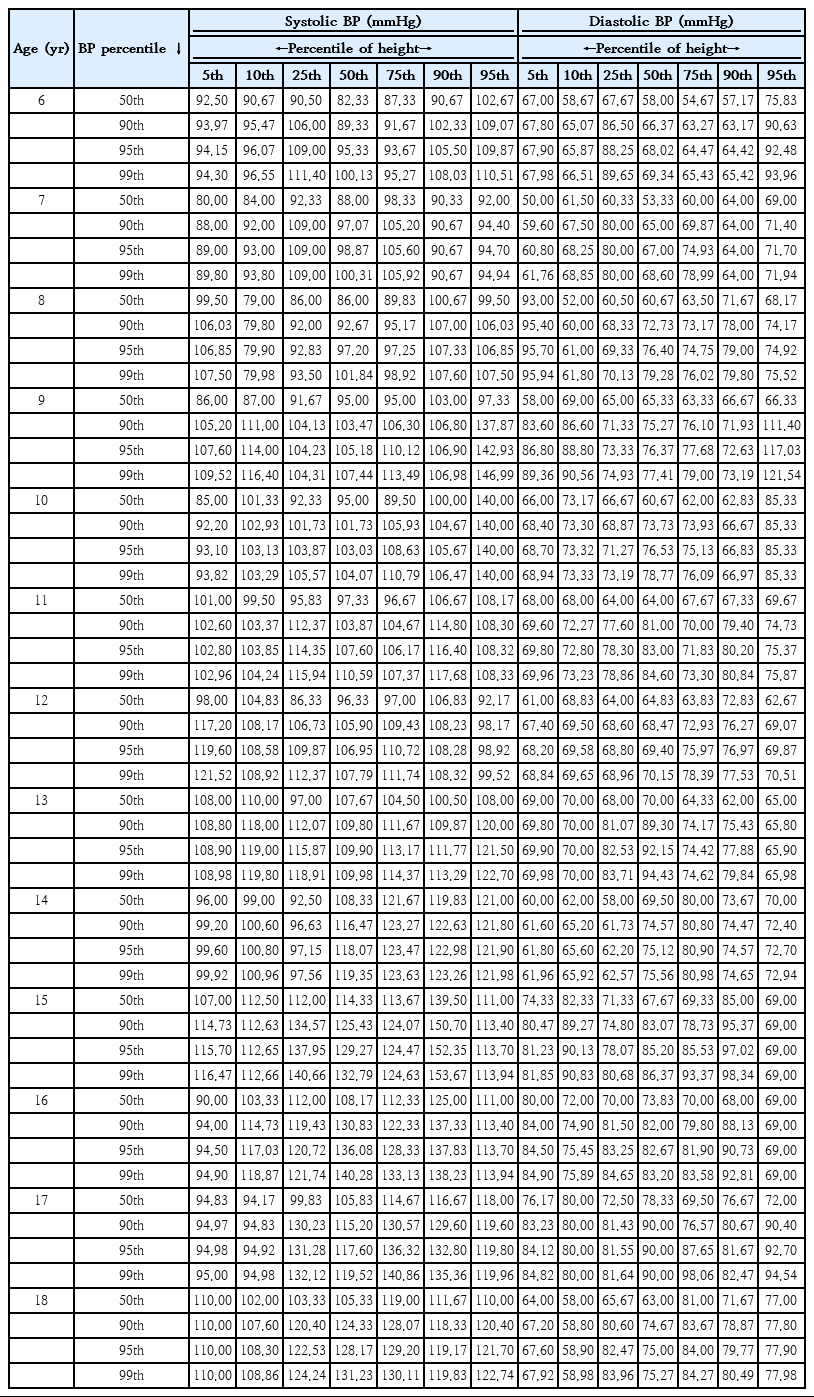
Tables 5 and 6 in supplement issue show the age and height specific 50th, 90th, 95th, 99th percentile of systolic and diastolic BP in boys and girls based on height percentile respectively.
1. Definition of hypertension
Hypertension in adults is defined by the mean of at least 3 measurements of BP greater than 140/80 mmHg that confirmed at least 2 occasions. But in childhood and adolescences definition of hypertension is defined as a percentile cut points. This cut points are correlated to hypertension development in adulthood or end organ damages such as left ventricular hypertrophy and carotid intima-media thickness too [13]. Because there is no study on BP longitudinal study according to cardiovascular outcome development in adulthood, as a result, usage of at or above the 95th percentile of BP instead of absolute BP cut point acceptable approach to defining high BP in childhoods. Definition and classification of hypertension in childhood 6–15 years old based on 4th report on diagnosis, evaluation and treatment of NHBEP (National High Blood Pressure Program working group in children and adolescences) seen in detail:
(1) Pre hypertension: BP at and greater than 90th percentile and less than 95th percentile
(2) Stage I hypertension: BP at and greater than 95th percentile and less than 99th percentile plus 5 mmHg
(3) Stage II hypertension: BP at and greater than 99th percentile plus 5 mmHg
For boys and girls aged 16 or older, the definition of hypertension is on the absolute cutoff used for adults which are based on 4th report of NHBEP as follows:
(1) Pre hypertension: BP at 130–139/85–89
(2) Stage I hypertension: BP at 140–159/90–99
(3) Stage II hypertension: BP at 160–179/100–109
2. Usage of BP percentile charts for hypertension diagnosis
In first step measure the height of children and adolescents and confirm the height percentile category based on age and sex-specific height percentile chart.
In second step determine percentile category of the children and adolescents BPs.
And then classify children and adolescents based on hypertension definition [5].
Discussion
The first study providing percentile charts for BP in 6–18 years old children in Iran is CASPIAN study. CASPIAN studies provide charts for BP only in the age and sex groups and no other variables such as height.
We presented a 3-dimensional BP charts for boys and girls 6–18 years old in Iranian populations for second time in 13 years interval period via CASPIAN study in 2003.
We provided the national cut point of BP for diagnosis of BP abnormalities in Iranian in consideration significant lifestyles changes in childhood during recent years.
We introduced the 50th, 90th, 95th, and 99th BP percentile curves are depicted in the chart for each corresponding age and sex and based on 7 height percentiles of 5th, 10th, 25th, 50th, 75th, 90th, 95th, similar to the Fourth Report on the Diagnosis, Evaluation, and Treatment of High Blood Pressure in Children and Adolescents [14].
On the other hand, we presented a simplified BP charts based on these simplified BP charts based on 10-cm intervals of absolute heights instead of height percentiles so pediatrics providers can use them more familiar and feasible in use. We predict this simplified chart will make physicians to diagnosis of BP abnormality and hypertension in children more accruable estimates. Previous studies confirmed 75% of hypertension cases and 90% of prehypertension cases in childhood ages remain undiagnosed despite BPs measurement by physicians. It's because of difficulties in BP chart usages [14].
Biological mechanisms according to BP increases with age and size of body grows are confirmed. Data were analyzed from the U.S. Health Examination Surrey (cycle II) to show association between BP and other variables. This survey examined a national probability sample of children aged 6–11 years. Chronological and skeletal age, skin fold thickness (adiposity) and other anthropometric measurements, pulse rate, and systolic murmurs were variables that significantly correlated with BP that confirmed BP changes with growth, adiposity, and hemodynamic manifestations of cardiac output [15].
Childhood BMI can predict adult left ventricular mass at adulthood in both sexes and interventricular septal thickness in boys. Childhood waist circumference indexed by height has been associated with left ventricular mass in boys [16].
Lifestyle interventions strategies to reduce accrual of excess adiposity during early life may reduce midchildhood BP, which may also impact adult BP and cardiovascular health [17].
The ratio of BP to height as a new method for the diagnosis of high BP in children and adolescents has used. Based on previous research the BP to height ratios is a useful tool for the diagnosis of high BP in children and adolescents [15]. Studies have shown that the percentile of height is a good and stable predictor of high BP in children [16,17]. Since height is considerably considered changes in BP even more than age and is a direct measurement of body size and maturation in children and adolescents, it is used to determine the BP curves for children and adolescents [18-22].
In comparison of 4th report of hypertension society of European our cut points were lower. It seems that our children body size is smaller than them as studies confirmed it.
IRCAP was the first nationally representative Iranian study providing prevalence estimates of hypertension in children and adolescents. Considering the rates of verified hypertension and prehypertension in asymptomatic children and adolescents, high BP should be considered a common long-term health problem in childhood. Our study is the first study that shows BP percentile charts based on height chart in childhood ages in both sexes. Also, it is the first time we used a BP chart percentile based on 10-cm interval height.
The results may be used in public health context when we decided gender and age prevention priorities. In addition, this BP curve helps us to track child's BP trend longitudinally, classify hypertension according to its stages, screening children and use life style intervention for hypertension prevention in adulthood.
Hypertension occurred early in childhood and was related to obesity and other modifiable lifestyle factors. Clinicians should monitor BP during childhood and provide focused diet and physical activity guidance to minimize the development of hypertension.
In conclusion, IRCAP as the first nationally representative Iranian study providing age-sex-height-based pediatric BP reference charts can be used for prevalence estimates of hypertension in children and adolescents. The results may be used in medical practice for detection and management of BP in children and adolescence. In addition, this BP curve helps us through items below: (1) to track child's BP trend longitudinally, (2) more over hypertension, we can specify the prehypertension and hypertension stages.
Clinicians should monitor BP during childhood and provide focused diet and physical activity as the most modifiable predictors to minimize the development of hypertension.
The first and most notable limitation of our study was that we only took BP from children and adolescents in one occasion and 3 times; and the second limitation was that our sample in this study was relatively low so in some age and sex categories samples was so much low. It is due to low sample size in 95th percentile of height in some age such as group18 so we refer the physician to 10-cm interval BP cut point in. So, they can use the BP based on height percentile table in supplement issue for all other age and sex categories BP percentiles chart.
Notes
No potential conflict of interest relevant to this article was reported.
Acknowledgements
The survey was countrywide and funded by National Institute of Medical Research Development (NIMAD).


