Changes in health status of North Korean children and emerging health challenges of North Korean refugee children
Article information
Abstract
The food shortage in North Korea is a serious situation that has spanned the mid-1990s to today. North Korean refugee children, even those born in North Korea, China, or South Korea, had poor nutritional status at birth; thus, their growth and nutritional status should be continuously monitored. This review focused on the health status of North Korean children and the nutritional status of North Korean refugee children upon settling in South Korea. Immediately after entering South Korea, North Korean refugee children were shorter and lighter than South Korean children and had a serious nutritional status. Over time, their nutrition status improved, but they remained shorter and lighter than South Korean children. A new obesity problem was also observed. Therefore, it is necessary to continuously monitor their growth and nutritional status.
Key message
· Among North Korean refugee (NKR) children under 5 years, 61% and 9.3% were underweight in 1998 and 2017, respectively.
· The immunization rate of NKR children exceeded 90% since 2006.
· For NKR children, protein-energy malnutrition was the #1 cause of death in 2009 versus #17 in 2019.
· In 2020, stunting affected 5.4% and 0.9% and obesity affected 10.7% and 2.7% of NKR versus South Korean children, respectively.
Graphical abstract
Introduction
In the mid-1990s, the nutritional status of the North Korean (NK) population was very serious due to food shortages. The United Nations (UN) reported that the prevalence of acute malnutrition was 32.7%, while the prevalence of chronic malnutrition was as high as 74.1% [1]. These food crises caused numerous NK people to escape from China or other neighboring countries. The total number of NK refugees (NKRs) entering South Korea (SK) reached 33,752 by the end of December 2020 [2]. Among them, 4,799 (14.2%) were children and adolescents aged 0–19 years [3].
In the early 2000s, when the number of NKRs increased rapidly, the mass media released articles about the retarded growth of NKR children, but only a few studies investigated their nutritional status. Moreover, most of the studies were one-off, and the timing and number of samples differed, so a comprehensive assessment of the growth and nutritional status of NKR children is lacking. Therefore, this study summarized the studies conducted to date and assessed how the growth and nutritional status of NKR children have changed.
Health status of NK children
1. Child health
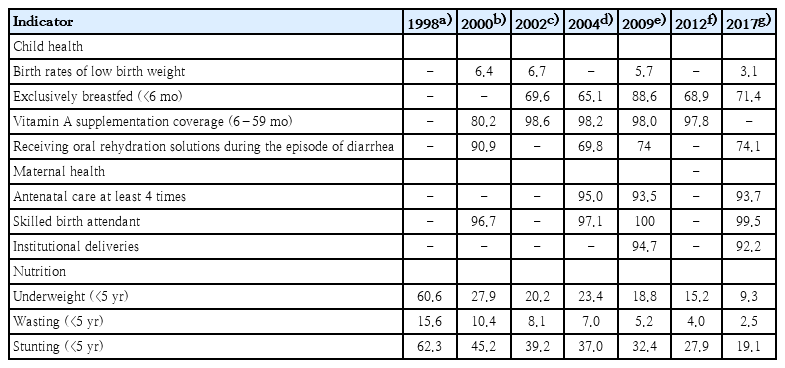
International food aid has been provided since the United Nations Food Shortage Report on NK was published in mid-19990s, and several surveys have assessed maternal and child health to verify the effectiveness of the food aid (Table 1) [4-10]. The birth rates of low birth weight infants were 6.4% in 2000 and 6.7% in 2002 but gradually decreased to 3.1% in 2017. Among children under 6 months of age, the exclusively breastfed rate increased from 69.6% in 2002 to 88.6% in 2009 and then gradually decreased to 71.4% in 2017. The vitamin A supplementation coverage rate in children aged 6–59 months was 80.2% in 2000 and gradually increased to 97.8% in 2012. The percentage of children receiving oral rehydration solutions during an episode of diarrhea was 90.9% in 2000 versus 74.1% in 2017.
2. Maternal health
The proportion of more than 4 antenatal care visits was 95% in 2004 versus 93.7% in 2017. The proportion of skilled birth attendants was 96.7% in 2000 versus 99.5% in 2017. The proportion of childbirths that occurred at the health facility was 94.7% in 2009 versus 92.2% in 2017.
3. Nutrition
Among children under the age of 5 years, the underweight rate was 60.6% in 1998 and then gradually decreased to 18.8% in 2009 and 9.3% in 2017. Similarly, the rates of wasting and stunting decreased from 15.6% and 62.3% in 1998 to 2.5% and 19.1% in 2017, respectively.
4. Immunization
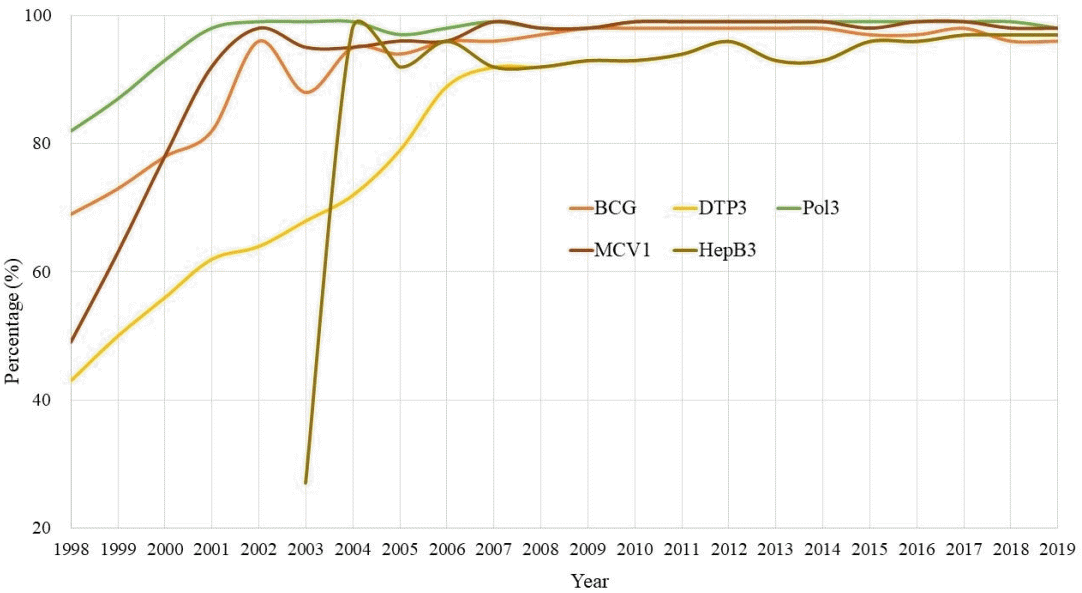
Fig. 1 shows the immunization rates of NK children from 1998 to 2019 [11]. The Bacillus Calmette-Guérin vaccine immunization coverage rate was 69% in 1998 versus 96% in 2002. It decreased to 88% in 2003 and then continued to fluctuate gradually, reaching 96% in 2019. The DTP3 (third dose of diphtheria and tetanus toxoids and pertussis-containing vaccine) immunization coverage rate was as low as 43% in 1998 but has continued to increase since then, reaching 97% in 2019. The Pol3 (third dose of polio vaccine) immunization coverage rate was 82% in 1998, increased to 99% in 2002, and was 98% in 2019.

Immunization coverage rate in North Korean children, 1998 and 2019. BCG, Bacillus Calmette-Gué rin vaccine; DTP3, three doses of diphtheria, tetanus toxoid, and pertussis; Pol3, three doses of oral polio vaccine; MCV1, first dose of measlescontaining vaccine; HepB3, three-dose hepatitis B vaccine.
The MCV1 (first dose of measles-containing vaccine) immunization coverage rate was 49% in 1998 and increased rapidly to 98% in 2002, and then gradually fluctuated, reaching 98% in 2019. The coverage rate of the HepB3 (three-dose hepatitis B vaccine) was very low at 27% in 2003, increased sharply to 98% in 2004, and remained at 97% in 2019.
5. Leading cause of death in NK children
The changes in the leading cause of death in children with NK between 2000 and 2019 using data from the Institute for Health Metrics and Evaluation [12] are shown in Fig. 2. Among children under 5 years of age, protein-energy malnutrition was the most common cause of death in 2000 but sharply decreased in 2019, while the rates of measles and whooping cough decreased similarly in 2019. However, the rates of lower respiratory infections and diarrheal diseases were higher in 2019. In addition, the rates of injuries, such as drowning, foreign bodies, and road injuries, increased in 2019 compared to 2000.

Top 10 causes of death in North Korean children in 2000 versus 2019. (A) 0–4 years. (B) 5–14 years. Orange circle: communicable, maternal, neonatal, and nutritional disease; blue circle: noncommunicable diseases; green circle: injuries.
In children aged 5–14 years, the most common cause of death in 2000 was protein-energy malnutrition, which decreased sharply in 2019, similar to what was noted in children under 5 years of age. The same infectious diseases, measles and meningitis, also declined in 2019, whereas lower respiratory infections maintained a similar ranking in 2019. The rates of injuries (drowning, road injury, interpersonal violence, and falls) and noncommunicable diseases (leukemia, congenital defects, brain cancer, and other malignant neoplasms) increased in 2019.
Health challenges of NKR children
1. Background of NKR children
The backgrounds of NKR children can be divided into several categories [13]: those who were born in NK but have moved to SK; those who were born in a third country such as China after one of their parents left NK and subsequently entered SK; and those who were born in SK after a parent settled in SK. The Ministry of Unification data includes only children born in NK. In fact, it is estimated that there are more NKR children living in South Korea than reported. These children are highly likely to have poor nutritional status at birth and have a low socioeconomic status (SES), even after settling in SK [14]; therefore, their nutritional status must be regularly monitored.
2. Growth status between NK and SK children
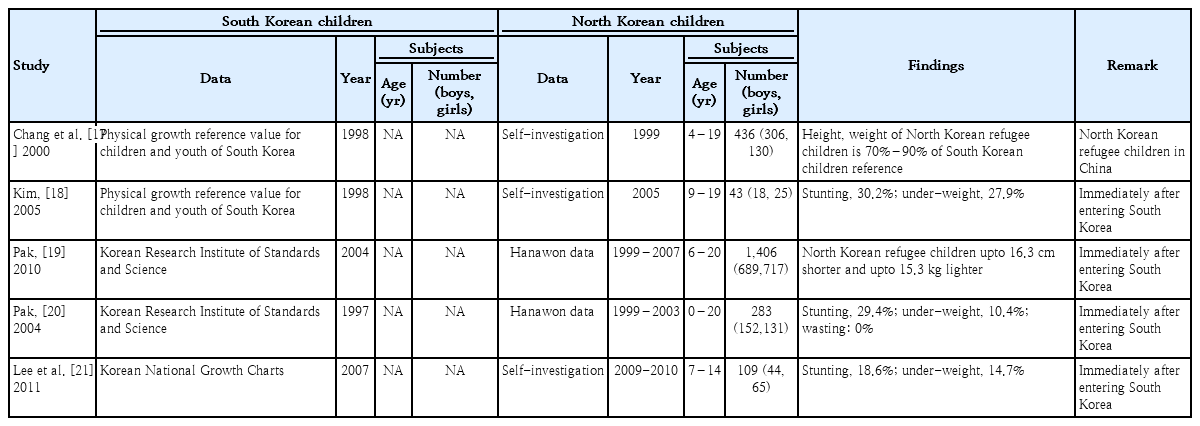
After the NK famine of the mid-1990s, researchers have aimed to determine the growth and nutritional status of NK children using UN survey data (Table 2). In a study comparing the height and weight, NK children were 6–7 cm shorter and about 3 kg lighter than SK children [15]. In another study, NK children were up to 13 cm shorter and up to 7 kg lighter than SK children (Table 3) [16].
3. Growth and nutrition status after defecting from NK
As the food shortage persisted and many NK citizens began escaping the country, investigators became concerned about the growth and nutritional status of NKR children (Table 4). NKRs generally stay in third countries (mainly China) for months to years before entering SK. One study assessed the growth status of NKR children residing in China [17]. The heights and weights of 436 NKRs aged 4–19 years old were measured, and their growth statuses were only 70%–90% of those of SK children.
4. Growth and nutrition status immediately after SK entry
Immediately after entering SK, NKRs undergo a medical examination at Hanawon. Some studies have evaluated the growth status of NKR children using Hanawon health data (Table 4). Of them, 30.2% were shorter than the 3rd percentile of the SK standard, while 27.9% weighed less than the 3rd percentile of the SK standard [18]. Similarly, another study using the Hanawon data of NKRs aged 6–20 years who entered SK in 1999–2007 reported that they were up to 16.3 cm shorter and up to 15.3 kg lighter than SK children [19]. Several other studies evaluated nutritional status using Hanawon health data. Among 283 NKRs younger than 18 years, the prevalence of stunting was 29.4%, that of underweight was 10.4%, and that of wasting was 0% [20]. Another similar study reported that, among 109 NKRs aged 7–14 years, 18.6% were stunted and 14.7% were underweight [21].
5. Nutritional status after settling in SK
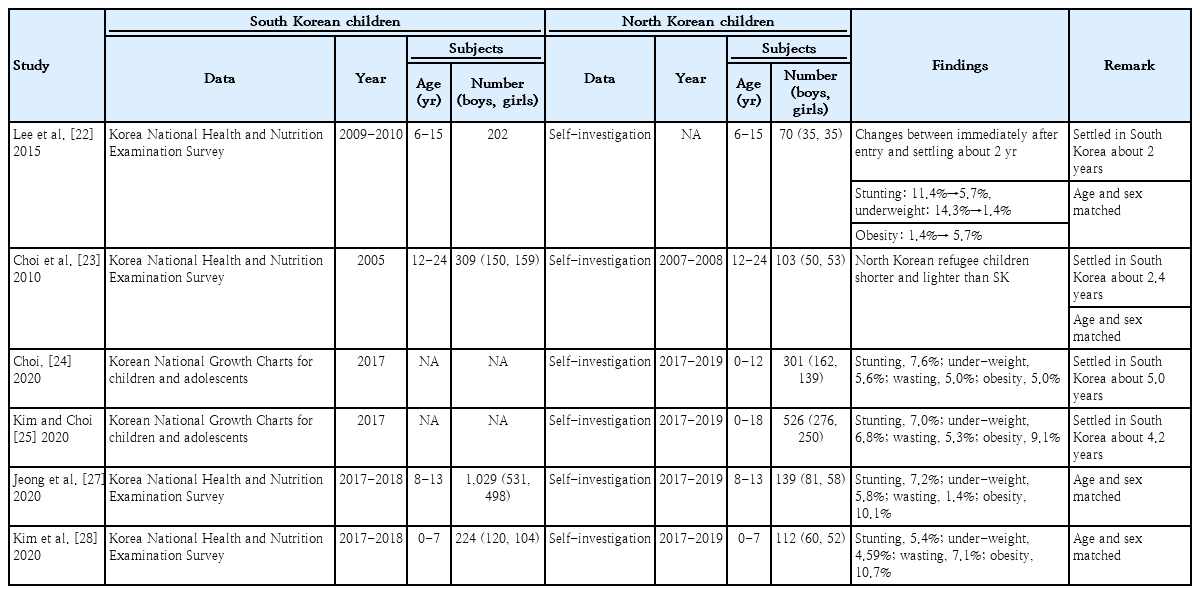
Once NKRs settled in SK, researchers investigated whether the nutritional status of the children had improved (Table 5). In one study, the researchers investigated 70 NKR children who had settled in SK [22]. They reported that the children’s nutritional status improved from 11.4% to 5.7% for stunting and 14.3% to 1.4% for underweight by approximately 2 years after settling in SK. However, compared with sex- and age-matched SK individuals, NKR children were still significantly shorter and leaner than SK subjects [23]. In a study of 301 NKR children, the authors reported that the prevalence of stunting, underweight, and wasting was 7.6%, 5.6%, and 5.0%, respectively [24]. Another study of 526 NKRs under 18 years who had lived in SK for approximately 4 years showed improved nutritional status, with the prevalence of stunting, underweight, and wasting of 7.0%, 6.8%, and 5.3%, respectively [25]. The authors demonstrated that, despite this improvement, the nutritional status of NKR children remained serious, given that the subjects included children born in SK as well as children born in NK or third countries. In addition, comparison of the nutritional status of children born in the mid- to late 1990s and children born after 2000 revealed that the prevalence of stunting, underweight, and wasting among individuals born in the mid- to the late 1990s was higher than those born in NK after 2000. In the mid- to late 1990s, the food situation in North Korea was at its worst, and people born during this period are now entering adulthood, so their health status in adulthood should be carefully monitored. It is important to verify the thrifty phenotype hypothesis, which is the associations between poor nutrition in early life and the subsequent development of type 2 diabetes and the metabolic syndrome, by monitoring the incidence of chronic diseases in this population.
6. Emerging obesity
Shortly after NKRs enter SK, malnutrition remains a major health problem [21]. However, the prevalence of obesity increases in this population over time (Table 6). NKR children now face the “double burden” of both under- and overnutrition [25]. In a study using Hanawon data for NKRs, none of the children had a weight higher than the 97th percentile [21]. Moreover, using Hanawon data, another study reported that the prevalence of obesity was 1.4% at the time of SK entry but increased to 5.7% after approximately 2 years [22]. Approximately 4.2 years after NK children settled in SK, the prevalence of obesity had increased to 9.1% [25].
7. Impact of SES
The association between SES and the health and nutritional status of children is well known [26]. Researchers recently evaluated whether this relationship is consistent with NKRs. In a study of 139 NKRs and 1,029 SK children aged 8–13, when SK children were classified into 4 SES groups (highest, moderate-high, moderate-low, and lowest) according to monthly household income, the prevalence of stunting and underweight of NKR children was significantly higher than that of SK children with the lowest SES [27]. Similarly, in a study of 112 NKR and 224 sex- and age-matched SK preschool children, the prevalence of stunting and obesity in NKR children was significantly higher than that of SK children with a low SES [28].
Future points to consider
To date, various studies have aimed to determine the growth and nutritional status of NKR children, and several points are worth future consideration. First, it was a cross-sectional study with a small sample size. It is necessary to establish an NKR children cohort that includes a sufficient number to represent NKR children and periodically measure their growth and nutritional status to assess changes in nutritional status. Second, previous studies measured and reported nutrition and growth status on a one-off basis. However, there is a need for an intervention program to improve the nutritional status of NKR children. In particular, obesity rates increase rapidly over time after settling; therefore, nutrition education is urgently needed for NKR children and their parents and caregivers. Third, good maternal nutrition is the best kickstart for life. However, there is still no research on the health of NKR women. Therefore, it is necessary to develop intervention programs to improve the health and nutritional status of NKR women of childbearing age.
Conclusions
The nutritional status of children who defected due to the NK food shortage was very serious. The rates of severe malnutrition in these children improved over time after SK entry, but they remained short and light compared to SK children. In addition, the number of obese children began to increase over time.
Notes
Conflicts of interest
No potential conflict of interest relevant to this article was reported.


