Nonalcoholic fatty liver disease and insulin resistance in children
Article information
Abstract
Nonalcoholic fatty liver disease (NAFLD), a spectrum of liver diseases characterized by excessive fat accumulation, is the leading cause of chronic liver disease. The global prevalence of NAFLD is increasing in both adults and children. In Korea, the prevalence of pediatric NAFLD increased from 8.2% in 2009 to 12.1% in 2018 according to a national surveillance study. For early screening of pediatric NAFLD, laboratory tests including aspartate aminotransferase and alanine aminotransferase; biomarkers including hepatic steatosis index, triglyceride glucose index, and fibrosis-4 index; and imaging studies including ultrasonography and magnetic resonance imaging are required. Insulin resistance plays a major role in the pathogenesis of NAFLD, which promotes insulin resistance. Thus, the association between NAFLD and insulin resistance, diabetes mellitus, and metabolic syndrome has been reported in many studies. This review addresses issues related to the epidemiology and investigation of NAFLD as well as the association between NAFLD and insulin resistance and metabolic syndrome with focus on pediatric NAFLD.
Key message
· The prevalence of pediatric nonalcoholic fatty liver disease (NAFLD) increased from 8.2% in 2009 to 12.1% in 2018 in Korea.
· Laboratory tests, biomarkers, and imaging studies are used for the early detection of NAFLD.
· Insulin resistance is closely related to NAFLD.
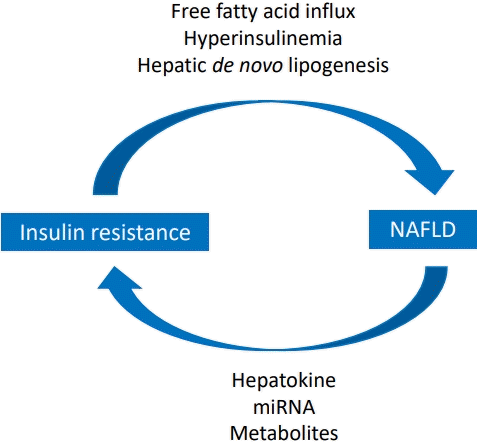
Graphical abstract. Relationship between insulin resistance and nonalcoholic fatty liver disease (NAFLD).
Introduction
Nonalcoholic fatty liver disease (NAFLD) is an entire spectrum of liver disease induced by excessive fat accumulation in the liver, including simple steatosis, nonalcoholic steatohepatitis, and advanced fibrosis and cirrhosis in patients without known causes, including significant alcohol consumption [1,2]. NAFLD, one of the major causes of end-stage liver disease, is associated with cardiovascular risk factors, including insulin resistance and dyslipidemia [3]. Thus, NAFLD is related to all-cause mortality, including liver-related death, cardiovascular disease, and diabetes mellitus [4]. Moreover, NAFLD is the leading cause of chronic liver disease, and its prevalence is increasing globally [5].
Since Ludwig et al. [6] defined nonalcoholic steatohepatitis in 1980 as liver tissue injury similar to alcoholic hepatitis among patients who did not drink alcohol, there have been numerous investigations into NAFLD. In particular, many recent studies considered NAFLD a multisystem disease focusing on the association between NAFLD and insulin resistance [4,7-9]. Furthermore, renaming NAFLD as metabolic-associated fatty liver disease (MAFLD) has been suggested based on the evidence of no safe limitation for alcohol use in cases of fatty liver [10].
However, there are limited publications in the current literature regarding the relationship between NAFLD and insulin resistance in children. This review discussed the epidemiology and investigation of NAFLD and the association between NAFLD and insulin resistance with a primary focus on pediatric NAFLD.
Epidemiology
A meta-analysis reported that the global prevalence of NALFD increased from 21.9% in 1991 to 37.3% in 2019, while the adverse trend was more prominent in South America and Europe [11]. In the United States, the prevalence of NAFLD was 24% in a meta-analysis [12]. In Korea, the prevalence of NAFLD was 31% among men and 22% among women [13]. During the coronavirus disease 2019 (COVID-19) outbreak, the proportion of newly diagnosed NAFLD cases was 25% among adults in a health checkup program in a Japanese study [14]. A Canadian study reported that the prevalence of MAFLD was 55.3% among participants with post-acute COVID-19 syndrome [15].
Among children and adolescents, the global prevalence of NAFLD increased from 19.3 million in 1990 to 29.5 million in 2017, being higher in developed than developing regions [16]. In another global study, the prevalence of NAFLD was 7.6% among all youth and 34.2% among youth with obesity [17]. In the US, the NAFLD prevalence among all youth increased from 3.9% in 1988–1994 to 10.7% in 2007–2010 [18]. In China, the NAFLD prevalence was 9.0% in 2009 among all youth [19]. In Korea, the prevalence of pediatric NAFLD, defined as an alanine aminotransferase (ALT) elevation without hepatitis B virus or hepatitis C virus infection, increased from 8.2% in 2009 to 12.1% in 2018 in a national surveillance study [1]. Moreover, the adverse trend was more prominent among youth, even young children, with a normal body mass index (BMI). In another Korean populationbased study, the prevalence of NAFLD was 14.7% in boys and 6.5% in girls [20]. In a study of the Korean health checkup program performed in Seoul, the prevalence of NAFLD diagnosed on ultrasonography was 11.2% among youth [21]. Further studies are required to clarify changes in the prevalence of pediatric NAFLD during the COVID-19 outbreak.
Investigation
Early screening for NAFLD is important for preventing severe complications because NAFLD is usually asymptomatic and reversible in the early stages with proper management [21]. Although liver biopsy is the gold standard for the diagnosis of NAFLD, it is very invasive [3,22]. Moreover, its results cannot represent the entire liver because the sample is limited to a small part of the liver. Thus, laboratory tests and imaging studies are required for the early detection of pediatric NAFLD [20,21,23].
1. Laboratory tests
ALT level has acceptable sensitivity for detecting NAFLD, although it is not correlated with the histologic grade of NAFLD [3,24,25]. Moreover, some children with NAFLD have normal ALT and ALT levels, which can be elevated in other liver diseases [3,26]. Meanwhile, aspartate aminotransferase (AST) level is correlated with hepatic fibrosis progression, although it has not been suggested as an independent screening tool for NAFLD in children [3,24,25].
The North American Society of Pediatric Gastroenterology, Hepatology, and Nutrition guidelines recommend ALT as a screening test due to its minimal invasiveness and adequate sensitivity [3]. The guidelines suggest NAFLD screening for obese children aged 9–11 years and overweight children with risk factors such as central obesity, insulin resistance, dyslipidemia, sleep apnea, and/or family history of NAFLD. Further evaluations for NAFLD are suggested in children with ALT levels higher than the upper limit value for longer than 3 months, suggested as 26 U/L for boys and 22 U/L for girls based on the National Health and Nutrition Examination Survey [27]. A Canadian study suggested the upper limit of ALT as 30 mg/dL in children 1–12 years old and 24 mg/dL in those aged 13–19 years [28]. In Korea, the 95th percentile value for ALT level was suggested as 24.1 U/L for boys and 17.7 U/L for girls in a population-based study [29]. Another Korean study suggested an upper limit of ALT of 39 U/L for boys and 31 U/L for girls and those of AST as 39 U/L for boys and 41 U/L for girls aged 2–7 years and 34 U/L for girls aged 8–14 years [30].
2. Biomarkers
To overcome the limitations of liver biopsy and laboratory tests, various parameters such as the hepatic steatosis index (HSI) and fatty liver index, derived from AST, ALT, and/or platelets, have been suggested to predict hepatic steatosis and fibrosis in adults [31,32]. In addition, the triglyceride glucose (TyG) index, a parameter derived as the product of fasting triglyceride and glucose levels, has been suggested to be a robust predictive marker for NAFLD based on the relationship between NAFLD and dyslipidemia and IR [33]. However, investigations on the usefulness of these parameters in children and adolescents are limited.
A pediatric study showed a positive association between HSI and the presence of hepatic steatosis [34]. A population-based study reported that modified TyG indices, which combined the TyG index and obesity-related parameters, were superior to the TyG index for predicting pediatric NAFLD [20]. A cohort study reported that HSI was superior to the TyG index for NAFLD predictions in children [35]. Song et al. [21] suggested the AST-to-platelet ratio index (APRI), fibrosis-4 index, and HSI as predictive markers of pediatric NAFLD. In addition, this study reported that the modified APRI, which combined APRI and obesityrelated parameters, such as BMI and waist circumference, were superior to other parameters. For predicting hepatic fibrosis, the area under the curve of receiver operating characteristic curve values was 0.741 for APRI, 0.71 for NAFLD fibrosis score, and 0.546 for pediatric NAFLD fibrosis index in a retrospective study [36]. Formulas of biomarkers for pediatric NAFLD and fibrosis are shown in Table 1.
3. Imaging studies
Ultrasonography is an easily accessible imaging modality without radiation exposure that can exclude other hepatic pathologies and assess hepatic fatty infiltration grade based on degree of echogenicity [3,23]. Hepatic steatosis shows high echogenicity because more echoes return to the ultrasound transducer due to disturbed propagation and attenuation of the sound wave by lipid droplets in hepatocytes [37]. The normal liver shows a homogenous echo texture similar to that of the renal cortex. A mildly fatty liver shows diffuse increased echogenicity versus the renal cortex, while a moderately fatty liver shows obscured vessel walls due to increased liver echogenicity. In a severely fatty liver, the diaphragm is not visible owing to acoustic attenuation. However, ultrasound is physician- and device-dependent and cannot be used for a quantitative analysis. Moreover, its accuracy is limited due to its low sensitivity and specificity [3].
Based on evidence of increased attenuation of the ultrasound beam in the fatty liver, the controlled attenuation parameter (CAP) is suggested as an imaging modality for the quantification of fat deposition in the liver [23,38]. The CAP estimates the decreased amplitude of ultrasound as it is amplified through the liver tissue [37]. In addition, the liver stiffness measurement (LSM) represents a measure of the shear wave velocity generated by a push pulse as it passes [39]. CAP and LSM can be obtained by a FibroScan (Echosens, Paris, France), an ultrasound-based vibration-controlled transient elastography device, to estimate liver stiffness [40]. In a pediatric study, 95th percentile values of CAP and LSM were 214.53 dB/m and 4.78 kPa, respectively [40]. However, the clinical application of CAP is limited due to significant measurement failure and an unavailability of anatomic imaging [23,38]. The LSM can be altered by several factors such as venous pressure, inflammation, amyloid deposition, and cholestasis [39].
To overcome the limitations of CAP, attenuation imaging (ATI) has recently been suggested to quantify liver fat using realtime ultrasound. ATI estimates the degree of ultrasound beam attenuation with depth using a rudimentary echo decay profile after removing the systemic effects of ultrasound [41]. Operators can easily measure ATI values during grayscale ultrasound by automatically removing vessels and artifacts. ATI is highly correlated with magnetic resonance imaging (MRI) proton density fat fraction (PDFF) and shows outstanding performance for the detection of fatty liver in adults [42,43]. In a pediatric study, ATI was useful for distinguishing fatty from normal liver and moderate to severe from mild fatty liver [23]. In this study, the median ATI values for normal, mild fatty, and moderate to severe fatty liver were 0.54, 0.63, and 0.73 dB/cm/MHz, respectively. The cutoff ATI value was 0.69 dB/cm/MHz for differentiating moderate to severe fatty liver from mild fatty liver.
MRI measures PDFF, the ratio of proton density in fatty liver and that in the whole liver, based on chemical shift imaging [41]. Magnetic resonance signals are attenuated or combined by the resonance frequency of fat and water molecules and different phases. Signals of fat and water are combined and the total signal intensity is higher on the in-phase echo time, while water and fat signals cancel each other out and the total signal intensity is reduced in the out-of-phase echo time. Thus, the normal liver does not show a difference in signal intensities between the inphase and out-of-phase images, whereas the signal intensity is reduced on the out-of-phase image in hepatic steatosis. Tang et al. [44] reported that MRI-PDFF was significantly correlated with histologic steatosis grade, while the area under the receiver operating characteristic curve was 0.989 for distinguishing participants with healthy liver from those with hepatic steatosis among patients with NAFLD, including children.
Magnetic resonance elastography (MRE) can be used to quantify hepatic fibrosis and cirrhosis. MRE estimates liver stiffness and fibrosis and distinguishes steatohepatitis from simple steatosis [37,38]. Yin et al. [45] reported that the sensitivity and specificity of MRE for the detection of hepatic fibrosis were 98% and 99%, respectively, using a cutoff value of 2.93 kPa. A prospective study reported that the mean liver stiffness was 2.45 kPa among children and adolescents, higher than that in adults (2.1 kPa) [46]. In this study, the 95th percentile of normal liver stiffness was 3.11–3.28 kPa in children and 2.70–3.35 kPa in adolescents. Another prospective study reported that the mean liver stiffness was 2.1 kPa among children with normal liver, while the 95th percentile of normal liver stiffness was 2.8 kPa [47].
Association between NAFLD, insulin resistance, and metabolic syndrome
1. Influence of insulin resistance on NAFLD
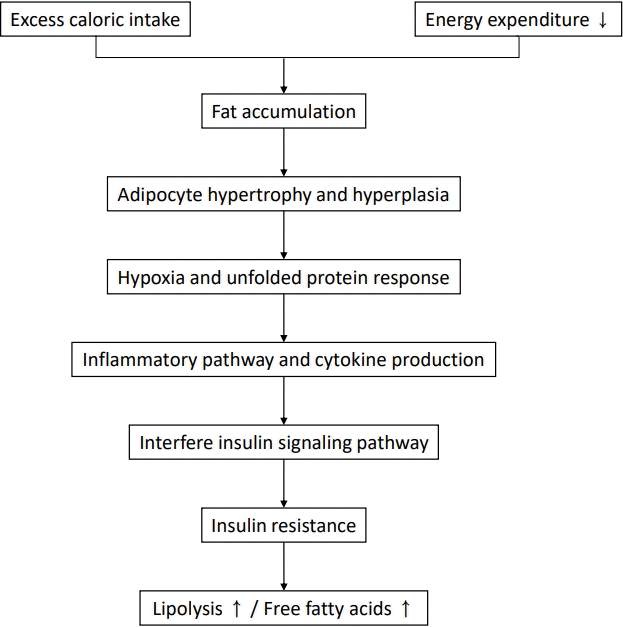
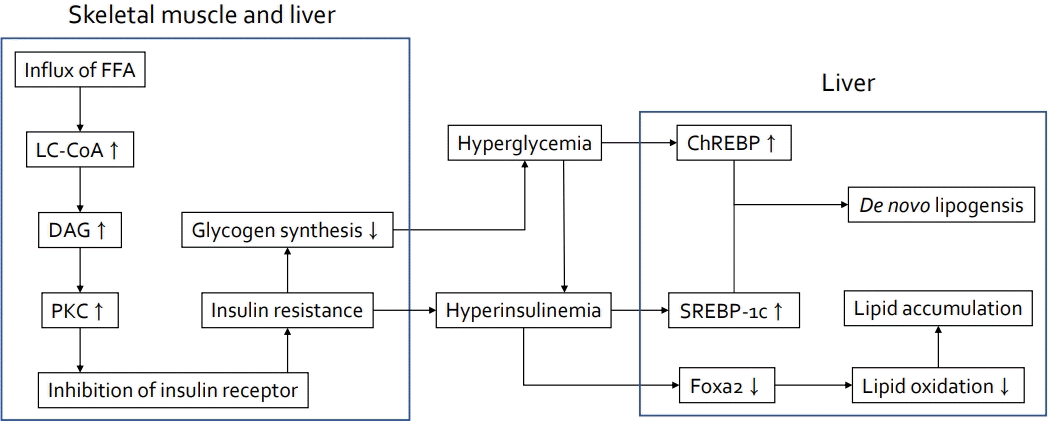
Insulin resistance plays a major role in the pathogenesis of NAFLD, and ectopic fat accumulation plays a key role in insulin resistance [9,48]. Insulin downregulates gluconeogenesis by promoting glycogen synthesis in the liver and muscle and inhibiting lipolysis in adipose tissue [4,48,49]. Fat accumulation due to excess caloric intake and decreased physical activity induces adipocyte hypertrophy and dysfunction as well as insulin resistance, thereby increasing lipolysis and free fatty acid levels (Fig. 1) [48,50]. Free fatty acids taken up by the cell via fatty acid transport protein increases long-chain acyl-CoA and diacylglycerol, which induces insulin resistance by inhibiting insulin receptor function via activating protein kinase C in the liver and skeletal muscles (Fig. 2) [48]. In the skeletal muscle, decreased glycogen synthesis due to insulin resistance induces hyperglycemia and postprandial hyperinsulinemia, which induce hepatic de novo lipogenesis, hypertriglyceridemia, increased very low-density lipoprotein (VLDL) production, and decreased plasma high-density lipoprotein (HDL) cholesterol [51]. In the liver, hyperinsulinemia promotes the activation of sterol regulatory element-binding protein 1 (SREBP1) and hyperglycemia and activates carbohydrate response element-binding protein (ChREBP) [51,52]. SREBP1 and ChREBP promote de novo lipogenesis, lipid production from carbohydrate in the liver. Although de novo lipogenesis is not the main source of lipids, it can be a main factor for lipid supply in people with obesity and hyperinsulinemia [4]. Moreover, hyperinsulinemia promotes lipid accumulation by inactivating Forkhead box protein A2, a transcription factor promoting lipid oxidation in the liver [52]. The paradox in the pathogenesis of NAFLD wherein insulin fails to suppress glucose production while continuing lipogenesis in the liver can be explained by selective insulin resistance, which indicates different actions of insulin between glycogen synthesis and lipogenesis [51,53].

Insulin resistance in adipocytes. Fat accumulation due to excess caloric intake and decreased physical activity induces hypertrophy and dysfunction of adipocytes, which induces adipocyte hypoxia and an unfolded protein response. This response is followed by the inflammatory pathway and cytokine production, which interfere with the insulin signaling pathway. Finally, insulin resistance increases lipolysis and free fatty acids.

Insulin resistance in skeletal muscles and liver. In skeletal muscle and liver, influx of FFA increases LC-CoA and DAG, which induces insulin resistance by inhibiting the function of insulin receptors via activation of PKC. Insulin resistance induces hyperglycemia via hyperinsulinemia and decreases glycogen synthesis. De novo lipogenesis is induced by ChREBP activation and SREBP-1c in the liver. In addition, hyperinsulinemia promotes lipid accumulation by inactivating Forkhead box protein A2, a transcription factor that promotes lipid oxidation in the liver. FFA, free fatty acids; LC-CoA, long-chain acyl-CoA; DAG, diacylglycerol; PKC, protein kinase C; ChREBP, carbohydrate response element-binding protein; SREBP- 1c, sterol regulatory element-binding protein 1c; Foxa2, Forkhead box protein A2.
In summary, insulin resistance promotes lipolysis in adipose tissue, which increases the influx of free fatty acids into the skeletal muscle and liver [48,50,51]. In the muscle cells, insulin resistance inhibits glycogen synthesis, which increases glucose influx into the liver. Finally, hyperinsulinemia and increased de novo lipogenesis accelerate lipid accumulation in the liver [4].
2. Influence of NAFLD on insulin resistance
1) Hepatokines in NAFLD
Hepatocytes secrete various hepatokines, protein signals involved in lipid metabolism and insulin sensitivity [54]. In adipose and skeletal muscles, many hepatokines influence the pathways involved in lipolysis, lipogenesis, inflammation, and fatty acid oxidation. Some hepatokines independently affect insulin secretion from the pancreas and glucose uptake by the peripheral tissues. Hepatokine secretion is altered in fatty livers, which affects fatty acid metabolism and induces insulin resistance and inflammation in other tissues. For example, Fetuin A retinol binding protein 4 suppress insulin signaling by inducing phosphorylation of cJun-N-terminal-kinase and insulin receptor substrate 1 [54,55]. In addition, Fetuin A circulating selenoprotein P reduces insulin sensitivity by inhibiting insulin receptors [54,56].
2) Micro RNAs in NAFLD
Micro RNAs (miRNAs) are noncoding RNAs that inhibit the translation and induce mRNA degradation in lysosomes by binding to the 3′ untranslated region of messenger RNAs [57]. Specific miRNAs control metabolic functions, including insulin sensitivity in the liver, skeletal muscle, and adipose tissue and insulin secretion in the pancreas [54,58]. In NAFLD, an increase in neutral sphingomyelinase 2 activity and ceramide accumulation promotes miRNA secretion, thus altering lipid transport and insulin signaling [59,60].
3) Metabolites in NAFLD
Liver-derived major metabolite classes including lipoproteins and acyl-carnitines transduce specific metabolic signals, which are altered in NAFLD [54]. VLDL secretion, which transports triglycerides and cholesterol to the peripheral tissues, is promoted in NAFLD, which induces insulin resistance by decreasing glucose transporter 4 insertion in the membrane and cholesterol accumulation in the skeletal muscle [61,62]. Moreover, increased VLDL secretion is associated with inflammation such as tumor necrosis factor-alpha production, which further accelerates hepatic VLDL secretion and insulin resistance [63-65]. In fatty liver, plasma acylcarnitines are increased and accumulate in the muscle, which promotes insulin resistance in the skeletal muscle due to mitochondrial stress and reactive oxygen production [66-68].
Association of NAFLD with diabetes mellitus and metabolic syndrome
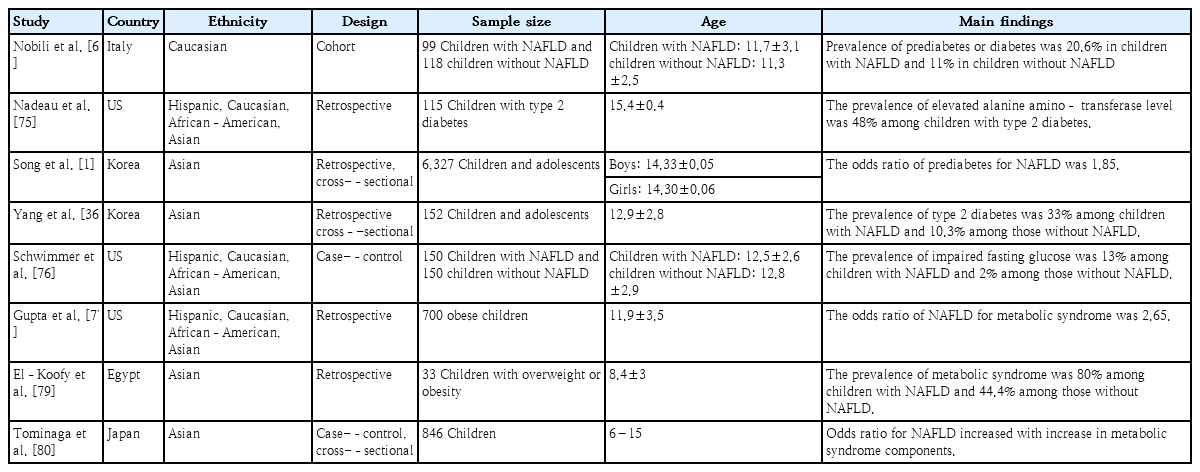
NAFLD is associated with a higher prevalence of diabetes and cardiovascular diseases, and diabetes is a risk factor for the development of liver fibrosis and cirrhosis [69-71]. The association of NAFLD with metabolic syndrome and insulin resistance has been reported in many studies (Table 2). In a global meta-analysis, the prevalence of NAFLD among patients with type 2 diabetes was 55.5%, more than 2-fold higher than that in the general population [72]. Another meta-analysis reported that NAFLD was related to a 2-fold incidence in metabolic syndrome and type 2 diabetes [73]. D'Adamo et al. [74] reported that youth with obesity and fatty liver had impaired insulin action in the liver and muscle. A pediatric study reported that NAFLD was associated with a two-fold prevalence of prediabetes or diabetes [69]. Nadeau et al. [75] reported that nearly half of all youth with type 2 diabetes showed abnormal ALT levels. In a population-based study from Korea, the prevalence of prediabetes was 15.6% among youth with NAFLD versus 7.8% among those without NAFLD [1]. In addition, the prevalence of NAFLD was 15.6% among youth with prediabetes versus 9.1% among those without prediabetes. The odds ratio of prediabetes for NAFLD was 1.85. Children with metabolic syndrome had a 5 times higher odds ratio of having NAFLD versus those without metabolic syndrome even after the adjustment for age, sex, race, ethnicity, BMI, and hyperinsulinemia in a cross-sectional study [76]. In another study, the odds ratio of NAFLD for metabolic syndrome was 2.65 among children with obesity [77].
Metabolic-associated fatty liver disease
Based on the association between NAFLD, insulin resistance, and metabolic syndrome, a new concept, MAFLD, has been suggested [10]. Furthermore, the definition of pediatric MAFLD was suggested by an international expert consensus statement as hepatic steatosis with one of the following: (1) excess adiposity, including overweight and obesity and/or abdominal obesity; (2) prediabetes or type 2 diabetes; and (3) 2 or more metabolic risk factors such as abnormal triglycerides, HDL cholesterol, blood pressure, and triglyceride-to-HDL cholesterol ratio [78].
Conclusion
This review discussed the epidemiology of pediatric NAFLD and the association between insulin resistance and NAFLD. Although the prevalence of NAFLD is increasing globally, with an increased prevalence of obesity and obesity-related comorbidities, investigations on proper screening methods and the non-invasive diagnosis and treatment of NAFLD are limited in children and adolescents. Moreover, the prevalence of obesity has increased globally during the COVID-19 outbreak, but investigations of the prevalence of pediatric NAFLD and the association between COVID-19 and NAFLD are limited. Further studies investigating non-invasive diagnostic methods of NAFLD as well as the effect of COVID-19 on NAFLD, focusing on the relationship between NAFLD and insulin resistance, are required for the management of future risks of advanced liver diseases and cardiovascular diseases. In addition, investigations into the clinical application of MAFLD in children and adolescents are required to confirm the validity of renaming NAFLD as MAFLD.
Notes
Conflicts of interest
No potential conflict of interest relevant to this article was reported.
Funding
This study received no specific grant from any funding agency in the public, commercial, or not-for-profit sectors.


