Echocardiographic reference z scores of right ventricular dimension and systolic function of children aged 5–12 years
Article information
Abstract
Background
Reference values for right ventricular dimension and systolic function in Nigerian children are scarce despite their high burden of right ventricular abnormalities. Reference values from other countries may not be suitable for use in Nigerian children because of possible racial variations in cardiac size.
Purpose
To develop reference values for right ventricular dimension and systolic function in healthy Nigerian children aged 5–12 years.
Methods
This descriptive cross-sectional study conducted between July and November 2019 included 480 healthy boys and girls aged 5–12 years. The participants were randomly selected from 6 primary schools in the Ikeja Local Government area of Lagos State and their weights and heights measured. Body mass index and body surface area were calculated. Echocardiography was performed at rest in the left lateral position.
Results
The right ventricular end-diastolic basal diameter (RVD1), right ventricular end-diastolic mid-cavity diameter (RVD2), and right ventricular end-diastolic length (RVD3) were obtained. The right ventricular end-diastolic basal diameter (RVD1), right ventricular end-diastolic mid-cavity diameter (RVD2), and right ventricular end-diastolic length (RVD3) were obtained, as well as tricuspid annular plane systolic excursion (TAPSE) and tissue Doppler-derived right ventricular systolic excursion velocity (S'). The overall mean±standard deviation (SD) values for RVD1, RVD2, RVD3, TAPSE, and S' were 32.95±4.2, 25.86±3.5, 54.57±7.5, 20.11±2.3, and 18.24±2.2, respectively. Age- and sex-specific mean and SD values of the same cardiac indices were determined. Z score charts and the mean± 2SD right ventricular dimensions and systolic function were generated. All right ventricular dimensions were positively correlated with weight, height, body surface area, and body mass index. Only height correlated consistently with TAPSE and S'.
Conclusion
The observed mean right ventricular dimension indices differed from those derived elsewhere, suggesting that values from other countries may be inappropriate for Nigerian children. These reference values are applicable in daily clinical practice.
Key message
Question: Z score reference values for right ventricular size and systolic function in children using echocardiography are available in several countries. Despite the high burden of diseases involving the right ventricle in Nigeria, these reference values have limited applicability.
Finding: The right ventricular sizes of Nigerian children differed from those published elsewhere.
Meaning: These reference values will aid the treatment, monitoring, and pre- and postintervention for Nigerian children.
Introduction
Echocardiography is a reliable, noninvasive tool for evaluating cardiac size and function. Abnormalities of right ventricular size and function can be caused by pulmonary artery hypertension from any aetiology. Abnormalities of right ventricular size and function can be caused by pulmonary artery hypertension from any aetiology such as congenital and acquired heart diseases [1]. Studies in our locale have shown a high burden of these conditions [2-4]. These conditions lead to right ventricular failure which is a significant cause of morbidity and mortality in children [5]. Consequently, assessment of the right ventricular size and function is crucial for monitoring affected children before and after intervention. However, accurate echocardiographic diagnosis and interpretation in turn depends on the availability of reference values for the dimensions and function derived from healthy children representative of the population of interest.
Published reference values for right ventricular size and systolic function are available in some countries including Australia, Spain, Turkey, Italy, India, and Zimbabwe [6-11]. There is a likelihood of misinterpretation if reference values from other countries are used in our population due to differences in genetic, environmental, socio-economic, and anthropometric determinants of cardiac size [12]. For instance, Gokhroo et al. [10] found that most of the right ventricular dimension parameters of Indian children were smaller than those of their Western counterparts.
A careful literature search yielded no published reference values of right ventricular size and systolic function in children in Nigeria beyond the neonatal age group [13]. In addition, the reference values were not based on the current American Society of Echocardiography (ASE)'s recommendation [14]. We aimed to generate reference values of right ventricular dimensions and systolic function of healthy school-aged children in Nigeria.
Methods
1. Study design and population
The study was a cross-sectional study of school pupils aged 5 to 12 years attending selected primary schools in Ikeja Local Government Area (LGA) of Lagos State in the South-West geopolitical zone of Nigeria.
2. Sampling size and selection
We needed a minimum of 232 children, rounded up to 240, to estimate the mean tricuspid annular plane systolic excursion (TAPSE) of Nigerian children within 1.5% at a confidence level of 95% while assuming a mean±standard deviation (SD) TAPSE of 20.7±2.3 [11] and with 10% drop-out.
Furthermore, we doubled this sample size to increase the power and precision of our quantitative estimates. The total sample size of 480 was distributed among each age category and sex.
We used multistaged sampling technique to recruit pupils aged 5 to 12 years from 6 randomly selected registered primary schools in Ikeja LGA thus:
Stage 1: A list of all 191 (31 private, 160 public; ratio 5:1) registered coeducational primary schools was obtained from the State Universal Basic Education Board through the Ministry of Education.
Stage 2: Six schools (5 public, 1 private) were selected by simple random sampling using paper ballots (an observer selected from schools written on separate papers separately for public and private schools). Where a selected school could not be used due to refusal of consent from the school authority, another school on the list was selected.
Stage 3: In each selected school, simple random sampling was used to select one arm of the class (from nursery 1 to primary 6).
Stage 4: In each selected class, we used systematic random sampling to select 10 pupils from each class (roughly corresponding to each year of age) by selecting every nth subject on the class register where ‘n’ is the number of pupils in the class divided by ten. Refusal by any of the selected pupil resulted in recruiting the next pupil after the nth subject. Where the number of recruited pupils in a school was inadequate, more pupils were recruited from the next selected school.
3. Selection criteria
We included children aged 5 to 12 years and EXCLUDED those with history or physical features suggestive of: unrepaired or repaired congenital heart disease and acquired heart diseases (including on echocardiography); sickle cell disorder; chronic adenoidal hypertrophy/obstructive sleep apnea; renal diseases; persistent asthma; genetic/chromosomal disorders; thoracic spine deformities; endocrine abnormalities such as anorexia nervosa; malnutrition(weight and height for age less than 5th percentile and greater than 95th percentile (using the Centres for Disease Control charts) [15].
4. Ethics approval
The study was approved by the Health Research Ethics Committee of Lagos State University Teaching Hospital (LREC. 06/10/1044). Also, the parents or guardians of all participating pupils gave written permission for their ward’s participation after due regulatory approval by the Lagos State Universal Basic Education Board, Ministry of Education and individual school authority. Assent was also obtained from each pupil after parental permission; non-assenting pupils were excluded despite parental permission.
5. Data collection
We conducted the study during the school break periods, after-school hours and summer classes between July to November 2019. Parents of each potential participant received a letter with an attached self-designed questionnaire consisting of the child’s demographics (date of birth) and medical information (on the exclusion criteria). Following standardized protocol [16], we measured each pupil’s weight and height using an electronic weight scale (Omron HN283, OMRON Healthcare Co., Ltd., Kyoto, Japan) and stadiometer (Seca, seca GmbH & Co. KG., Hamburg, Germany). Body surface area (BSA) was calculated using Haycock formula [17].
Echocardiography was performed, in a dedicated room in each school, by the lead author using Sonoscape S 40 (SonoScape Co., Ltd., Shenzhen, China). A brief physical examination was conducted to count the pulse rate, locate the apex beat and auscultate for murmurs. Each subject laid comfortably in the left lateral position on an examination couch.
A transducer of 5 to 7.5 MHz was used to evaluate cardiac structures in 2-dimensional guided echocardiography to exclude asymptomatic structural abnormalities; the right ventricular dimensions and systolic function were obtained on a right ventricular focused apical 4-chamber view by adjusting the transducer to focus maximally on the right ventricle with both apexes in view [18].
Obtained echocardiographic measures were: (1) Right ventricular end-diastolic basal diameter (in mm) measured as the maximal dimension in the basal one third of the right ventricular cavity at end-diastole. [18]; (2) Right ventricular end-diastolic mid-cavity diameter (in mm) measured in the middle third of the right ventricle at the level of the left ventricular papillary muscle at end-diastole. [18]; (3) Right ventricular end-diastolic length (in mm) measured from the plane of the tricuspid annulus to the right ventricular apex. [18]; (4) TAPSE (in mm) measured by placing the M-mode cursor through the tricuspid lateral annulus on the 4-chamber view, ensuring that the cursor aligns with the apex of the heart and measuring the longitudinal motion of the annulus at peak systole. [18]; (5) Tissue Doppler-derived right ventricular systolic excursion velocity (in cm/sec) measured by placing the pulsed Doppler sample volume on the lateral side of the tricuspid annulus with an optimal image orientation [18].
Intraobserver variability was tested with intraclass coefficients of 3 measurements on each parameter.
6. Data analysis
The statistical analysis was done using IBM SPSS Statistics ver. 21.0 (IBM Co., Armonk, NY, USA)The Kolmogorov-Smirnov test was used to test for normal distribution of continuous variables. Continuous variables were expressed as mean and SD when they were normally distributed. Analysis of variance was used to test differences in means among age groups. Intraclass correlation coefficients and their 95% confidence intervals were calculated based on a mean rating, absolute agreement, 2-way mixed-effects model to check for intraobserver variability [19]. Intraclass correlation coefficient values less than 0.5 indicates poor reliability, values between 0.5 and 0.75 indicate moderate reliability, values between 0.75 and 0.9 indicate good reliability, and values greater than 0.90 indicate excellent reliability [19]. Descriptive reference ranges are reported as mean and SD. Pearson correlation coefficient was used to determine the strength of the linear relationship between the right ventricular dimensions and systolic function with weight, height, body mass index (BMI), and BSA. We fitted our data to several regression models, namely linear, quadratic, cubic polynomial, exponential and logarithmic to determine the model with the best goodness-of-fit to our data, defined as the model with the largest coefficient of determination, R2, which was then used to compute z scores for each echocardiographic measure:
Where Z is the z score, X is the observed measurement, µ is the population mean, equivalent to the predicted mean, and σ is the standard deviation of the population, equivalent to the SD of the predicted mean.
The z scores were presented in charts and/or in relation with BSA and measurements obtained. Level of significance was set as P<0.05.
Results
1. Anthropometric and physiologic characteristics of participants
A total of 480 subjects (240 boys and 240 girls) participated in the study, with mean±SD age of 8.50±2.3 years. All participants were found to be normal. There was no difference between boys and girls in terms of mean weight (27.64±6.5 kg vs. 28.72± 8.9 kg, t=1.522; P=0.129), height (127.00±13.5 cm vs. 127.53±13.2 cm, t=0.447; P=0.655), and unit of BSA inserted (0.98±0.2 m2 vs. 1.00±0.2 m2, t=1.085; P=0.279), the girls were heavier than the boys (BMI: 17.24±2.6 kg/m2 vs. 16.80±1.7 kg/m2, t=0.45; P=0.03). The mean pulse rate was significantly higher in girls (93.75±7.7 bpm vs. 91.33±1.4 bpm, t=3.076, P=0.002) but there was no significant sex difference in their oxygen saturation (97.86%±0.7% vs. 97.85%±0.7%, t=0.199; P=0.843). Intraobserver variability test for each measurement computed using intraclass correlation coefficient showed that all measurements had excellent reliability of 0.968 (95% confidence interval [CI], 0.963–0.973; P<0.001) for RVD1, 0.946 (95% CI, 0.941–0.957; P<0.001) for RVD2, 0.976 (95% CI, 0.971–0.980; P<0.001) for RVD3, 0.923 (95% CI, 0.910–0.934; P< 0.001) for TAPSE, and 0.947 (95% CI, 0.938 –0.955; P<0.001) for S’ with average measures.
2. Mean echocardiographic right ventricular dimensions and function of Nigerian school-aged children
The mean±SD RVD1, RVD2, RVD3, TAPSE, and S’ in the total sample were 32.95±4.2, 25.86±3.5, 54.57±7.5, 20.11±2.3, and 18.24±2.2, respectively. Girls had a significantly higher mean±SD TAPSE than boys (20.33±2.3 vs. 19.90±2.2, t= 2.088; P=0.037) but there were no significant sex difference in their RVD1 (32.74±4.0 vs. 33.16±4.3, t=1.118; P=0.264), RVD2 (25.79±3.5 vs. 25.94±3.6, t=0.455; P=0.649), RVD3 (54.59±7.5 vs. 54.55±7.6 t=0.058; P=0.953), and S’ (18.43±2.2 vs. 18.05±2.2, t=1.926; P=0.055).
3. Anthropometric and age correlates of right ventricular dimension and function
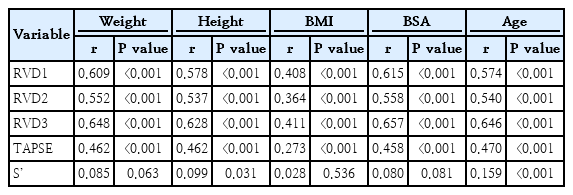
Table 1 shows the linear correlation between the echocardiographic measurements and each of weight, height, BMI, BSA, and age. Weight, height, BMI, and BSA correlated significantly with all 3 indices of right ventricular size (RVD1, RVD2, and RVD3) and TAPSE, but S’ was significantly correlated with only height, albeit weakly (r=0.099, P=0.031). Of the 4 anthropometric variables, BSA had the highest correlation with each of RVD1, RVD2, and RVD3; height and weight had similarly the highest correlation with TAPSE. Age correlated significantly with all the indices of right ventricular size and systolic function.
4. BSA- and age-based reference ranges of right ventricular dimensions and function
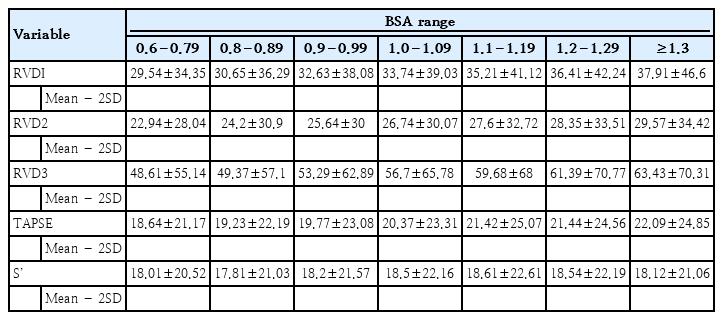
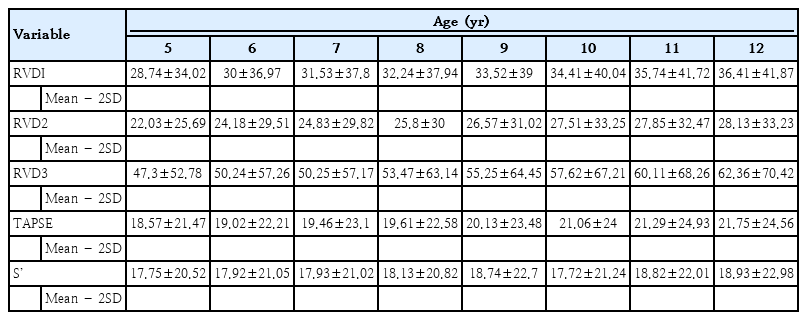
Tables 2 and 3 show the reference range (mean±2SD) of right ventricular measurements for various BSA and age categories, respectively.
5. Regression equations and z scores of echocardiographic measurements
The model with the best fit to our data for all the measurements was the cubic polynomial model, with the generic equation (Table 4) : Y=β0+β1X+β2X2+β3X3 where ‘Y’ is the predicted mean, ‘β0’ is the intercept or constant, ‘X’ is the BSA, and ‘β’ is the regression coefficient. Thus, for a particular BSA, the calculated or predicted value for each measurement can be derived by substituting the values from Table 5. For example,
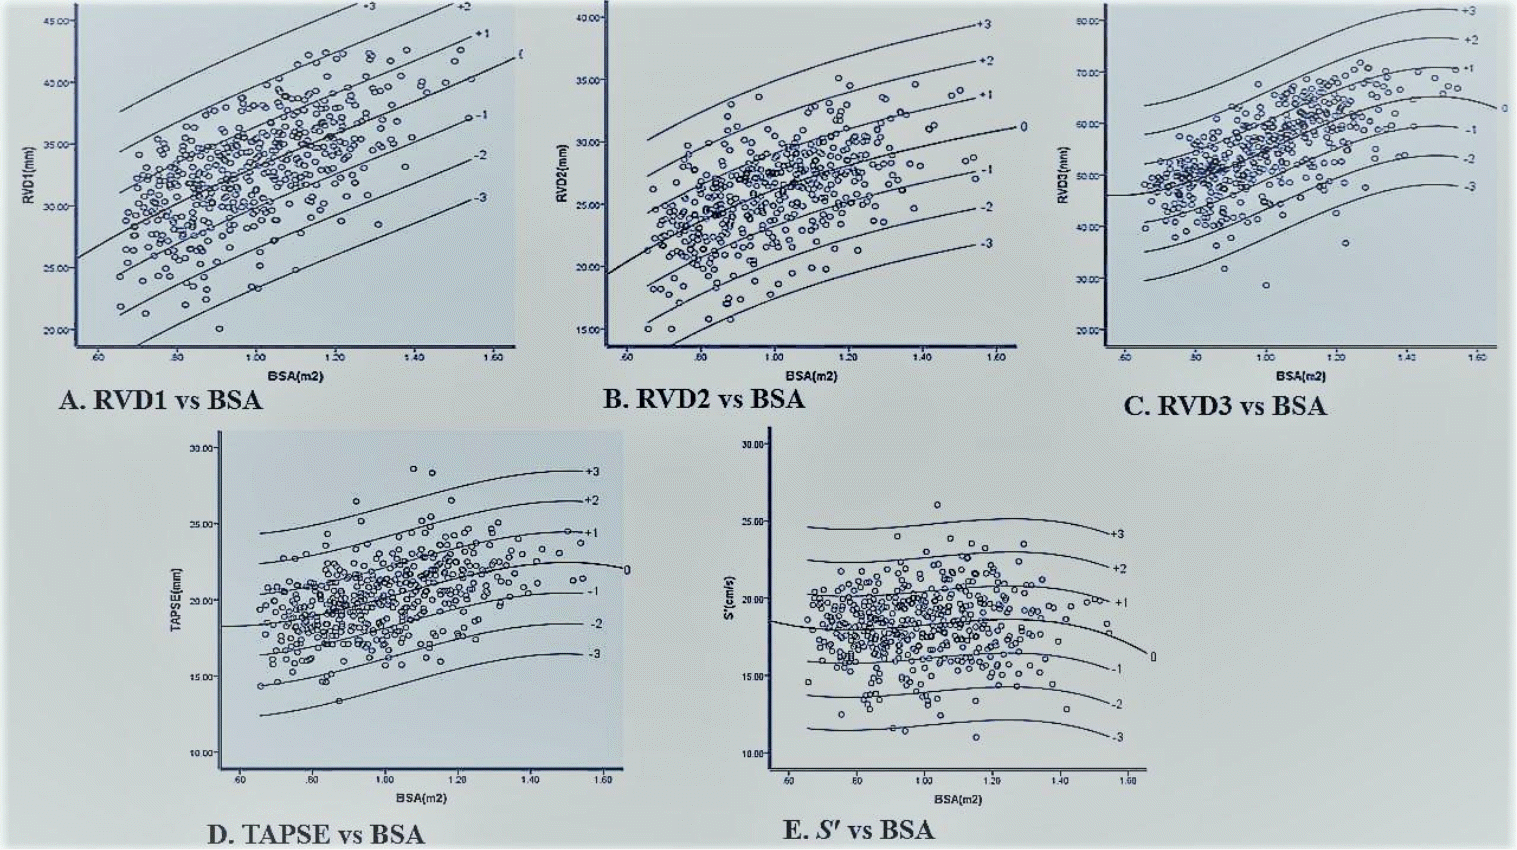
This model was subsequently used to derive z scores for all echocardiographic variables, using the regression coefficients shown in Table 5. Fig. 1 shows the scatter plots of the z scores of the right ventricular measurements against BSA. The majority of the data points are within-3 and +3 z scores; only about 3.6%, 5%, 3.4%, 4.5%, and 4.5% of the population were above and below the ±2 z score for RVD1, RVD2, RVD3, TAPSE, and S’, respectively.

Scatter plots with cubic polynomial regression showing z scores of right ventricular measurements plotted against BSA. (A) RVD1 against BSA. (B) RVD2 against BSA. (C) RVD3 against BSA. (D) TAPSE against BSA. (E) S′ against BSA. BSA, body surface area; RVD1, right ventricular end-diastolic basal diameter; RVD2, right ventricular end-diastolic mid-cavity diameter; RVD3, right ventricular end-diastolic length; TAPSE, tricuspid annual plane systolic excursion; S′, tissue Doppler-derived right ventricular systolic excursion velocity.
Discussion
We aimed at developing z score reference echocardiographic values for the right ventricular dimension and function of healthy Nigerian school children aged 5 to 12 years, based on BSA as recommended by ASE. We report the mean RVD1, RVD2, RVD3, TAPSE, and S’ of Nigerian school-aged children to be 32.95±4.2, 25.86±3.5, 54.57±7.5, 20.11±2.3, and 18.24±2.2, with no sex difference except for a higher TAPSE among girls. BSA had the highest correlation with right ventricular dimension. We thus provide BSA-based reference ranges for the echocardiographic right ventricular dimensions and function of Nigerian school-aged children. Also, the cubic polynomial regression model was the best fit to our data, with more than 95% within -3 and +3 z scores. These reference values, perhaps the first from healthy Nigerian school-aged children, fill clinically useful gaps in objectively diagnosing, prognosticating, and monitoring Nigerian children with primary or secondary right ventricular disorders.
The mean values of all the right ventricular dimensions obtained were higher than those obtained in Australian children [6] within the same age bracket. Similarly, the mean values were higher than values reported in children with equivalent BSA in India [10] and Italy [9]. The reason for these variations may be due to genetic and racial differences in cardiac sizes. A systematic review by Majonga et al. [20] involving reference values in children from various populations showed that African children have larger ventricular dimensions than their Caucasian counterparts. This was further corroborated by Ashubu et al. [13], who reported that Nigerian neonates had larger right ventricular dimensions than Caucasians. This racial difference in cardiac sizes has also been reported in the adult population, even when indexed to BSA [21,22]. Therefore, racial influence on cardiac size appears to persist into adulthood, further reinforcing the need for reference standards derived from local populations. The use of reference standards derived from other countries may result in misinterpretation errors and misdiagnosis as well as potential under or overtreatment.
The overall mean BSA-based TAPSE values were comparable with values obtained from children in Zimbabwe [11], Turkey [8], and Japan [23]. In addition, the mean age-based TAPSE values were comparable to those obtained in Australian children [24]. This pattern contrasts with that we earlier noted about right ventricular dimensions and race, thus suggesting that racial factors may have a stronger influence on cardiac size than cardiac function. Assessment of right ventricular function using TAPSE predicts cardiovascular death in the general population [25]. The overall mean S’ obtained in our study was higher than that obtained from children in Iran [26] and the United States [27-29]. This disparity may be explained by the difference in age population recruited in those studies which included neonates and teenagers. There are few studies on reference values for S’ in children. Therefore, the reference values obtained in the present study contribute significantly in that direction and can be accepted for use in children aged 5 to 12 years. Cardiopulmonary disorders result in the alteration of right ventricular preload, increased afterload, systolic dysfunction, and an indirect decrease in left ventricular stroke volume from right ventricular volume overload [1]. Thus, the assessment of right ventricular size and function is crucial for complete evaluation and management of such disorders. This in turn depends on reference standards from a fairly large, locally selected, and representative sample population like ours.
The z scores for all measurements were between -3 and +3 using the cubic polynomial regression model, similar to the study by Pettersen et al. [30] depicting as appropriate for our sample With the use of z scores, the magnitude of an abnormality is easily appreciated [14]. This makes z score an important way of expressing cardiovascular measurements as implemented in our study. The z score-based scatter plots for right ventricular dimensions and systolic function showed 95% to 97.8% of the subjects within +2 and -2 z score. A normal range of z score for cardiac measures is defined as +2 and -2 with 0 as the mean [11]. The comparison of z score-based scatter plots for right ventricular dimensions and systolic function with other studies is limited. This is because only a few studies generated z score scatter plots [6,11] while others had charts and curves plotted for z score [7-10,24] using BSA and the measurements obtained. In addition, some of the studies obtained the z score based reference values using various regression models [6,7,9-11] while others did not use regression models [8,23,24]. In computing z scores, a regression model should be selected so that the fit is adequate across the whole population to avoid heteroscedasticity [31].
Our study showed a strong positive correlation between right ventricular dimensions and weight, height, BMI and BSA. This is similar to the findings by Koestenberger et al. [6] in Austria. TAPSE correlated significantly with weight, height, BMI, and BSA. This finding is consistent with earlier reports by Uysal et al. [8] and Núñez-Gil et al. [7]. On its part, S` correlated positively with only height, which contrasts with the finding by Roberson et al. [32]. The reason for this disparity is not immediately deducible.
A significantly higher mean TAPSE was found in females which contrasts findings from other studies [8,9,15]. The reason for this observation is not obvious. However, BMI was also significantly higher in females and BMI was found to be significantly correlated with TAPSE. Thus, the higher mean TAPSE could be a reflection of higher BMI values in females. The validity of this explanation should be further explored in future studies.
The strength of our study is the relatively large sample. Our study was also school-based, similar TO that carried out by Gokhroo et al. [10]. In contrast, most of the other studies [7-9,23] were hospital-based and involved subjects referred for cardiac evaluation. The school is a better reflection of the general population than the hospital; measurements from hospital settings are less representative of the general population and may be biased by children with asymptomatic but abnormal cardiac findings. All the subjects in the current study were within the normal limits of weight and height for their age. This is in contrast to the subjects that participated in the study by Gokhroo et al [10], out of which some were undernourished. Malnutrition has been shown to decrease ventricular mass [33], while obesity increases cardiac mass and decreases systolic function [34]. The measurements obtained from our study may be considered accurate for reference value as all the selected subjects were healthy children. However, we recognize that focusing on a single local government area of Nigeria, rather than several, may limit the generalisability of our findings.
We cannot exclude ethnic influences on cardiac sizes across an ethnically diverse country like Nigeria. Hence, similar studies are advocated from other parts of the country for comparison and corroboration of our references. We did not conduct external validation of the regression equation, although the z score distribution suggests at least a good fit to our sample. Other measurements such as systolic and diastolic areas were not taken in order not to significantly interfere with school sessions. Furthermore, we were unable to match age and BSA in developing our z score reference values, though BSA is recommended by ASE to normalize measurements in cardiology. In addition, we did not have access to 3-dimensional echocardiography in assessing right ventricular function.
In conclusion, the z score reference values have been developed for school-aged children in Nigeria. This will help reduce the limitations of using references from elsewhere due to racial differences in cardiac size. It is an addition to the existing available references, thus allowing accurate assessment of right ventricular dimensions and systolic function in children with cardiac disorders.
Notes
Conflicts of interest
No potential conflict of interest relevant to this article was reported.
Funding
This study received no specific grant from any funding agency in the public, commercial, or not-for-profit sectors.
Author contribution
Conceptualization: ABO, BAA, OFN; Formal Analysis: ABO, POU; Investigation: ABO, BAA, POU, OFN; Methodology: ABO, BAA, OFN; Writing – Original Draft: ABO, MOL, POU, MOA, OAK, BAA, OFN; Writing – Review & Editing: ABO, MOL, POU, MOA, OAK, BAA, OFN
Acknowledgements
We thank Adenuga Adenike Olufunke, Opeloyeru-Ajimotokan Khadijah, and Ayoade Lekan for their assistance in data entry. We appreciate the Lagos State Ministry of Education, the State Universal Basic Education Board, the school proprietors and the head teachers for granting permission to carry out the study. We are grateful to all teachers, parents, guardians, as well as the pupils for their support and participation. Our report is part of a larger study submitted as a post graduate dissertation to the West African College of Physicians, Faculty of Paediatrics.


