Attention-deficit/hyperactive-impulsive disorder symptoms among grade 1 students with reading disorder in Thailand
Article information

Abstract
Background
Reading disorder is the most common comorbid condition with attention-deficit/hyperactive-impulsive disorder (ADHD) in school-aged children.
Purpose
This study compared symptoms of ADHD among children in grade 1 at risk of reading disorder with children not at risk.
Methods
This cross-sectional study included 703 students in grade 1 aged 6–8 years from 8 schools in Pathumthani Province, Thailand, in 2019. Reading disorder was assessed using tools developed by Vibulpatanavong and Evans for Thai teachers, whereas the Thai parent and teacher versions of the Swanson, Nolan, and Pelham IV Rating Scale (SNAP-IV) was used to evaluate ADHD symptoms. Demographic data were collected from parents using a self-reported questionnaire.
Results
Among the 703 students with almost equal number of male (n=350) and female (n=353), and the average age of 6.56±0.57 years, 95 (13.51%) were classified (significantly male) at risk of reading disorder. The mean SNAP-IV scores of children with reading disorder reported by parents and teachers (20.23±10.95 and 20.75±15.08, respectively) were significantly higher than those of neurotypical children (16.04 ±8.59 and 9.00±10.14, respectively, P<0.05). Of the 95 students with reading disorder reported by parents and teachers, 29 (30.53%) and 20 (21.05%) respectively, were defined as having ADHD according to the standard cutoff SNAP-IV scores, which were significantly higher than 608 neurotypical students at 108 (17.76%) and 20 (5.59%) (P<0.05). The odds ratios of children with reading disorder having ADHD symptoms according to teacher reports were 3.32 (95% confidence interval [CI], 1.14–9.67; P<0.05), 3.75 (95% CI, 1.60–8.79; P<0.05), and 4.41 (95% CI, 1.20–16.15; P<0.05) for inattentive, hyperactive, and combined presentations, respectively.
Conclusion
Grade 1 students with reading disorder had a significantly higher prevalence of ADHD symptoms than neurotypical students. Therefore, children with reading disorders should undergo ADHD assessments and receive proactive intervention.
Key message
Question: Would students with reading disorder have a significantly higher prevalence of attention-deficit/hyperactiveimpulsive disorder (ADHD) symptoms than neurotypical students?
Finding: Students at risk of reading disorder exhibited significant ADHD symptoms compared with those not at risk of reading disorder according to all presentations of teacher assessments versus only for predominantly inattentive presentations of the parental assessments.
Meaning: Students with reading disorder have a significantly higher prevalence of ADHD symptoms than neurotypical students. Sex, parental education level, average family income, and children’s school affiliation significantly influenced reading disorder prevalence.
Graphical abstract. RD, reading disorder; SNAP-IV, Swanson, Nolan, and Pelham IV Rating Scale; ADHD, attention-deficit/hyperactive-impulsive disorder.
Introduction
Specific learning disorders (SLDs) are theoretically the neurodevelopmental disorders causing the impairments of learning abilities, the prevalence rates worldwide of which were reported to be approximately 4%–10% with males 3 to 4 times more suffered than females [1]. SLD is classified into 3 types, i.e., reading disorder, writing disorder, and mathematic disorder, approximately 80% of which is reading disorder [2,3]. The screening number and prevalence rate in Thailand conducted by the Ministry of Education in 2009 in 9,828 schools, which is approximately 1/3 of the total number of schools all over the country, was found to be 15.6% at risk of SLD [4].
Attention-deficit/hyperactive-impulsive disorder (ADHD) is one of the most common disorders in school-aged children, which is characterized by excessive activity, short attention span, and impulsivity, with childhood-onset and at least partial persistence into adulthood in the majority of cases [1,5]. ADHD is classified into 3 different presentations by Diagnostic and Statistical Manual of Mental Disorders, fifth edition (DSM-5) (formerly known as subtypes in DSM-IV), i.e., predominantly inattentive, predominantly hyperactive/impulsive, and combined presentations [1,6]. The recent advances from neuroimaging as well as frontal volume have improved our understanding of the neurobiology of ADHD which is theoretically the disorders of nervous system [7,8]. Although the prevalence rates worldwide of ADHD in school children are considerably varied and estimated to be between 2% and 10% of the population, it is considered to be underdiagnosed [5]. A more recent study in 7,188 Thai students graded 1–5 in primary school revealed the prevalence of 8.1% with the ratio of boy to girl equal to 3:1. Besides, the prevalence of subtype in ADHD was mostly of the combined type of 3.8% and hyperactive/impulsive type were lowest at 0.9% [9].
ADHD is a highly comorbid condition associated with other neurological and psychiatric disorders. Reading disorder seems to coexist most clearly with ADHD [10]. Of all psychological comorbidities of reading disorder, ADHD was reported to be the most common comorbid disorder about 18%–42% [2,3,11]. A recent study also supports the notion that reading problems and dyslexia are more clearly associated with inattention than the hyperactivity/impulsivity dimension of ADHD and this association is genetically mediated [12]. Up to date, it is not clear, on which exact functional processes this comorbidity is based. Some researchers explained that inattention problem from ADHD may lead to learning difficulties while others proposed that children with reading disorder had difficulty in learning in the classroom and lead to symptoms of ADHD [3,13]. Several theories have been offered to explain the profile of the comorbidity group vs. each disorder separately in an attempt to crystalize the characteristics of each condition. Two prominent theories are: (1) cognitive subtype hypothesis - ADHD + reading disorder has a distinct causal mechanism and could be regarded as an independent disorder [14,15] and (2) phenocopy hypothesis - the deficit in ADHD + reading disorder is ADHD with secondary symptoms of reading disorder and therefore, ADHD + reading disorder is not considered as a separate disorder [16]. And another theory was that some brain function abnormalities may be the underlying cause of both reading disorder and ADHD [17-19].
Although the prevalence and problems of SLD have been considerably studied, the exploration of reading disorder, especially for students at the elementary school, i.e., the first phase of enrollment in the compulsory education system, is still very limited. It is thus of interest to explore the prevalence of ADHD in grade 1 school children who were at risk of reading disorder as well as to figure out which subtype of ADHD predominant presentation in grade 1 school children who were at risk of reading disorder. Besides, it is expected that knowing the relationship with reading disorder and ADHD would lead to appropriate early intervention.
Methods
1. Participants
A cross-sectional study was conducted on grade 1 students in Pathumthani Province, Thailand in 2019. The students included in this study were those aged between 6–8 years, being communicable using Thai, and having been given consent by parents. The excluded students were those previously diagnosed for vision problems, i.e., blindness or blurred vision; listening problems, i.e., deafness or hearing impairments; and developmental problems, i.e., autism, delayed development or intellectual disability.
A sample of 450 students was calculated to detect the effect of reading disorder on ADHD with the power of 80% and P value <0.05. The prevalence of ADHD in general population and children with reading disorder were estimated at 5% (2%–5%) [5], and 18% (18%–42%) [2], respectively.
2. Procedures
Schools from 3 affiliations (Office of Basic Education, Local Administration Organization, and private schools) were selected by purposive sampling method; schools were located nearby Thammasat University Hospital and were chosen with respect to teachers’ interest and willingness to cooperate. The school directors were then contacted and permission was requested to carry out studies in the schools by providing documents to clarify the research participants. Students had their reading skills assessed face-to-face at schools. Each reading test was performed by a single tester to test all students in a quiet room at the school. The demographic questionnaires and Swanson, Nolan, and Pelham IV Scale (SNAP-IV) parent version were sent out to be completed by parents and returned within one month, whereas the SNAPIV teacher version was completed by homeroom teachers.
3. Assessment of reading skills
The students’ reading skills were assessed by the tools developed by Vibulpatanavong and Evans [20]. The tools were designed for Thai teachers to identify students with reading difficulties and provide assistance from early school years. The word and passage reading tests of the tools were used. The word reading test consists of a total of 60 Thai words in a sequence from easy to difficult, through which the student has to read aloud within 1 minute and be scored for the correct words. The passage reading test comprises 3 prose-style short stories each with the length of 120–175 words. The correct words of each story the students can read within 1 minute are scored and then summed into the total score of the 3 stories. The criterion for students at risk of reading disorder is defined as a sum score of either the word reading or the 3-passage reading which is <10 percentile of the sampled population.
4. Assessment of ADHD
The assessment of ADHD was carried out by using the short form of SNAP-IV, questionnaire, Thai version for parents and homeroom teachers [21,22]. This instrument consists of a total of 26 questions comprising attention deficit 9 questions (No. 1–9), hyperactive-impulsive disorders 9 questions (No. 10–18), and oppositional defiant disorder (ODD) 8 questions (No. 19–26). The scoring scale is as follows: 0 for none, 1 for low, 2 for moderate, and 3 for high frequency of symptoms. SNAP-IV has high accuracy with Cronbach alpha values of 0.93–0.96 and sensitivity of approximately 50%–60%.
The original version of SNAP-IV defines the cut-point criteria of the teacher version for identifying children with ADHD as predominantly inattentive, predominantly hyperactive-impulsive presentations, and ODD at scores 23, 16, and 11, respectively, while the cut-point criteria of the parent version are 16, 13, and 15, respectively. Pityarastian et al. [21] conducted a study to determine the appropriate cut-point criteria for the Thai version of SNAP-IV and suggested that scores 18, 11, and 8 of the teacher form and scores 16, 14, and 12 of the parent form were the proper cut-point criteria for defining children with ADHD as predominantly inattentive, predominantly hyperactive-impulsive presentations, and ODD, respectively.
5. Demographic data
Demographic data of students about age, sex, parental education, family income, attending kindergarten, delayed speech history, family history of reading or writing difficulty, parents’ perception of their child’s reading ability, and school affiliation were collected from parents by a self-report questionnaire. These data of students at risk of reading disorder and their parents were statistically compared with nonreading disorder groups. Parental education was categorized as high school or lower versus vocational college or higher. Family income was categorized as <285, 285–855, 855–1,425, 1,425–2,850, and >2,850 USD. The previous records whether students having ever attended kindergarten, as well as former delayed speech problem before attending school were collected. The students’ family history of reading or writing difficulty were also compiled.
6. Data analysis
Data were analyzed by using Stata 14 (StataCorp LLC, College Station, TX, USA). Descriptive statistics were used to describe demographic data. In the case of categorical data, percentage amount was employed. Mean and standard deviation were used for continuous data. In comparison of data between groups chisquare and Fisher exact test were used in the cases of categorical data, whereas t test was used for continuous data, with P value <0.05 being statistically significant. The independent t test was used for studying the differences between the 2 groups in terms of ADHD symptoms scores. All tests were 2-tailed and considered significant at P value <0.05. In analysis of various influential factors by controlling the effects of other relevant factors, multivariate regression analysis was used. Logistic regression model was used to analyze the relationship between ADHD classification and children with or without risk of reading disorder. The variables such as sex, maternal education, average family income per month, delayed speech history, reading or writing difficulty in the family, parents’ perception of child’s reading ability, and school affiliations were used in a model for adjusting of confounding factors.
7. Ethical approval
Ethical approval for the current study was granted by the Ethics Committee Set 1 of Thammasat University. The approved number of this project was 203/2019, dated October 20, 2019, and the project number was MTU-EC-PE-4-111/19.
Results
1. Prevalence of reading disorder
A total of 703 questionnaires with almost equal numbers of male and female students and the average age of 6.56±0.57 years were answered by parents and teachers. There were 95 students or 13.5% at risk of reading disorder based on the assessment of reading skills in this study, as shown by demographic data in Table 1. Demographic data with statistically significant differences for students at risk of reading disorder compared to nonreading disorder were being male, maternal education lower than college, less average family income, delayed speech history, reading or writing difficulty in the family, parents’ perception of child’s reading ability, and school affiliations. It is interesting that maternal education state was correlated with reading disorder risk factors, while paternal education showed no correlation. It was shown that of the students at risk of reading disorder, 21.0% were studying in schools under the affiliation of the Office of Basic Education, 13.4% under Local Administration Organization, and 9.2% under private schools. Notably, school affiliation was also a significant factor associated with reading disorder. On the other hand, there was no significant difference regarding kindergarten attendance of students. Interestingly, only half of the parents of children at risk of reading disorder correctly evaluated that their child had lower literacy skill compared to their peers.
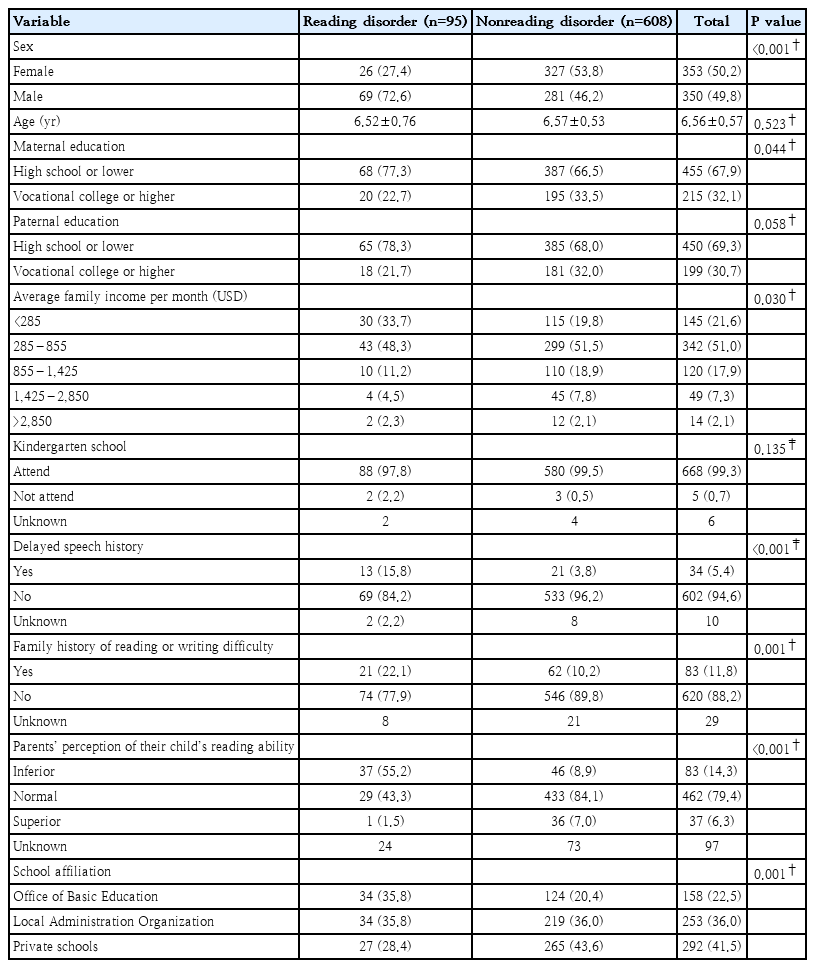
Demographic data of students at risk versus not at risk of reading disorder and their parents
2. Reading disorder with ADHD
Students at risk of reading disorder had significantly higher ADHD scores from the SNAP-IV in every predominant presentation from both parent and teacher reports compared with students without reading difficulty (Table 2). Standard and Thai cut-point criteria of SNAP-IV were used to define students whose scores met the criteria of ADHD as predominantly inattentive, predominantly hyperactive-impulsive, and combined presentations. Fig. 1 illustrates the proportions of students who had been defined as having ADHD by standard and Thai cut-point SNAPIV scores who were at risk of reading disorder compared to those who were not at risk of reading disorder. Based on either standard or Thai cut-point criteria, students defined as having ADHD for all presentations exhibited significantly higher proportions for those at risk of reading disorder than nonreading disorder groups (P<0.05), particularly by teacher reports.
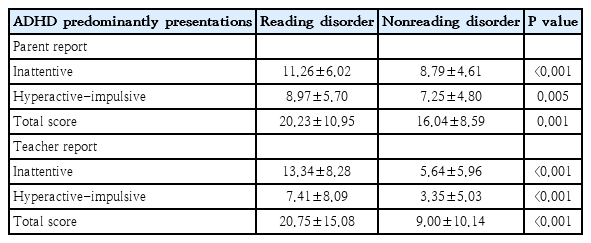
Mean SNAP-IV scores of students at risk versus not at risk of reading disorder assessed by parents and teachers (N=703)

Proportion of students at risk of reading disorder defined as attention-deficit/hyperactivityimpulsivity by standard and Thai cutoff Swanson, Nolan, and Pelham IV Rating Scale scores compared to the nonreading disorder group (N=703; P<0.05 by *Chi-square test. **Fisher exact test). RD, reading disorder.
Univariate and multivariate analysis were used to determine odds ratios for various ADHD presentations of students at risk of reading disorder compared with nonreading disorder group reported by parents and teachers. The odds ratios were also adjusted for confounders including sex, maternal education, average family income per month, delayed speech history, reading or writing difficulty in the family, parents’ perception of child’s reading ability, and school affiliations. The unadjusted and adjusted odds ratios of SNAP-IV scores using standard cut-point criteria reported by both parents and teachers are shown in Table 3. The adjusted odds ratios of the teacher and parent reports for predominantly inattentive, predominantly hyperactive-impulsive, and combined presentations were 2.81, 1.54, 2.72 and 3.32, 3.75, 4.41, respectively. The odds ratios of teacher reports displayed significant differences for all ADHD presentations, and so did the reports from parents except for predominantly hyperactive-impulsive presentation.
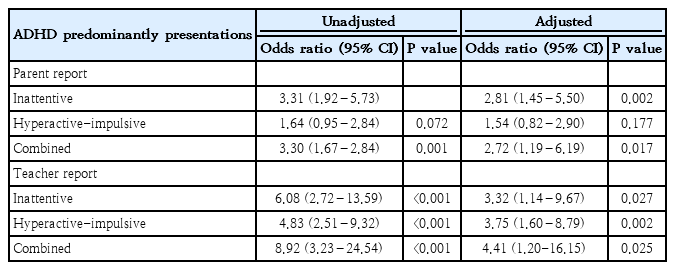
Logistic regression analysis of ADHD presentations in students at risk versus not at risk of reading disorder using standard cutoff SNAP-IV scores
The results using Thai cut-point criteria (Table 4) were in accordance with those using standard cut-point criteria for teacher reports. Children at risk of reading disorder displayed predominantly inattentive, hyperactive-impulsive, and combined presentations at 7.92, 3.86, and 5.47 times more than typical readers, respectively. On the other hand, parent reports using Thai cut-point criteria showed a significant result only for ADHD predominantly inattentive presentation.
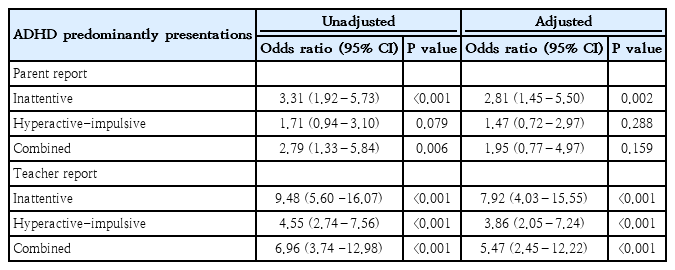
Logistic regression analysis of ADHD presentations in students at risk versus not at risk of reading disorder using Thai cutoff SNAP-IV scores
It might generally be concluded that students at risk of reading disorder exhibited significant ADHD symptoms for all presentations, compared with nonreading disorder group in the views of teachers, but only for predominantly inattentive presentation in the views of their parents.
Discussion
The major findings of this study revealed that students at risk of reading disorder exhibited significant ADHD symptoms for all presentations, compared with nonreading disorder group in the views of teachers, but only for predominantly inattentive presentation in the views of their parents. Gender, parental education level, average family income, and children’s school affiliation exhibited statistically significant influence on reading disorder.
The number of grade 1 students identified as at risk of reading disorder was 13.51% with significantly higher in boys 2.65 times than in girls, whereas those in nonreading disorder group were not significantly different. These numbers were considerably higher than the prevalence rates of approximately 4%–7% with plenty in males reported in the literature [2,3,5], but were in accordance with the formerly screening number and prevalence rate in Thailand at 15.6% [4]. Approximately 18%–45% of all children with ADHD also reach the clinical definition of reading disorder and are considered as “comorbid for ADHD and reading disorder.” [23,24] We found that Thai children with reading difficulties had more ADHD problems than children without reading disorder. In addition, our study further revealed that grade 1 is usually the earliest time when any relationship between reading problems and ADHD symptoms might be observed as this is when children begin compulsory education in Thailand.
The significant increase in SNAP-IV scores, as reported by parents and teachers for all predominant presentations of ADHD in students at risk of reading disorder as compared to the scores of children without reading disorder, indicated a relationship between ADHD symptoms and reading difficulties in these grade 1 students. When both standard and Thai cut-point criteria were used to see if students met ADHD criteria, there were more students at risk of reading disorder who met cut-point criteria in the predominantly inattentive and hyperactive presentations according to teacher reports. However, in the parental reports, only children with predominantly inattentive presentations were more prevalent in the reading disorder at-risk group. Such results were in accord with the previous reports revealing that ADHD predominantly inattentive and ADHD-combined, but not ADHD predominantly hyperactive-impulsive were associated with lower reading fluency, reading comprehension, and mathematics ability as well as higher reading and writing errors [17,25]. It is likely because teachers observed the students in the classroom, where children with reading difficulties may struggle to sit still and find it challenging to focus on a lesson. For instance, these children, who might be restless and probably walk around the classroom, will undoubtedly be noticed by the teacher. In contrast, parents typically observe their children at home likely running and playing freely so that they might not feel that their children are hyperactive. Nevertheless, parents are likely to notice situations in which the children are unable to concentrate, such as when they are doing their homework, therefore giving higher inattentive scores for these children at risk of reading disorder.
Our study found that gender, parental education level, average family income, and children’s school affiliation exhibited statistically significant influence on reading disorder. These were in accordance with the previous reports stating that lower parental education [26] and low family income [26,27] imposed significant influence on reading disorder of students. It is interesting to note that most of the students at risk of reading disorder were studying in schools affiliated with the Office of Basic Education. This may be due to the fact that children attending these public schools come from families of lower socioeconomic status. Probable factors such as limitations in budget, number of teachers, and teaching materials may affect teaching quality. The finding that reading disorder risk varies depending on school affiliation suggests the educational need for increased support and concern for students of schools with lower affiliations.
Since these variables may be confounding factors for ADHD, we adjusted them to determine if children at risk for reading disorder were still more likely to have ADHD. The results revealed that children with reading disorder were still at a higher risk of having ADHD than children without reading disorder. The odds ratios were between 3–4 times for ADHD predominantly inattentive presentations, and 3–7 times for ADHD predominantly hyperactive presentations according to the teacher reports. The odds ratio of ADHD from parental reports showed that inattentive presentation was 2.8 times greater in children at risk of reading disorder.
There are several hypotheses trying to explain the relationship between ADHD and reading disorder. The phenocopy hypothesis [16] considers ADHD symptoms to be a consequence of reading failure. When children have reading difficulty, they face challenges in following up on lessons and then finally lose interest in classroom learning, leading to ADHD symptoms. On the other hand, inattention problems may lead to reading difficulty. Children with ADHD have difficulty concentrating in the classroom and, thus, have problems learning to read. The cognitive subtype hypothesis [14,15] is that ADHD and reading disorder may derive from the same underlying origin such as a basic brain function impairment for both attention and reading. Our research supports cognitive subtype hypothesis because we found that the proportion of children with reading difficulties who presented with ADHD was greater. They had just enrolled in compulsory education and been taught formal reading lessons for only one semester. Therefore, it seems unlikely that ADHD was a consequence of reading disorder or vice versa. We are more inclined to agree with the hypothesis that ADHD and reading disorder arise from the same cognitive domain weaknesses.
Our research appears to be the first community and schoolbased study in Thailand to determine the relationship between reading problems and ADHD symptoms in children. This is different from previous research in Thailand [28], which had examined the comorbidities of children with SLD in a hospital setting; children with SLD who come to see a hospital specialist usually have a learning disorder or troubling behavioral problems, provoking parents to bring them to see a doctor. Our study builds on other research about children with reading disorder. In a previous report, children who were classified as having reading disorder because they were less able to read words and passages than their classmates (below 10th percentile) also had more ADHD symptoms. Moreover, the relationship between reading problems and ADHD is first observed when children begin to learn to read Thai in line with the national curriculum.
Of note, there is a high probability that children with reading difficulties in grade 1 may not receive systematic assistance here in Thailand as there is still limited screening and assistance for children with SLD within the school system. Our research highlights the need to screen for reading disorder and then support these children at an early stage with assistance for reading skills. It would be helpful to also screen these at-risk children for ADHD.
Notes
Conflicts of interest
No potential conflict of interest relevant to this article was reported.
Funding
This work was financially supported by The Health System Research Institute, Ministry of Public Health, Thailand, Thai Clinical Trial Registry: TCTR20191009001.
Author contribution
Conceptualization: P.Sarisuta, IC; Data curation: P.Sritipsukho; Formal analysis: TH; Funding acquisition: P.Sritipsukho; Methodology: P.Sarisuta; Project administration: P.Sritipsukho; Visualization: P.Sarisuta, TH; Writing – original draft: P.Sarisuta; Writing – review & editing: P.Sarisuta, IC
Acknowledgements
Appreciation is given to all students and their parents, as well as directors and homeroom teachers of schools participating in this project.