Quantifying myelin in neonates using magnetic resonance imaging: a systematic literature review
Article information

Abstract
This review aimed to assess the usefulness of various magnetic resonance imaging (MRI) techniques for the quantification of neonatal white matter myelination. The Scopus, PubMed, and Web of Science databases were searched to identify studies following the PRISMA (preferred reporting items for systematic reviews and meta-analyses) statement using quantitative MRI techniques to examine samples collected from neonates to quantify myelin. Twelve studies were ultimately included. The results demonstrated that in validation studies, relaxometry is the most frequently explored approach (83.33%), followed by magnetization transfer imaging (8.33%) and a new automatic segmentation technique (8.33%). Synthetic MRI is recommended for quantifying myelin in neonates because of several advantages that outweigh a few negligible limitations.
Key message
Question: This systematic review attempts to discover the best magnetic resonance imaging (MRI) technique for myelin quantification in neonates by evaluating various MRI parameters and their reproducibility.
Finding: Since the benefits of using synthetic MRI for quantifying myelin in neonates outweigh the very minor draw-backs, it is recommended.
Meaning: The findings suggest the importance of identifying noninvasive MRI techniques available to assess myelin tissue in neonates, which aid in diagnosing neurodevelopmental disorders.
Graphical abstract. Quantitative magnetic resonance imaging (MRI) techniques to quantify myelin in neonate.
Introduction
White matter (WM) formation and myelination are essential neurodevelopmental processes. Myelination, the final stage of WM formation, is characterized by the formation of myelin, a segmented neural membrane, along the nerve fibers [1]. These fibers continue to develop throughout child- hood and adulthood in a predetermined and directional pattern called spatiotemporal development [2]. Myelination enhances the brain’s ability to send and receive information in a swift and coordinated manner that is crucial for emotional tasks, movement coordination, decision-making, and other higher-order behavioral and cognitive processes [3]. This is made possible by maturation of the myelin sheath. In vivo studies of progressive WM development beyond the age of complete somatic growth were reported in 1993, and magnetic resonance imaging (MRI) was first used to study the corpus callosum (CC) in humans [4].
Myelination peaks after birth and throughout the first year of life, which means that any incident that causes brain injury around the time of delivery or during the perinatal period may impede this process and lead to neurodevelopmental deficits later [5]. Disorders such as epilepsy [6], birth asphyxia [5], dyslexia [7], autism, attention deficit, hyperactivity, and schizophrenia [3] are being investigated for myelination issues. Moreover, injuries to the developing WM and consequent hypomyelination are common outcomes of premature birth and other perinatal insults [8].
Despite a significant need for in vivo quantitative evaluation of myelination in a wide range of clinical conditions, including most neurodevelopmental disorders, there is currently no gold standard for myelin assessment [9]. Standard MRI and diffusion tensor imaging parameters [9] can be used to assess myelination; however, these approaches provide only indirect and non-specific details of myelin content because they might also represent other tissue features.
While histological investigations were the first to characterize myelination patterns, the utility of T1- and T2- weighted MRI has been established as a preliminary alternative for qualitatively evaluating myelination in utero and shortly after birth [8]. The myelin sheath is composed of various biochemical compounds; therefore, changes in the properties of brain tissue occur according to the degree of myelination. The main difference between T1- and T2-weighted MRI images is the amount of cholesterol, which is assumed to indicate brain maturation, as changes in T1 and T2 relaxation times were linked to age in prior studies [10]. These values were used to quantify myelination disruption in preterm and term infants, which exhibit different relaxation times. One cerebral abnormality seen on MRI of preterm infants at a term-equivalent age related to extremely preterm births is abnormal myelination in the posterior limb of the internal capsule (PLIC), which may indicate developmental delay in the newborn [8].
A quantitative assessment of myelination in infants was conducted approximately 20 years ago [11]. Furthermore, cutting-edge MRI techniques have shown that they can be used to evaluate myelination in the brains of people older than 3 months, including adults. Nonetheless, these approaches have not been frequently applied to study the brains of newborns younger than 3 months of age or critically ill neonates [5]. The quantification of these myelin changes may increase our understanding of disease severity and the associated prognosis, demonstrate details regarding the spatial location of foci or lesions and the affected associated neural systems, and contribute to the development of a standard measure to assess treatment efficacy [3]. However, a quantitative assessment of myelin progression is not possible using T1 and T2 signal intensity alone. A major gap in our understanding of the neurodevelopmental discipline is, therefore, the inability to visualize and quantitatively assess myelination using MRI in human infants or neonates. This systematic review aimed to identify the superior MRI technique for myelin quantification in neonates by evaluating the efficacy and reproducibility of various MRI parameters.
Methodology
1. Review protocol
This systematic literature review was conducted in accordance with the preferred reporting items for systematic reviews and meta-analyses (PRISMA) statement. The PRISMA reporting guidelines are recommended in healthcare journals to improve the transparency and clarity of how reviews are executed while minimizing the possibility of inaccurate reporting [12].
2. Inclusion and exclusion criteria
The following inclusion criteria were used to select the studies: (1) neonates as study subjects, (2) quantitative studies involving MRI, (3) publication in 2012–2022, (4) publication in English, and (5) peer-reviewed status.
The authors included only studies of full- and preterm neonates. The authors did not exclude studies of neonates who presented with a medical illness or disease. Full-text, peer-reviewed articles published in English were selected to ensure review quality and avoid confusion and misunderstanding. Gray literature was excluded to ensure study reliability since this review focused on published articles only. This also facilitated the eligibility determination and data extraction processes, especially in the methods and discussion sections, which are lacking from the abstracts.
Infants and young children aged 12–121 months were the subjects of a study [11] that assessed the myelination of frontal lobe changes published in 2004. In 2011, the first quantitative study [13] was published on myelination in healthy human neonates aged 3–11 months. However, attempts in newborns have remained limited. Therefore, the publication timeline of 2011–2021 was selected as an inclusion criterion. Early attempts to quantify myelin content in humans experienced a number of limitations, especially long scanning times, which can result in a high specific absorption rate and are not widely available [14], which is not ideal for implementation in neonatal scanning. Another significant drawback of the early studies was achieving good image resolution, owing to the low myelin content present in the neonatal brain [15]. Furthermore, this review aimed to indirectly assist in determining which methods are available and suitable for addition to the baseline MRI protocol in clinical settings.
3. Systematic searching strategies
We conducted a systematic search of the Scopus, PubMed, and Web of Science databases. The Scopus and Web of Science databases have the potential to be leading databases in a systematic literature review owing to their sophisticated search capabilities, comprehensiveness (indexing more than 5,000 publishers), control over article quality, and multidisciplinary focus, which includes environmental management studies [16,17]. In contrast, one significant feature of PubMed that its contents are not replicated by Scopus or Web of Science and is readily updated with literature that has been presented online in an early edition before print publication by a variety of journals in addition to literature that has been printed [18]. The search processes in these 3 databases retrieved a total of 397 open-access articles.
Keywords included Medical Subject Headings terms and text words developed from the authors’ discussion, keywords suggested by Scopus, an online thesaurus, and past literature. The searches included all meaningful combinations of the following terms: (1) myelin (WM), (2) MRI, and (3) neonates (newborn or infant). The authors enriched the existing keywords and generated comprehensive search strings (based on the Boolean operator, phrase searching, truncation, wild card, and field code operations) in the 3 databases.
This study screened all 397 selected articles by selecting the criteria for article selection, which were performed automatically based on the sorting function available in the databases. Another 3 studies were identified and manually added to one of the selected articles. The selection criteria were based on the population or patient, intervention, comparator or control, and outcome (PICO) framework or the research question. Since it would be nearly impossible for authors to review all published papers, results from a study by Okoli [19] were used to define the range of time that the authors could review. Because the search process began on May 1, 2022, and ended on July 31, 2022, and the year had not yet ended, the search was limited to 2021. As a result, the period of 2011–2021 was chosen as an inclusion criterion for the search strategy.
During the first screening process, 173 duplicate articles were removed. Ninety articles were excluded after the title screening, while 25 articles were excluded during the abstract screening. After a thorough full-text screening process, 100 articles were excluded for not fitting the PICO framework or research questions. Studies were excluded if nonneonate subjects were involved (e.g., adults, animals, and cadavers), insufficient or nonquantitative techniques involving MRI for the myelin assessment were used, or full-text articles were unavailable. Histology was used to study myelination during infancy; however, postmortem data cannot determine the longitudinal course of WM development [20]. Atlas-based analyses, review articles, structural segmentation, and scoring system establishment studies were excluded. The remaining 12 articles were subjected to the eligibility process in which the authors carefully monitored the retrieved literature to ensure that all met the requirements.
4. Quality appraisal
Two authors employed the Quality Assessment of Diagnostic Accuracy Study 2 (QUADAS-2) tool to evaluate the methodological quality of the studies included in this review [21]. The tool includes 14 questions used to assess the risk of bias and applicability in terms of patient selection, index test, reference standard, and flow and timing domains. The risk of bias for each domain was rated as low, unclear, or high. The total risk of assessment was determined by evaluating all areas and quality of each study. The index test for this review was MRI, and the reference standard was myelin. Bias assessment for reproducibility studies consisted of the same methods used for quantifying myelin except for the reference standard from the QUADAS-2 instrument. If many questions in a study scored positively in that domain, the study was considered to have a low risk of bias in that domain. The risk of bias was generally low across all included articles (Table 1).
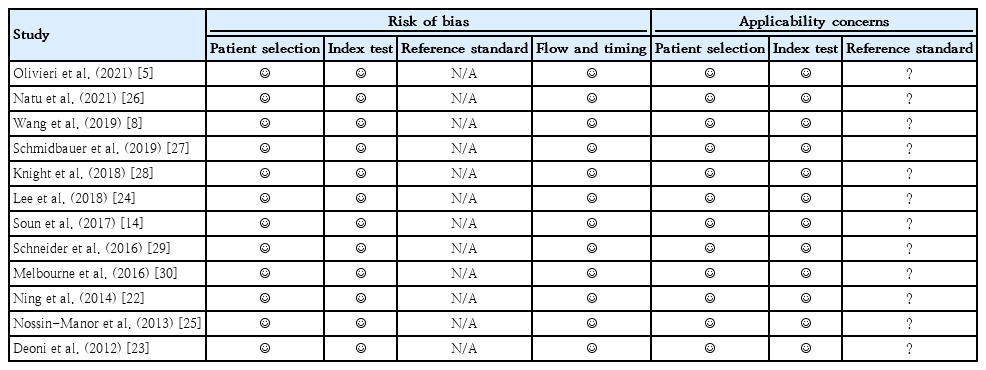
Quality assessment of diagnostic accuracy study 2 assessment results
Results
1. Study identification and selection
Fig. 1 summarizes the search results. Of the 397 primary data articles, 173 were duplicates. Subsequently, 115 irrelevant articles were removed based on the title and abstract screening. In addition, 100 articles were excluded after the full-text screening because of noncompliance with the research question. Another 3 studies by Olivieri et al. [5] were deemed compliant with the PICO framework or research question [14,22,23] and added manually. Consequently, 12 studies fulfilled the inclusion criteria and were included in the data analysis [5,8,14,22–30]. Overall, the selected studies had a low risk of bias.
PRISMA (Preferred Reporting Items for Systematic Reviews and Meta-Analyses) flowchart.
2. Data extraction
The data extracted from the studies included author names, study location, study period, study design, sample size, sex, average gestational age, gestational age at MRI, MRI modality, MRI metrics, scanning time, and findings. Table 2 shows these variables. Table 3 summarizes the advantages and limitations mentioned in each study as well as the quantitative MRI sequence or technique and software or postprocessing methods used therein. Two authors independently selected the studies to review, extract, and analyze the data and evaluated the quality of each investigation. Overall, all studies provided adequate findings for quantifying myelin in neonates.

Data extracted from the literature regarding the main variables of interest

Summary of advantages and limitations of studies included in the systematic review
The frequency of each region of interest (ROI) mentioned in the studies was calculated (Table 4). These locations represent regional variations in the maturation process of the developing brain. The PLIC is the most frequently mentioned ROI in the literature (83.33% of all relevant studies), followed by the CC (genu and splenium) at 66.67% and optic radiation at 58.33%. Imaging and histological investigations indicate that by term birth, the PLIC is generally highly myelinated compared with other structures; however, the optic radiation possesses low levels of myelin [2,31-35].

List of regions of interests (ROIs) from the literature and how often they were mentioned
3. Data synthesis
Olivieri et al. [5] enrolled neonates with neonatal encephalopathy as well as healthy term neonates as controls. Schmidbauer et al. [27] included neonates with hypoxic-ischemic encephalopathy, intraventricular hemorrhage, or epileptic seizures as the study subjects. Knight et al. [28] included groups at an increased risk of developing neurodevelopmental disorders. Meanwhile, the remaining studies [8,14,22–26,29,30] recruited only cerebral low-risk neonates with no history of neurological conditions and excluded those with abnormalities detected on MRI or ultrasound.
The scanning time for the particular quantitative MRI sequences was less than 5 minutes in 3 studies [5,22,29], more than 5 minutes in 5 studies [23-25,29,30] and not mentioned in another 4 studies [8,14,28,30]. The acquisition time is a concern in neonatal imaging because of the risk of heat and motion artifacts [36].
A few selected studies excluded some of the data owing to low image quality due to motion artifacts and significantly devastated brain structures [27], and because of extensive lesions on brain MRI, death, withdrawal of consent, or abnormal neurologic examination findings at term-equivalent age [29]. Some subjects failed to produce usable data [26] because they were unable to remain asleep after the MRI sequences commenced. Meanwhile, one study excluded a few subjects because some of them had abnormal cerebral ultrasonography findings and patient movement rendered the diffusion or relaxometry acquisitions unsatisfactory [30]. Another study eliminated some images with pronounced motion artifacts from the final analysis [24].
Discussion
The findings show that relaxometry (83.33%) is by far the most frequently investigated approach in validation studies, followed by magnetization transfer imaging (MTI) (8.33%) and the novel automatic segmentation technique (8.33%). A brief description of the general concepts of relaxometry, MTI, and automated segmentation techniques is provided in Table 5.

Overview of relaxometry, magnetization transfer imaging, and automated segmentation technique
1. Relaxometry
Standard MRI images are qualitative, and the signal intensity depends on the number of complementary contrast mechanisms altered by the MRI hardware and software.Without a quantitative metric for the absolute analysis of pixel signal intensities, independent of scanner hardware and sequences, comparing MRI images from various individuals or from different parts of the same individual's body is difficult. Quantitative relaxometry separates the effects of each MRI contrast mechanism (T1, T2, and T2*), generates maps that are unaffected by the MRI protocol, and has a physical meaning that is often expressed in absolute units. Quantitative relaxometry not only provides an unbiased way to compare MRI scans but also uses the relationship between MRI maps and physiology to offer a noninvasive alternative to histology and biopsy.
1) T1
T1, the longitudinal relaxation time, is a time constant that represents the time required for magnetization to return to its initial state after being shifted [37]. This recovery is affected by the change in the magnetic fields of the atoms around it at the proton resonance frequency. Because of its proximity, the proton next to the water molecule is typically the main source of fluctuations. The random spinning of the water molecule, which is described by the rotational correlation time, changes the angle between the protons over time, which causes magnetic fluctuations. The T1 relaxation due to this interaction occurs most quickly when the rotational correlation time is equal to the inverse of the proton resonance frequency. Similarly, protons in lipids, especially triglycerides, are affected by protons close to them. Because the protons in lipids do not move as much, there is usually more energy at the proton resonance frequency. This shortens the T1 of the lipids. Therefore, T1 shows how mobile the molecules are (mostly water protons) and how tightly they are bound to macromolecules. T1 is mostly used to measure the macromolecular content, water binding, and water content in a number of diseases, such as inflammation and changes in the amount of myelin in the brain.
Schneider et al. [29] conducted a serial imaging investigation of preterm infants with low cerebral risk, aimed to establish reference values for T1 relaxation time, and evaluated the hypothesis that its evolution is equivalent to that of the apparent diffusion coefficient (ADC) and fractional anisotropy (FA) values, thus providing more accurate information about tissue structure. Magnetization prepared dual rapid acquisition of gradient echo, which was used in their study as a recently developed technology obtains a purely T1-weighted image and enables the generation of whole-brain T1 tissue relaxation time maps for quantitative tissue characterization [38]. The descriptive properties of T1 relaxometry are of particular interest in the preterm group because they provide structural information about tissue, such as water content and lipid and macromolecule composition, as well as predict the chronological maturation of myelin and can be regarded as one of the best markers of brain maturation. In the WM fiber tracts (PLIC, optic radiation, and corona radiata), the linear drop in ADC and T1 represented a reduction in water content, fiber packaging, and early myelination processes, particularly in the PLIC after 36 weeks. The T1 relaxation levels (milliseconds) measured in the PLIC matured rapidly compared to those in each other ROI.
In another study, Natu et al. [26] quantitatively examined T1 in 4 key sensorimotor regions. An inversion recovery-echo planar imaging (IR-EPI) sequence was used to measure the relaxation time (R1) at every voxel, an IR-EPI sequence was utilized. Spoiled gradient echo images were used in conjunction with EPI sequences to produce synthetic T1-weighted whole-brain images. R1 (R1=1/T1) was estimated for each voxel using the IR-EPI data. Contrary to the assumption that visual areas are already myelinated at birth [39], their investigation of R1 indicated that while the primary visual cortex (V1) is more mature than other visual areas at birth, it continues to develop and myelinate extensively over the first 6 months of life. Second, contrary to the belief that primary sensory-motor regions (such as V1) also myelinate the swiftest postnatally [39], an evaluation of the rate of R1 development during the first 6 months of life demonstrates that V1 does not myelinate the fastest in the human visual system. Despite having lower values at birth, R1 across several visual areas catches up to R1 in V1 by 6 months of age. The third finding was that microstructural development differed throughout the visual hierarchy. Thus, at birth, the higher visual areas of the ventral and dorsal streams had lower R1 values and were presumably less myelinated than the early retinotopic areas.In contrast, the development of R1 (and subsequently myelin) was increasingly rapid in later visual areas than in earlier areas.
2) T1/T2 ratio
Soun et al. [14] evaluated the ratio intensity values in 10 term neonates with no injury and hypothesized that the values may be sensitive to hyperintensities such as those observed in neonates with encephalopathy who experience injury. The T1/T2 ratio approach emphasizes the natural contrast of myelin [40]. The superimposition of opposing features of T1 and T2 weighting was used in this ratio method. The T1/T2 ratio has the advantage of enhancing the WM contrast-to-noise ratio without increasing scan time. Furthermore, the T1/T2 ratio may differentiate between highly and lightly myelinated cortical areas, implying that this technique can be utilized to investigate spatial variation in myelin formation in the neonatal brain. While no patient in their study population was known to have hypoxic-ischemic injury, the undiscovered subthreshold effects of hypoxia may have increased the T1 signal intensity in the PLIC and been mistaken as myelin tissue.
Owing to the rapid development of the brain during the first few months after birth, significant regional differences occur in myelin density. Their findings corroborate prior research indicating that the PLIC is highly myelinated by term birth, whereas the optic radiation is not fully myelinated [2]. According to these studies, despite variations in tissue characteristics between neonates and adults, the T1/T2 ratio indicates myelin density.
Coregistration is necessary for sequence comparison. The T1 and T2 images exhibited moderate misregistration abnormalities, particularly at the cerebrospinal-gray matter interfaces. These abnormalities may lead to incorrect contrast increases that could be mischaracterized as a myelin-related disorder. The T1/T2 ratio, if proven successful, could enhance the ability to detect myelin impairment in the developing brain. Additionally, because this approach uses routinely acquired diagnostic sequences, it does not require any extra scan time, which is critical in the neonatal population, in which movement is a major contributing factor to image quality.
3) T2* and R2*
Susceptibility-weighted imaging detects phase shifts and improves the visibility of iron, calcifications, veins, and blood byproducts based on paramagnetic or diamagnetic characteristics [41-43].
Relaxation time T2* is susceptible to deoxyhemoglobin, water content, and iron levels, with an even higher sensitivity than T2.It has been utilized to analyze brain function (due to changes in deoxyhemoglobin levels), myocardial oxygenation, tumor hypoxia, hemorrhage, cardiac calcification (low water content), and liver and cardiac iron [37]. Several studies [22] have found a correlation between T2* values and myelin content, which reflects nuclear interactions and field inhomogeneity due to the presence of paraor diamagnetic substances in iron and myelin. However, the neonatal brain is less likely to have high concentrations of iron and calcium because myelin is most likely the primary contributor to T2* values in the neonatal brain. The differences in susceptibility between myelin and most other water-based tissues result in signal intensity degradation in T2*-weighted imaging, which causes brain regions with higher myelin content to appear darker [41].
Although susceptibility- and T2*-based methods are primarily used to detect calcium deposition, measure iron content, and image hemorrhagic infarcts in adults [44], numerous studies have reported that myelin content is the primary contributor to T2* decay [22], particularly in neonates who are less likely to have high concentrations of iron and calcium. Considering the multifactorial nature of T2*, several studies suggested that myelin content may be the most significant contributor to this signal [22].
Olivieri et al. [5] employed T2* mapping to study brain myelination in healthy neonates and those with NE throughout the first month of life. Their findings support previous histopathological studies reporting that T2* values were significantly higher in neonates with NE who developed injury in the PLIC, thalami, and lentiform nuclei, which are actively myelinated around the time of term birth and in the month thereafter [45]. Higher T2* values indicate a lower myelin content, while lower T2* values indicate a higher myelin content.In addition, this approach has a high signal-to-noise ratio (SNR) and a short scanning period of less than 4 min, allowing it to be readily implemented in baseline procedures for imaging healthy and critically ill neonates.
Ning et al. (2014)22) used a variant of this technique called enhanced T2*-weighted angiography, which focused on R2* values (R2*=1/T2*) to analyze the myelin content in term-born healthy infants who were approximately 3 months old at the time of MRI. They found that R2* values in the gray nuclei and WM were positively associated with postmenstrual age. The phase values of the PLIC and splenium of the CC were substantially greater than those of the anterior limb of the internal capsule (ALIC) and genu of the CC in neonates. However, they mentioned that, owing to infants’ greater brain water content and significantly lower iron concentration, the boundaries of many brain regions are insufficiently distinct for automated segmentation and registration. In addition, they have more brain water than adults, which diminishes with age. Reduced water fractions may have influenced the change in R2* value with age [45].
4) Myelin-water fraction
The T2 relaxation time is susceptible to tissue composition and structure as well as iron and water content. It has been used to evaluate myelin content in the brain; inflammation, collagen composition, and structure of the cartilage and heart muscle; and edema, hemorrhage, and iron content in the heart and liver [37]. A multicomponent analysis of T1 and T2 relaxation, known as multicomponent relaxometry, may offer a more specific indicator of myelin maturation [46]. A T2 decay analysis of the brain parenchyma revealed at least 2 discrete microanatomical water domains: a rapid-relaxing water pool normally related to water bound in the lipid bilayers of the myelin sheath and a slower-relaxing water pool pertaining to water within and outside of the myelinated axon [46].
The myelin-water fraction (MWF) is a quantitative T2 measurement that enhances the pathological specificity of myelin breakdown [47]. The MWF is estimated using a multiexponential T2 fit, with a short T2 component (10–50 msec) attributed to water trapped between the myelin sheaths. Histopathology has established an association between MWF and myelin loss [48]. Myelin content can be measured indirectly by measuring the myelin-bound water signal or MWF, which correlates well with the results of histological evaluations [48].
Multicompartment T2 relaxometry has been used [30] to assess myelin by quantifying the increase in MWF in the thalamus and posterior WM (PWM) areas; the increase in the thalamus is significantly greater. In the thalamus, the overall change in T2 values was attributable to an increase in myelination, whereas in the WM, the change was associated with a decrease in free water content and an increase in tissue volume. In the PWM, the amount of myelin measured was rather insignificant, and the main change was tentatively attributed to (unmyelinated) axonal and glial proliferation confirmed by T2 relaxometry. Results from the WM PLIC and ALIC demonstrated axonal and myelin density differentiation, with high MWF values in the PLIC and significantly lower values in the ALIC.
Meanwhile, Knight et al. [28] found that T2 is longer in extremely preterm newborns than in late preterm infants across many WM regions, and these effects are particularly pronounced in WM regions that myelinate earlier and rapidly. Deoni et al. [49] further established the use of multicomponent relaxometry in the investigation of infant brain development, demonstrating qualitative agreement between MWF trends acquired from magnetic resonance (MR) and spatiotemporal myelination patterns found by histology. Deoni et al. [23] assessed myelin content in healthy infants aged 3 months to 7.5 years using a new multicomponent relaxation approach called multicomponent driven equilibrium single-pulse observation of T1 and T2. Despite its superior resolution, this method is not ideal for neonatal patients owing to the lengthier scan periods [14], making it more challenging to incorporate into the baseline MRI procedure in a critically ill neonate population. Concerns have recently been raised regarding its accuracy [50].
However, a significant disadvantage of this technique is its relatively poor SNR [15], which makes imaging more difficult because of the low myelin concentration in the neonatal brain. Until recently, obtaining MWF maps in clinical practice was challenging because acquisition was limited to a single slice and the scanning time was unduly long [37].
5) Synthetic MRI
Specific parameters, such as the T1-relaxation constants, T2-relaxation constants, and proton density (PD) of the studied tissue, can be measured using the quantitative multidynamic multiecho (MDME) sequence which acquires all the required parameters for image postprocessing in less than 6 minutes [51]. Since the repetition time, echo time, and inversion time are all extrinsic scan parameters that can be established and adjusted postprocessing, they are not predefined in this method [52]. T1-weighted, T2-weighted, PD-weighted, and inversion recovery contrasts can all be produced from SyMRI in less than 1 min after intrinsic tissue parameters have been collected and extrinsic scan parameters have been specified [51].
Lee et al. [24] and Schmidbauer et al. [27] used a vendor-provided tool (SyMRI 8.0; SyntheticMR, Linkoping, Sweden) to construct quantification maps (T1, T2, and PD maps) simultaneously from raw data acquired by the MDME sequence. Using the MDME pulse sequence, the partial volume of myelin was calculated using R1, R2, and PD [53].
The SyMRI software generates maps relying on T1- and T2-relaxation constants and the PD, which vary among different tissues [46]. This permits the imaging of various tissue types and the quantification of myelin, resulting in a more accurate evaluation of brain development and demyelinating disorders [54]. Using quantitative maps, myelin could be better differentiated from non-myelinated gray and WM than on conventional images.
The SyMRI software automatically calculated the total estimated myelin partial volume (Msum) and the ratio of Msum to the total brain parenchyma [24]. T1 and T2 of the WM areas were extremely high at birth, with maximum values of approximately 2,600 msec and 280 msec, respectively; however, these values reduced by more than half in the first year of life.
Time is a crucial factor in clinical settings. Even using current techniques, conventional approaches for MR mapping would take 15–30 minutes [51]. Beyond the neonatal brain imaging technique, SyMRI is a quantitative imaging technique that detects myelination-related changes on an individual level. In addition, it typically reduces the examination time while offering several MR contrasts such as T1, T2, PD, and inversion recovery. Thus, SyMRI enables the generation of quantitative maps and different MR contrasts in one-third of the time required by typical quantitative mapping methods. Recent evidence indicates that SyMRI imaging data are equivalent to those of conventional T1 and T2 images [52]. In addition to standard MR contrasts, SyMRI enables the rapid generation of quantitative MR maps [51]. This suggests new avenues in diagnostic neonatal brain imaging.
2. Magnetization transfer imaging
MTI is an MRI technique that was developed to investigate the properties of nonwater tissue components. The MTI theory considers the influence of additional parameters, namely those reflecting the exchange of protons between water molecules and molecules of more solid structural components. Consequently, MTI can reveal tissue structures and structural components that are typically not discernible using standard MRI. This theory assumes that the spin magnetization of tissue macromolecular components can be indirectly observed by observing the normally visible spins of tissue water. The magnetization transfer ratio (MTR) is an adjusted index derived from 2 MR images that reflect the degree of magnetization transfer. The MTR is a semiquantitative marker of myelination in the brain in its most basic form [55].
During axonal myelination, the ratio of free and bound water molecules is assumed to represent the myelin content [57]. However, some studies have highlighted the contentious results achieved by applying MTR to measure myelination. Myelination was found to be inaccurately described MTR values in an experimental mouse model of autoimmune encephalomyelitis, which is characterized by lymphocyte-mediated inflammation followed by demyelination, axonal degeneration, and neuronal loss and did not correlate with the histopathological myelin content according to one such study [55]. Based on these and other findings [55], the MTR approach may be more sensitive to inflammatory diseases than myelination and demyelination.
3. Automatic segmentation technique of myelin-like signals
Numerous advancements in radiology have been attributed to interdisciplinary collaborations in the field of engineering. A significant example is the application of segmentation techniques to analyze different anatomical structures within medical imaging data, thereby enhancing the diagnostic potential of such images. Using T2-weighted MRI, Wang et al. [8] presented quantitative measures of myelination patterns in preterm infants with a gestational age of 29–44 weeks. Based on an innovative automatic segmentation method for myelin-like signals (MLSs) on T2-weighted MRI, Wang et al. [8] developed a quantitative marker for myelination to assess preterm neonatal brain development. On T2-weighted neonatal brain MR images, they referred to the tissue that was likely to consist of myelin as MLS.
To create quantifiable markers of myelination, the suggested segmentation method was applied to T2-weighted scans of 114 preterm newborns. First, they performed a volumetric examination of the progression of myelination and demonstrated that myelination increases in regions of the deep brain while remaining unchanged in the brainstem. Second, they constructed a spatiotemporal model of myelination progression and compared it to qualitative studies of myelination [58]. In conclusion, they demonstrated that the spatiotemporal atlas of progressive myelination may accurately predict gestational age at the time of the scan and, thus, make a possible quantitative diagnosis of developmental delay.
Developing an automatic approach for segmenting MLS, which can then be used in volumetric analyses and spatiotemporal modeling of progressive myelination, is a strategy for developing quantitative indicators of myelination. Automatic MLS segmentation is difficult and there are currently no dedicated techniques for segmenting MLS throughout the preterm and neonatal periods. In the NeoBrainS12 challenge [59], recently developed approaches for neonatal brain segmentation showed great potential for segmenting a variety of brain structures on neonatal brain MR images. However, none of these methods perform well in terms of myelination segmentation. Most neonatal brain segmentation algorithms use a probabilistic atlas or manual annotations to collect previous knowledge of the estimated tissue placement as developed for adults. However, myelin is not included in any available neonatal brain atlases or manual annotation databases, nor was it considered in the development of the Human Connectome Project [60] segmentation technique. Another issue that causes correct segmentation of the MLS in the prenatal stage is its low volume compared to MRI resolution. Therefore, the partial volume effect (i.e., mixing 2 or more tissues in a single voxel) must be considered. Many approaches for partial volume modeling have been proposed; however, they all require prior knowledge of the site of tissue mixing, which is currently unavailable for MLS.
Although the segmentation method [8] provides a quantitative assessment of the volume of myelinated tissue, it cannot quantify the myelin fraction in each voxel. Quantitative approaches such as relaxometry and MTI can generate more precise measurements of myelin maturation if substantial databases in this age range are obtained.
Conclusion
A comprehensive review of research that validates the quantification of myelin using MRI to consolidate the existing knowledge on neonatal subjects has been provided. From the authors’ viewpoint, SyMRI holds great potential in pediatrics for visualizing the developing brain because contrast images can be optimized post-scanning [54]. In addition, the maps generated using this technique are coregistered because of the simultaneous quantification of R1 and R2 relaxation rates and PD. A significant advancement over conventional quantification approaches that require separate scans of each dataset has been observed. SyMRI offers the potential to reduce the overall MRI scan time, particularly when multiple contrast-weighted images are required, which is common in clinical practice. It has the potential benefit of a shortened scan time, especially for pediatric or uncooperative patients. SyMRI is not widely used in clinical settings because of its postprocessing time. However, using the SyMRI software, postprocessing required less than 1 min. A fast processing time is a clear benefit for clinical application. A quick scanning time is essential for neonatal imaging and reduces the need for sedation. Thus, considering all of these factors, researchers favor SyMRI as the most ideal and versatile approach for quantifying myelin in neonates.
Notes
Conflicts of interest
No potential conflict of interest relevant to this article was reported.
Funding
This study received no specific grant from any funding agency in the public, commercial, or not-for-profit sectors.
Acknowledgements
Nabila Hanem contributed considerably to this project. It is a pleasure to acknowledge the help and encouragement received from many people during the preparation of this review article, in particular Assoc. Prof. Dr. Hasyma, who suggested the idea and provided endless support reviewing our work.