Instability of revised Korean Developmental Screening Test classification in first year of life
Article information
Abstract
Background
Early development is characterized by considerable variability.
Purpose
This study aimed to examine the stability of developmental classifications using the revised Korean Developmental Screening Test (K-DST) in healthy term infants aged 4–6 and 10–12 months.
Methods
Data were obtained from the Korean Children’s Environmental Health Study, a nationwide prospective birth cohort. Sixty-nine healthy term infants (26 boys, 43 girls) underwent serial K-DST assessments at 4–6 and 10–12 months of age, between August 2017 and December 2019
Results
At 4–5 months, over 50% of infants were categorized in the ≥-1 standard deviation (SD) group, with the lowest prevalence in the gross motor domain (52.7%). Seven infants (10.1%) scored below -2 SD in at least one domain, most commonly in gross and fine motor domains (7.3%). At 10–12 months, over 70% of infants scored in the ≥-1 SD group, except in the language domain. Six infants (9.5%) scored below -2 SD in at least one domain, (cognition 4.8%, language 3.2%, gross motor 3.2%). Serial follow-up showed significant improvement, with many infants moving to the ≥-1 SD group, particularly in the gross motor domain (33.3%). Of the seven infants scoring below -2 SD at 4–5 months, only two remained in this category at 10–12 months.
Conclusion
Infants scoring below -2 SD on the revised K-DST 4–5 months questionnaire, especially in the gross motor domain, should undergo close monitoring and repeated evaluations in the absence of neurological abnormalities or developmental red flags.
Key message
Question: How stable are the revised Korean Developmental Screening Test score classifications in early infancy?
Finding: A significant number of infants improved into the peer and high-level group (≥-1 standard deviations), especially in the gross motor area.
Meaning: The early detection of developmental delay requires a comprehensive medical history, physical and neurological examinations, and repeated developmental screenings.
Introduction
Developmental issues during infancy or early childhood can lead to learning difficulties or behavioral issues in school-age children, subsequently impacting the quality of life during adolescence and later [1]. Developmental delay (DD) is defined as a slower rate of milestone acquisition than what is normally expected. Global DD (GDD) is a significant DD (performance of 2 standard deviations [SDs] or more below the mean on age-appropriate, standardized norm-referenced testing) in 2 or more domains affecting children under the age of 5 years [2]. DD is one of the most important health issues among children; although the exact prevalence of DD is unknown, GDD are reported to occur in 1% to 3% in children under 5 years old [2]. The World Health Organization estimated that 8% of all children under 5 years of age have some types of developmental deficit [3].
Developmental domains include gross or fine motor skills, speech and language, cognition, personal-social skills, and activities of daily living. DD can develop within various domains, which are not mutually exclusive. It is not unusual for delays in one of these domains to go unnoticed [4]. During early childhood, the brain exhibits plasticity, therefore, early detection of DD and proper interventions can reduce the chances of future developmental disorders and prevent secondary sequelae [1,5,6].
The Korean Developmental Screening Test (K-DST) is conducted as part of the national health screening program for Infants and Children (NHSPIC) for the early detection of DD. K-DST is a screening tool completed by caregivers and is indicated for infants and children between the ages of 4 and 71 months. The first edition of K-DST was revised in 2017, which showed high sensitivity and specificity [6,7]. In the NHSPIC, K-DST is first performed from 9 months of corrected age. Therefore, there is limited KDST data from infants younger than 9 months.
During the first years of life, children attain basic neurodevelopmental achievements at an impressive speed. Although neurodevelopment follows a predictable course, the developmental pathways are influenced by continuously interacting biomedical and sociocultural factors [8]. Screening for DD is based on the assumption that early delays in development predict later delays. However, early development is characterized by considerable variability [9]. Even when DD is suspected, many develop normally. Appropriate follow-up is essential based on the accurate experts analysis [10].
Therefore, we investigated the stability of the DD classification obtained from the revised K-DST score from 4–6 to 10–12 months age in healthy term infants.
Methods
1. Study participants
This study is based on the Korean Children’s Environmental Health study, which is a nationwide prospective birth cohort study designed to investigate environmental factors on various health outcomes. The details of the study design have been described elsewhere [11]. Sixty-nine infants (26 boys and 43 girls) had taken underwent 2 serial K-DST assessments at 4–6 months and 10–12 months of age during the period between August 2017 and December 2019. All of them were full-term infants, born between 37 and 41 weeks of gestation. They had and with a birth weight greater than 2.5 kg. Mean birth weight was 3241.3±310.1 g. All infants’ Apgar scores at 5 minutes was in the 9–10 range. They had no gestational and delivery complications, cardiac, respiratory, or neurological problems. All infants were free of diagnosed with any conditions throughout this study.
2. Study design
K-DST is a parent-reported screening test. The participants take the test papers according to their corrected age at the time of their clinic visit. K-DST is a set of 8 age-specific questions for each domain. The cutoff points consist of scores corresponding to 1 and 2 SD; domain scores below -2 SD correspond to ‘recommendation for further evaluation (suspected DD, SDD),’ while those between -2 SD and -1 SD correspond to ‘need for followup,’ scores above -1 SD correspond to peer- and high-level [6].
At the beginning of the study, K-DST first edition was used; since a revised version was published, the K-DST revised edition [12] was used from April 2018. In the K-DST revised version, the cutoff points were changed compared to the first version of K-DST, but there were no significant differences in the contents of questions; therefore, all results of evaluations made using the K-DST first edition were re-analyzed by applying the revised K-DST cutoff.
Korean Bayley Scales of Infant Development II were conducted on infants who had a K-DST score below -2SD. Mental Development Index (MDI) and Psychomotor Development Index (PDI) were used both as a continuous variable (mean±SD, 100±15) and as a categorical variable. A significant and mild delay were defined as an index score <70 and 70–84, respectively. Score ≥85 were considered normal. In MDI, the individual scores for language and nonverbal cognitive abilities were not separated [13].
3. Statistical analyses
Discrete data are presented as frequencies and percentages. The associations between the proportion of infants in each revised KDST score category in each developmental domains and gender was investigated using chi square tests. A P value <0.05 was considered statistically significant. The data were analyzed using IBM SPSS Statistics ver. 23.0 (IBM Co., Armonk, NY, USA).
4. Ethnics statement
This study protocol was reviewed and approved by the Institutional Review Board of Daegu Catholic University Medical Center (approval No. CR-16-009). Written consent forms were obtained from the parents of the children in accordance with the Declaration of Helsinki, and patient confidentiality was protected.
Results
At the first visit at 4–6 months of age, 55 infants were assessed by the K-DST 4- to 5-month questionnaire, while the remaining 14 infants were assessed by the K-DST 6- to 7-month questionnaire. At the second visit at 10–12 months of age, 63 infants’ development were assessed by the K-DST 10- to 11-month questionnaire, while the remaining 6 infants were assessed by the K-DST 12- to 13-month questionnaire (Table 1).

Demographic data of the participating infants at 4–6 months (1st visit) and 10–12 months (2nd visit) of age
1. K-DST results
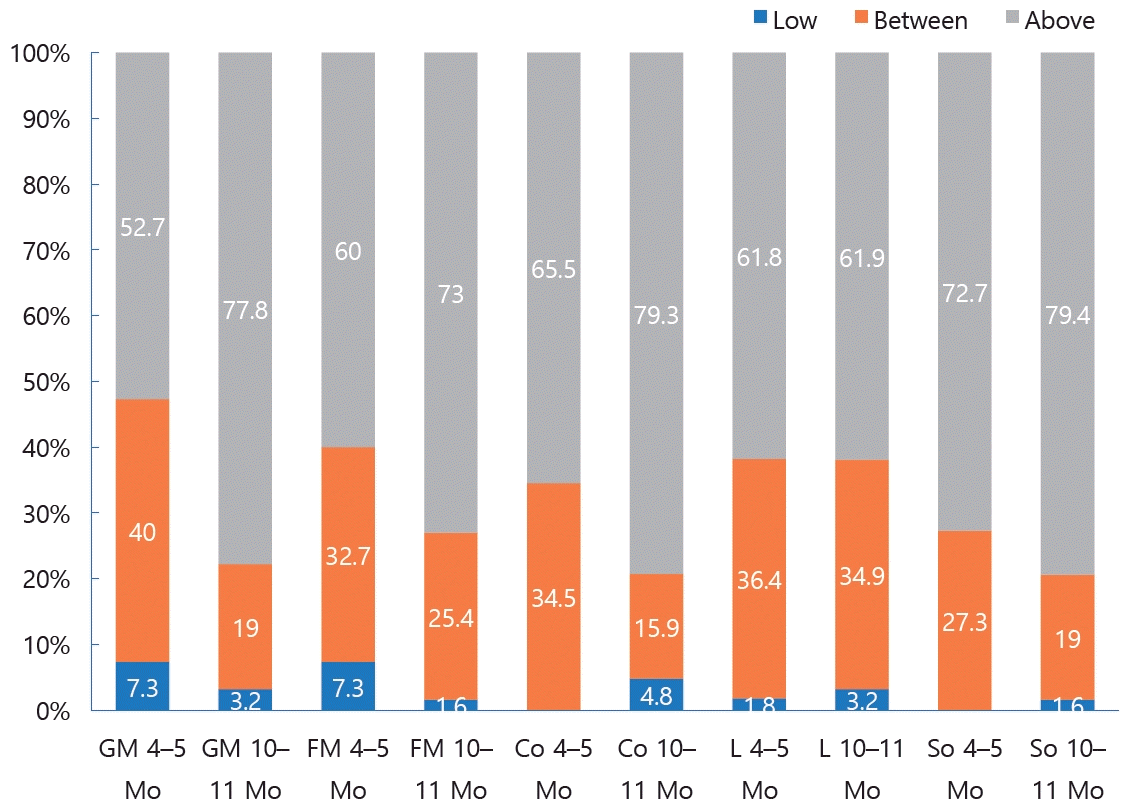
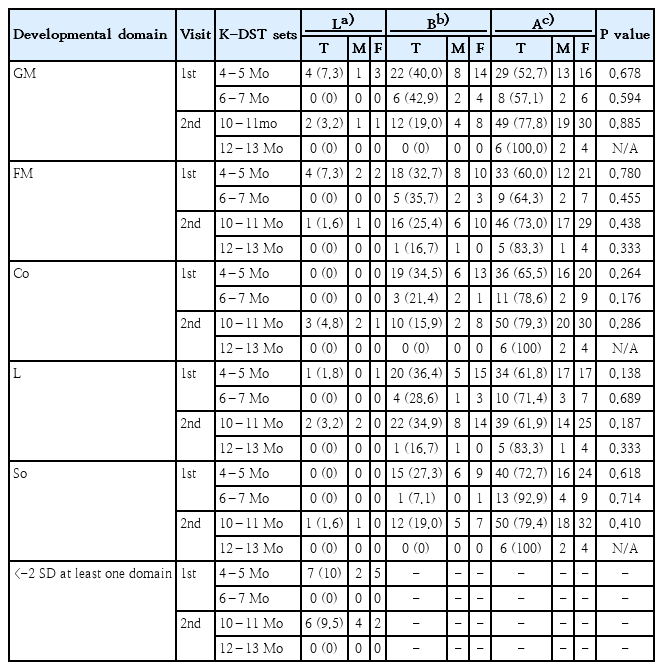
According to the revised K-DST cutoff points, we divided into 3 categories: score below 2 SD, score between -2 SD and -1 SD, and score ≥ -1 SD. Among 4–5 months old infants, more than 50% were categorized into the ≥-1 SD group. The lowest prevalence (52.7%) was found in the gross motor domain (Fig. 1). Seven infants (10.1%) scored below -2 SD in at least 1 domain (Table 2). The prevalence of scored below -2SD was 7.3% in the gross and fine motor domains, and 1.8% in the language domain at 4–5 months. Among the 10–11 months old infants, more than 70% were as categorized into the ≥-1 SD group, except in the language domain. This prevalence was increased compared to the 4–5 months evaluation. Six infants (9.5%) scored below -2 SD in at least 1 domain. The prevalence of scores below -2SD was 4.8%, 3.2%, 3.2%, 1.6% in the cognition, language, gross motor, and fine motor domains, respectively. There were no significant associations between the proportion of infants classified according to the revised K-DST cutoff points in the 5 developmental domains and gender (Table 2).

Proportion of infants in each group according to revised K-DST cutoff points at 4–5 months and 10–11 months of age. Values are presented as percentages (%) of participants. GM, gross motor; FM, fine motor; Co, cognition; L, language; So, social interaction. Low, score below -2 SD corresponds to ‘recommendation for further evaluation (suspected developmental delay)’; Between, score between -2 SD and -1 SD corresponds to ‘need for follow-up’; Above, score above -1 SD corresponds to ‘peer- and high-level’.
2. Serial follow-up from 4–6 to 10–12 months
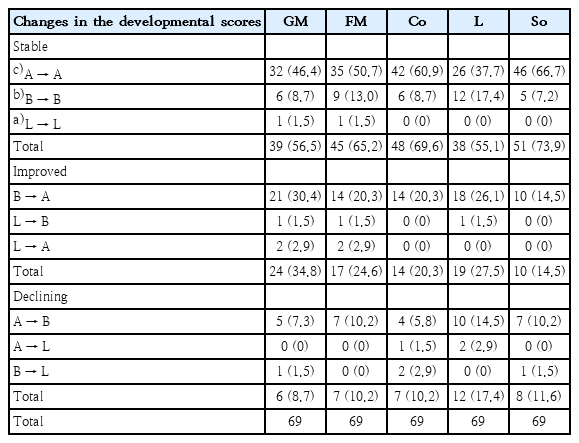
The serial follow-up results from 4–6 months to 10–12 months showed important differences. More than half of infants showed a generally stable developmental pathway, and a significant number of infants improved into the peer and high-level group (≥-1 SD), especially in the gross motor domain (33.3%). There were infants showing a decline or newly screened as delayed, especially in the language area (17.4%) (Table 3).
Among 7 infants, who scored below -2 SD in at least one domain, at 4–5 months, 2 persisted in the below -2 SD group at 10–12 months. These 2 infants' MDI and PDI of BSID-II were both below 70. The remaining 5 infants showed the improvement of DD or were newly screened as having DD in a different domain than before. All but one of these 5 infants’ PDI were above 70. Their MDI showed variable results from below 70 to above 85 at 10–12 months.
Discussion
In this study, at 4–5 months, over 50% of infants were categorized into the ≥-1 SD group, with the lowest prevalence (52.7%) in the gross motor domain. Seven infants (10.1%) scored below -2 SD in at least 1 domain. The prevalence of scores below -2 SD was 7.3% in the gross motor and fine motor domains. At 10–12 months, more than 70% were categorized into the ≥-1 SD group, except for language. Six infants (9.5%) scored below -2 SD in at least 1 domain. The prevalence of scores below -2SD was 4.8%, 3.2%, 3.2% in the cognition, language, and gross motor domains, respectively. The serial follow-up results from 4 to 12 months showed that a significant number of infants improved to the peer and high-level group (≥-1 SD), especially in the gross motor domain. Among 7 infants who scored below -2 SD in at least one domain at 4–5 months, only 2 infants remained in the -2 SD score at 10–12 months.
Previous studies showed variable prevalences of DD in young infants [14,15]. In a United States (US) longitudinal study, the rate of score below <-2 SD was 2.3% on the Bayley Short Form-Research Edition (BSF-R) mental scale and 2.5% on the BSFR motor scale in 9 month infants [14]. A Norwegian longitudinal study of 1.244 infants in well baby clinics showed that the overall prevalence of suspected DD in one or more domains was 7.0% at 4 months, based on the Norwegian version of Ages and Stages Questionnaires cutoff points (10.3%, US cutoff points), 5.7% (12.3% US cutoff) at 6 months and 6.1 % (10.3 % US cutoff) at 12 months. In addition, during the first year of life, DD is most frequent screened within the gross motor area [15]. It is difficult to compare the prevalence rates of DD in early infancy, due to variable test measures, variable study populations with or without high risk, and variations in age at the time of testing.
According to Darrah et al. [16], normally developing infants are not stable in the rate of emergence of gross motor skills throughout the first 13 months. Fluctuations in the percentile rankings of motor abilities of an infant are not necessarily indicative of motor dysfunction. A low gross motor percentile could be attributable to a period in which few or no new motor skills were developed, compared with infants who mastered many new skills. In addition, typically developing infants showed a nonlinear rate of development, rather than a constant development rate [17]. The study of Valla et al. [18] showed the variability in infants’ development patterns. They reported that all classes of 1,555 infants showed a decrease in gross motor developmental pathways from 4 to 9 months; the ‘high stable’ class (80%) and ‘the late bloomers’ classes (10%) improved at 16 months and remained stable at 24 months. The U-shaped class (10%) started with high scores at 4 months and subsequently showed a decrease, followed by a relatively stable period from 9 to 16 months before an increase in scores at 24 months [18]. The WHO Multicentre Growth Reference Study (2006) showed a great variability in the attainment of the milestones of infant gross motor development. For example, walking alone is achieved between the ages of 8.2 and 17.6 months. Ninety percent of infants achieved gross motor milestones in a particular sequence, starting from crawling and progressing to sitting and, finally, walking alone, whereas 4.3% of the infants did not exhibit hands-and-knees crawling [9].
There are many involved factors; both intrinsic (physical characteristics, temperament, child’s overall state of wellness) and extrinsic factors (parent and sibling personalities, nurturing methods, the cultural environment, socioeconomic status) are responsible for individual variation [19]. A number of risk factors have been associated with an increased risk of DD. Low birth weight and short gestational age have a persisting negative association with infant gross motor development. There is inconsistent evidence for an association of breast feeding, supine sleeping, and baby-walker use with infant gross motor development [20].
In the Korean Pediatric textbook, the descriptions of gross motor development states that rolling from prone to supine occurs prior (at 4 months) to rolling from supine to prone (at 5 months) [21]. However, in this study, many 4–5 months old infants were able to roll over from supine to prone but were unable to roll over from prone to supine. The study of 72 infants in Hong Kong also reported that they rolled from supine to prone (mean age, 5.1±1.5 months) prior to rolling from prone to supine (mean age, 5.7±1.3 months). Different childcare practices, e.g., reduced emphasis of ‘tummy-time’ and routine use of the supine sleep position, may influence the age at which infants learn to roll from prone to supine [22]. K-DST question items are arranged in order from easy to difficult, However, the question 5 is ‘rolling from prone to supine,’ and question 6 is ‘rolling supine to prone.’ Further large-scale studies are needed to determine if changing the question order is warranted.
In this study, among 7 infants who had scored below -2 SD at 4–5 month, 2 had a persistent DD. Wang et al. [23] reported that early motor skills predicted later communication skills, and Piek et al. [24] suggested a strong relationship between early motor skills and later school-aged cognitive development. Infants with delayed gross motor development during early life should be continuously monitored by periodic developmental screening tests.
This study had several limitations. First, the sample included a limited number of infants. Further large-scale, and extended longitudinal studies are needed. Second, K-DST is a parent-reported screening test. Although we reviewed the parents’ reports, parents may not be able to accurately report their child development status. This may have biased our results to some extent. Third, we did not investigate the factors responsible for the variability in the attainment of developmental milestones.
In conclusion, a single abnormal of the revised K-DST result at 4–5 months should be interpreted cautiously in terms of the DD risk. Early detection of DD requires a through history taking, comprehensive physical and neurological examination, as well as developmental screening testing. For infants presenting with suspected DD on the revised K-DST 4–5 months questionnaire, especially in the gross motor domain, in the absence of any abnormal findings on neurological examinations or any developmental red flags, close monitoring with appropriate stimulation activities can be suggested, and repeated assessments after short term period should be performed. However, early diagnosis of DDs is crucial, so if there is any uncertainty, it is recommended to refer to a pediatric neurologist. Early developmental assessments should be an ongoing process involving multiple time points.
Notes
Conflicts of interest
No potential conflict of interest relevant to this article was reported.
Funding
This work was supported by the grant of Research Institute of Medical Science, Daegu Catholic University (2018).
Author contribution
Conceptualization: JJE, KJK; Formal Analysis: JJE, KYM, LNW; Investigation: JJE, KYM, LNW; Methodology: JJE, BJS; Project Administration: KYM, LNW, BJS; Writing-Original Draft: JJE, KJK; Writing-Review & Editing: JJE, BJS, KJK


