Prevalence of childhood overweight and obesity in Malaysia: a systematic review and meta-analysis
Article information

Abstract
The incidence of childhood obesity is increasing worldwide. National surveys in Malaysia have shown similar trends. This review aimed to increase our understanding of the prevalence and associated factors of childhood overweight, obesity, and excess weight in Malaysia. A systematic review and meta-analysis were conducted of studies reporting the prevalence of overweight and obesity in Malaysian children aged <18 years. Systematic searches were conducted in October 2023 and repeated in March 2024 of the PubMed, Scopus, and Web of Science databases. The grey literature was also included. Study selection, data extraction, and quality assessments were conducted by paired independent researchers. A meta-analysis of prevalence and 95% confidence interval (CI) using a random-effects model and heterogeneity (I2) was calculated. Publication bias was investigated using Egger’s test. This review included 33 studies (N=273,710) conducted between 1996 and 2022. Overall, the childhood overweight, obesity and excess weight prevalence was 13.9% (95% CI, 13.0%–14.8%), 11.8% (95% CI, 10.9%–12.8%), and 24.0% (95% CI, 22.3%–25.7%), respectively. Boys had a significantly higher proportion of obesity (12.5% [95% CI, 11.1%–14.1%] vs. 9.1% [95% CI, 8.1%–10.1%]) and excess weight (25.7% [95% CI, 23.5%–28.1%] vs. 20.7% [95% CI, 18.8%–22.8%]) than girls. Sarawak natives had a higher prevalence of obesity (17.7% [95% CI, 16.0%–19.5%]). Annually, the obesity prevalence increased by 0.3% (95% CI, 0.1%–0.6%; P=0.006) and excess weight prevalence increased by 0.6% (95% CI, 0.3%–1.0%; P=0.002). Heterogeneity was high (I2>90%), and publication bias was possible (P<0.001). Variability was not significantly affected by the critical appraisal score or sample size. In conclusion, the prevalence of childhood overweight, obesity, and excess weight in Malaysia doubled over 26 years. Future studies of the prevalence of childhood excess weight should follow a standardized reference for body mass index by age to ease interstudy comparisons.
Key message
This study provides pooled overweight and obesity data for Malaysian children. The prevalence of childhood overweight, obesity, and excess weight in Malaysia almost doubl ed over 26 years. A higher prevalence was observed among boys and Sarawakian natives. Future studies of the prevalence of childhood overweight and obesity should follow a standardized reference for body mass index by age to facilitate interstudy comparisons.
Graphical abstract. PRISMA, Reporting Items for Systematic Reviews and Meta-Analyses; JBI, Joanna Briggs Institute; BMI, body mass index.
Introduction
Childhood obesity is a serious condition that affects both children and adolescents that can lead to many noncommunicable diseases, such as diabetes, dyslipidemia, and hypertension [1]. The prevalence of childhood obesity is increasing globally [2]. Malaysia is not spared from this problem. National surveys have shown that the prevalence of obesity in children younger than 18 years of age increased from 9.5% in 2006 to 12.9% in 2015 [3]. In 2022, the prevalence of overweight and obesity among adolescents aged 13–17 years was 16.2% and 14.3%, respectively [4]. Many local studies have been conducted in different cities and states of Malaysia to explore the prevalence of childhood obesity and its associated factors.
A literature review of the prevalence and socio-demographic factors of malnutrition in Malaysia was published in 2012 [5]. The articles in this review reported a higher prevalence of over-weight among boys aged 7–9 years, urban children, and Indian children. However, no meta-analyses have been conducted to date. Moreover, different studies used different criteria to define overweight status, including body mass index (BMI), weight, and weight above height. The differences in prevalence between studies could be due to differences in criteria used rather than the factors investigated.
This review aimed to increase our understanding of the prevalence and associated factors of childhood obesity and overweight in Malaysia. By identifying the magnitude of the problem and possible target groups, health authorities can focus on developing targeted interventions to address this important public health problem.
Methods
A systematic review was conducted following the Preferred Reporting Items for Systematic Reviews and Meta-Analyses (PRISMA) statement and the Joanna Briggs Institute (JBI) approach to systematic reviews of prevalence and incidence [6,7]. The protocol containing the detailed methods of this systematic review was registered in the International Prospective Register of Systematic Reviews (registration number: CRD42023462927). The study was registered in the National Medical Research Register (NMRR ID-24-01086-LHL) and approved by the Medical Research and Ethics Committee of the Ministry of Health, Malaysia.
1. Eligibility criteria
Observational studies and the grey literature, such as national reports and theses of the prevalence of overweight, obesity, or excess weight (combination of overweight and obesity) based on BMI among children under 18 years of age in Malaysia, were included. The studies and reports had to employ population- or school-based sampling of children and be published in either English or Malay. Studies that relied on self-reporting of overweight or obesity with response rates of <85% or lacked reported response rates were excluded. When there were several articles from the same study, the article with the most complete data was selected and the others were excluded. If results from national reports or theses were published, then the published articles were used and the reports or theses were excluded. If a study included subjects older than 18 years of age and no subgroup analysis was performed for children younger than 18 years, it was excluded. The studies were not restricted by year of publication or year of data collection.
2. Information sources
Studies that fulfilled the eligibility criteria were identified from a previous literature review by Khambalia et al. [5] and added if eligible. Systematic searches of peer-reviewed journals were conducted on October 16, 2023, of the PubMed, Scopus, and Web of Science databases. The search was not restricted by publication date. The reference lists of the relevant studies and publications were manually screened to identify potentially eligible studies. The search was repeated on March 22, 2024, to capture any additional publications over the 5-month period.
A search for the grey literature, such as theses and national reports, was conducted of the Malaysian Academic Library Institutional Repository (http://malrep.uum. edu.my/rep) and the Institute of Public Health, Ministry of Health, Malaysia website (https://iku.gov.my/nhms) on October 16, 2023.
The following search strategy was used for PubMed and adapted for the other databases: (child* OR pediatric OR paediatric OR infan* OR adolescen* OR teenage*) AND (prevalence OR incidence) AND (overweight OR obes*) AND (Malaysia OR Malaysian).
3. Selection process
The search results in a compatible format were imported into the Rayyan platform (https://rayyan.ai) to remove duplicates and enable further review. Two independent reviewers (CKY1 and CKY2) selected the studies by screening the titles and abstracts according to the inclusion and exclusion criteria. Subsequently, full-text assessments were conducted to confirm the presence of relevant data. The reviewers were blinded to the responses of the other reviewers during the screening and selection processes. Blinding was removed after both reviewers completed screening to identify agreements and conflicts in the decisions. A third reviewer (MS) arbitrated disagreements.
The retrieved grey literature, namely theses and national reports, was entered into a Microsoft Excel (Microsoft Corp., Redmond, WA, USA) spreadsheet. The search results were screened by one reviewer (CKY1), and the eligibility of each was confirmed by a second reviewer (LCL).
4. Data collection process
The data were independently extracted into an Excel spreadsheet by 2 reviewers (CKY1 and CKY2), and disagreements were resolved by a third reviewer (MS). If conflicting information was available, the authors were contacted for clarification. Blinding was performed similarly to the selection process.
5. Data items
For each study, the information collected included study data, population characteristics, and childhood overweight, obesity, and excess weight data. The study data included: author; title; journal name; publication year; volume, issue, and page numbers; publication type; study design; state conducted in Malaysia; study setting; data collection year or timeframe; participant characteristics; measurement method; and BMI reference used. Population characteristics included age, sex, number of children, and sample size. Childhood overweight, obesity, and excess weight (overweight and obesity) data were collected for the entire sample and for each sex, age group, ethnicity, decade, locality (urban or rural), and Malaysian state, if available. The reference ranges of BMI for age used in the studies included the World Health Organization (WHO), International Obesity Task Force (IOTF), and Centers for Disease Control and Prevention (CDC). The WHO growth standards were developed based on a multicenter growth reference study, and z scores and standard deviations (SDs) were used [8]. The IOTF reference is based on a study utilizing data from 6 large national cross-sectional surveys linked to adult BMI cutoff points of 25 and 30 kg/m2 [9]. The CDC growth charts are based on studies conducted in the United States that use percentiles [10].
For children younger than 5 years of age, excess weight was defined as a BMI >+2 SD or weight >95th percentile. For children older than 5 years of age, overweight was defined as a BMI between +1SD and +2SD or a weight between the 85th and 95th percentiles, while obesity was defined as a BMI >+2SD or a weight >95th percentile. Excess weight was defined as a BMI for age of >+1SD or a weight >85th percentile. When data for both overweight and obesity were available in a study, data for excess weight was calculated from the overweight and obesity data. If the study used a different classification, the data were recategorized according to the above definitions. For the studies that did not report the year of data collection, the year of publication was used to classify the decade of the study.
6. Quality assessment
Paired independent reviewers (CKY1 and CKY2) assessed the methodological quality of the included studies using the checklist for prevalence data from the JBI, which consists of 9 items [7]. Items that fulfilled the criterion were given 1 point; otherwise, they were scored 0. Each study received a score of 0–9, with higher scores indicating better quality. Articles were not excluded based on their risk-of-bias assessment scores. Prior to the review, both reviewers standardized their understanding of the checklist. The reviewers were blinded to the other reviewers’ responses until all assessments were completed.
7. Effect measures
The primary outcome was the prevalence of childhood overweight, obesity, and excess weight (overweight and obesity) reported with a 95% CI. Secondary outcomes included the prevalence of childhood overweight, obesity, and excess weight according to sex, age group, ethnicity, time period, locality, and Malaysian state.
8. Data analysis
The data analysis was performed using Comprehensive Meta-Analysis software (ver. 4; Biostat, Inc., Englewood, NJ, USA) for the meta-analysis of proportions and Statistical Package for Social Sciences (ver. 27; IBM, New York, NY, USA) for publication bias and meta-regressions. Meta-analysis of proportions was performed using a random-effects model for overall overweight, obesity, and excess weight as well as each subgroup. Heterogeneity was estimated by assessing interstudy inconsistencies (I2). Random-effects models were used if the distributions were heterogeneous. Publication bias was assessed using funnel plot asymmetry and Egger’s test (significance level, P<0.05). Meta-regressions were performed to investigate the effects of the independent variables (age, region, decade, and quality score) on interstudy variability in obesity prevalence.
Results
1. Study selection
Fig. 1 shows the PRISMA flow chart for this review. Of the 15 records from the previous systematic review, 5 fulfilled the inclusion and exclusion criteria [11-15]. Out of 1,117 records identified from databases and other sources (4 from the citation search), 165 were assessed for eligibility via fulltext review, leading to the inclusion of an additional 25 articles [3,16-39] and 3 reports [4,40,41]. All studies were written in English. The full texts of 1 article and 1 thesis could not be retrieved despite repeated attempts to contact the original authors. Sixty-seven studies were excluded due to response rate issues, mainly unknown response rates (n=29) and response rates of <85% (n=38). One study with an unknown response rate was included because it was the only study conducted in 1996 on overweight and obesity as defined by BMI [11]. Studies excluded for no outcome of interest were due to overweight and obesity being classified by weight by age or weight-over-height by age or the study not reporting results of the prevalence of overweight, obesity, or excess weight. Clarification was sought from the authors of one study regarding the classification of overweight and obese as stated in their report [41]. Additional studies (n=30) identified during a repeat search of databases on March 22, 2024, did not fulfill the eligibility criteria.
Preferred Reporting Items for Systematic Reviews and Meta-Analyses flow chart for childhood obesity systematic review. NHMS, National Health and Morbidity Survey.
2. Study characteristics
A total of 273,710 children were assessed in 33 studies conducted between 1996 and 2022. All reports from the included studies are presented in Table 1. Twenty-six studies included overweight data, 27 included obese data, and 31 included excess weight data. Table 2 shows the number of studies and children involved in the analysis by category. All studies had a cross-sectional design. Most studies were school-based (n=28 [85%]). Geographically, 10 of the studies were national, while the others were conducted in 1 to 3 states. One study enrolled only girls, and the data were included in the subgroup analysis for girls but not the total analysis [15]. The majority of studies used BMI for age reference ranges from the WHO (n=30 [88.2%]), while the others used reference ranges from the IOTF (n=3 [8.8%]) and CDC (n=1 [3.0%]).
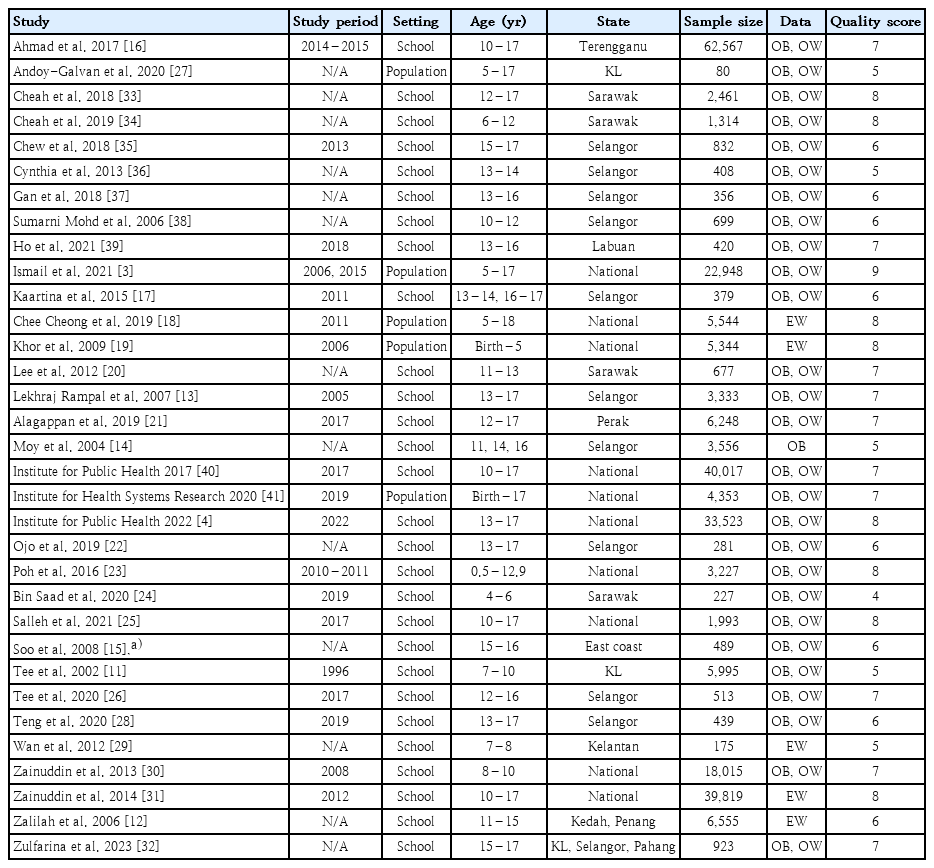
Characteristics of the included studies
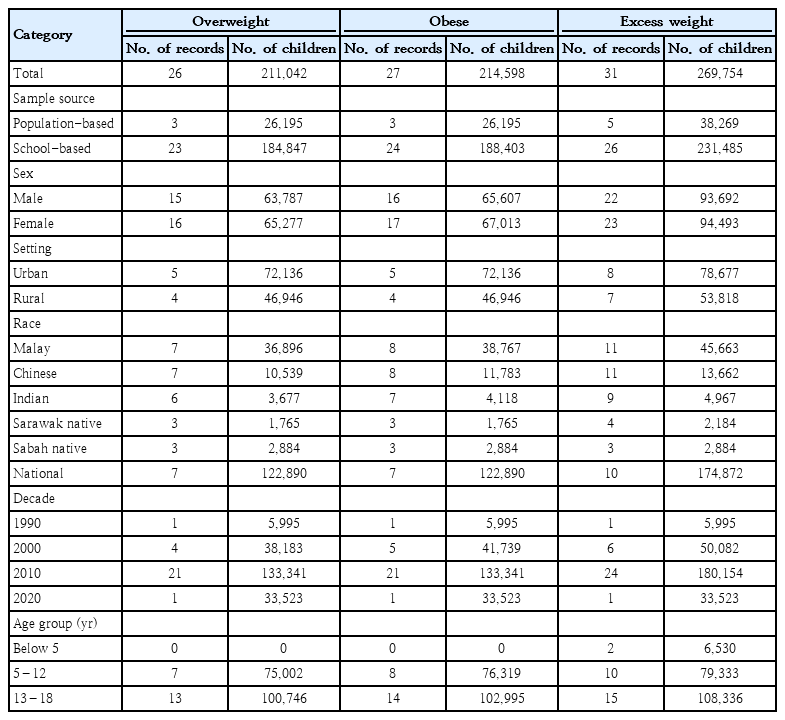
Number of studies and children included in the review by category
The quality assessment scores of the studies were 4–9 median, 7). A critical appraisal of the studies found limitations in sample frame (n=23), subject sampling method (n=6), sample size (n=3), subject coverage (n=15), reliable standards (n=17), data analysis (n=12), and response rate (n=1).
3. Prevalence of childhood overweight, obesity, and excess weight
Overall, the prevalence of childhood overweight, obesity, and excess weight was 13.9% (95% CI, 13.0%–14.8%; I2=96.2%), 11.8% (95% CI, 10.9%–12.8%; I2=97.1%), and 24.0% (95% CI, 22.3%–25.7%; I2=98.9%), respectively. There were no statistically significant differences between population-based and school-based studies for overweight (13.1% [95% CI, 11.0%–15.5%], I2=87.6% vs. 14.0% [95% CI, 13.1%–14.9%], I2=95.8%), obesity (13.7% [95% CI, 10.1%–18.3%], I2=96.3 vs. 11.6% [95% CI, 10.7%–12.6%], I2=92.7%) and excess weight (19.0% [95% CI, 13.2%–26.5%], I2=99.5% vs. 25.2% [95% CI, 23.8%–26.8%], I2=98.3%).
4. Prevalence by gender
Boys had a significantly higher proportion of obesity (12.5% [95% CI, 11.1%–14.1%], I2=95.4% vs. 9.1% [95% CI, 8.1%–10.1%], I2=92.7%) and excess weight (25.7% [95% CI, 23.5%–28.1%], I2=98.0% vs. 20.7% [95% CI, 18.8%–22.8%], I2=97.8%) than girls (Fig. 2). However, there was no statistically significant difference in the prevalence of overweight between boys (14.5% [95% CI, 13.5%–15.6%], I2=86.0%) and girls (13.5% [95% CI, 12.4%–14.8%], I2=91.4%).
Prevalence of childhood obesity (A), overweight (B), and excess weight (C) by category. CI, confidence interval.
5. Prevalence by setting
Overall, the prevalence of childhood overweight, obesity, and excess weight was 13.9% (95% CI, 13.0%–14.8%; I2=96.2%), 11.8% (95% CI, 10.9%–12.8%; I2=97.1%), and 24.0% (95% CI, 22.3%–25.7%; I2=98.9%), respectively. There were no statistically significant differences between population-based and school-based studies for overweight (13.1% [95% CI, 11.0%–15.5%], I2=87.6% vs. 14.0% [95% CI, 13.1%–14.9%], I2=95.8%), obesity (13.7% [95% CI, 10.1%–18.3%], I2=96.3 vs. 11.6% [95% CI, 10.7%–12.6%], I2=92.7%), and excess weight (19.0% [95% CI, 13.2%–26.5%], I2=99.5% vs. 25.2% [95% CI, 23.8%–26.8%], I2=98.3%).
6. Prevalence by ethnicity
In terms of ethnic groups, the prevalence of overweight ranged between 13.4% and 15.6%, obesity ranged between 9.6% and 17.7%, and excess weight ranged between 23.8% and 33.8%. Sarawak natives had a statistically higher prevalence of obesity at 17.7% ([95% CI, 16.0%–19.5%], I2=0%) compared to the Malays (12.1% [95% CI, 10.3%–14.1%], I2=94.3%), Chinese (9.9% [85% CI, 7.8%–12.5%], I2=92.2%), Indian (9.6% [95% CI, 7.2%–12.9%], I2=87.5%), and Sabah natives (11.7% [95% CI, 8.6%–15.8%], I2=80.0%) (Fig. 2). Differences in overweight and excess weight between other races were not statistically significant.
7. Prevalence by state
Studies conducted nationwide did not demonstrate a statistically significant difference in prevalence compared to overall prevalence in terms of overweight (13.6% [95% CI, 11.9%–15.4%], I2=98.6%), obesity (13.2 [95% CI, 11.7%–14.8%], I2=98.2%), and excess weight (22.7% [95% CI, 19.9%–25.7%], I2=99.5%). In Malaysia, the subgroup prevalence by state was mostly obtained from a single national report [40].
In the overweight category, the states of Labuan (17.3% [95% CI, 15.9%–18.7%]), Pulau Pinang (16.6% [95% CI, 15.2%–18.1%]), Putrajaya (16.5% [95% CI, 15.1%–18.0%]), Pahang (16.3% [95% CI, 14.9%–17.8%]), and Perak (16.2% [95% CI, 15.4%–17.0%]) had a significantly higher prevalence than the overall prevalence (13.9% [95% CI, 13.0%–14.8%]).
For obesity, the states of Perlis (18.2% [95% CI, 16.8%–19.8%]), Melaka (17.0% [95% CI, 15.6%–18.5%]), Pahang (15.8% [95% CI, 14.4%–17.2%]), Labuan (15.8% [95% CI, 14.6%–17.2%]), Kedah (15.4% ([95% CI, 14.0%–16.8%]), Negeri Sembilan (15.4% [95% CI, 14.0%–16.9%]), Putrajaya (15.2% [95% CI, 13.8%–16.6%]), Pulau Pinang (15.0% [95% CI, 13.6%–16.4%]), and Johor (14.4% [95% CI, 13.1%–15.8%]) were higher than the overall prevalence of obesity (11.8% [95% CI, 10.9%–12.8%]).
For excess weight, Perlis (33.4% [95% CI, 31.6%–35.3%]), Labuan (33.1% [95% CI, 31.4%–34.8%]), Melaka (32.9% [95% CI, 31.1%–34.7%]), Pahang (32.1% [95% CI, 30.3%–33.9%]), Putrajaya (31.7% [95% CI, 29.9%–33.5%]), Pulau Pinang (31.6% [95% CI, 29.8%–33.4%]), Negeri Sembilan (31.0% [95% CI, 29.2%–32.9%]), Kedah (30.8% [95% CI, 29.1%–32.7%]), Johor (30.5% [95% CI, 28.7%–32.3%]), and Terengganu (27.0% [95% CI, 26.7%–27.3%]) had a higher prevalence than the overall prevalence (24.0% [95% CI, 22.3%–25.7%]).
The states that were significantly different only had one or 2 studies from which the proportion was analyzed. The results for other states were not significantly different from those for overall weight, obesity, or excess weight.
8. Prevalence by decade
The prevalence of overweight, obesity, and excess weight has increased over the past few decades (Fig. 2). The prevalence of overweight was 9.4% ([95% CI, 8.7–10.2%], I2=0%) in the 1990s, 11.6% ([95% CI, 11.0–12.3%], I2=61.6%) in the 2000s, 14.5% ([95% CI, 13.8–15.3%], I2=86.6%) in the 2010s, and 16.1% ([95% CI, 15.7–16.5%], I2=0%) in the 2020s. The prevalence of obesity was 8.4% ([95% CI, 7.7–9.1%], I2=0%) in the 1990s, 8.8% ([95% CI, 7.4–10.4%], I2=95.9%) in the 2000s, 13.0% ([95% CI, 12.0–14.0%], I2=94.7%) in the 2010s, and 14.5% ([95% CI, 14.1–14.9%], I2=0%) in the 2020s. The prevalence of excess weight was 17.8% ([95% CI, 16.9–18.8%], I2=0%) in the 1990s, 16.8% ([95% CI, 13.1–21.3%], I2=99.3%) in the 2000s, 26.7% ([95% CI, 25.5–27.9%], I2=95.3%) in the 2010s, and 30.6% ([95% CI, 30.1–31.1%], I2=0%) in the 2020s.
9. Prevalence by age group
For children younger than 5 years of age, the prevalence of excess weight was 5.4% ([95% CI, 4.9%–6.0%], I2=0%). For 5–12-year-olds, the prevalence was 13.6% ([95% CI, 11.7%–15.9%], I2=98.1) for overweight, 13.0% ([95% CI, 10.8%–15.5%], I2=98.7%) for obesity, and 25.4% ([95% CI, 22.0%–29.0%], I2=97.7%) for excess weight. For 13–18-year-olds, the prevalence was 14.9% ([95% CI, 14.1%–15.7%], I2=85.8%) for overweight, 10.2% ([95% CI, 8.9%–11.6%], I2=97.7%) for obesity, and 22.5% ([95% CI, 17.6%–28.3%], I2=99.7%) for excess weight. The differences between 5–12-year-olds and 13–18-year-olds were not statistically significant.
10. Investigation of heterogeneity and publication bias
Egger test for the regression intercept indicated a possible publication bias for overweight (P<0.001), obesity (P<0.001), and excess weight (P<0.001). Fig. 3 shows the funnel plot for overweight, obesity, and excess weight distributed by the standard error of prevalence.
Prevalence of overweight (A), obesity (B), and excess weight (C) in each study distributed by standard error of prevalence.
The annual increase was associated with a 0.3% (95% CI, 0.1%–0.6%) increase in obesity prevalence (P=0.006) and 0.6% (95% CI, 0.3%–1.0%) increase in excess weight prevalence (P=0.002) (Fig. 4). The prevalence of overweight was not significantly associated with study year (P=0.066). The variability in the prevalence of overweight, obesity, and excess weight was not significantly affected by the critical appraisal score (residual I2: 97.6%, 98.6%, and 99.5%, respectively), sample size (residual I2: 97.9%, 98.8%, and 99.5%, respectively), study setting (residual I2: 97.7%, 98.9%, and 99.5%, respectively), or nationwide study design (residual I2: 97.6%, 98.7%, and 99.5%, respectively).
Prevalence of childhood overweight (A), obesity (B), and excess weight (C) by year of study (study size represented by circle size).
Discussion
This systematic review and meta-analysis found that, during the 27-year period from 1996 to 2022, for every 100 Malaysian children assessed, 14 were overweight, 12 were obese, and 24 had excess weight. The prevalence of overweight, obesity, and excess weight is increasing in Malaysia, reaching 16.1%, 14.5%, and 30.6%, respectively, by 2022. This trend of an increasing obesity prevalence is in agreement with worldwide studies showing that the prevalence of obesity and excess weight increased between the 1970s and the 2010s [2]. The prevalence of excess weight increased from 0.3% (Bangladesh, Bhutan, India, and Nepal) and 41.6% (Nauru) in 1975 to 6.3% (India) and 64.4% (Nauru) in 2015 [42]. The highest prevalence of obesity was 25.4% in girls and 22.4% in boys in the Polynesia and Micronesia groups, respectively [42].
This increasing prevalence of childhood obesity was reported by the National Health and Nutrition Examination Surveys in the United States (16.9% in 2011 to 19.7% in 2020), Brazil (6.5% in 1990 to 7.9% in the 2000s and 12.0% in the 2010s), the National School Health Examination in Korea (8.7% in 2007 to 15.0% in 2017), the 2021 Children’s Blue Book in China (15.5% in 2010 to 24.2% in 2019 and 29.4% in 2022), and South Asia (a significant association between obesity prevalence and publication year) [43-48]. The increasing prevalence of obesity has been attributed to many factors ranging from individual- to population-level [49]. Individual factors include an increased consumption of sugary drinks and junk food, increased portion sizes, and decreased activity levels. Population-level changes include sociocultural, economic, and family factors.
This review revealed that boys had a higher prevalence of obesity and overweight. This was also observed in England, where boys had a higher prevalence of obesity than girls (29.2% vs. 21.7%, respectively) [50]. The prevalence of obesity among school-aged Vietnamese children was higher in boys (17.5%) than in girls (8.1%) [51]. A systematic review of overweight and obesity in children in Asian countries showed that a higher percentage of boys were overweight and obese than girls [48]. The Atlas of Childhood Obesity showed that the proportion of countries reporting a higher obesity prevalence among boys compared to girls was 65% among children aged 5–9 years and 60% among children aged 10–19 years [52]. This trend was seen predominantly among countries in the high- and upper-middle-income brackets. The reason for sex differences in obesity prevalence is multifactorial. It could be related to sex differences in weight-related beliefs, physiological differences between the sexes, and family practices [52–54].
This study showed that Sarawak natives have a higher prevalence of obesity than other races. Other worldwide studies demonstrated disparities in obesity among races and ethnic groups. Among United States children, obesity among American Indian/Native Alaskan children is twice as common as that among Asian or non-Hispanic white children [55]. This variance could be due to differences in risk factors among different ethnic groups, such as infant weight gain and socioeconomic factors [56]. As the ethnic group with the highest prevalence of obesity, native Sarawakian children could be a target for intervention. However, the risk factors have varying associations with obesity in different ethnic groups. One study comparing BMI z scores of eating meals as a family found that Hispanic girls had a positive association, while African-American girls had a negative association [57]. This suggests that an intervention that is beneficial to one group may be detrimental to another. Studies examining interventions for overweight and obesity should consider ethnic differences. Otherwise, well-intentioned interventions may bring harm instead.
It is difficult to compare and combine the results of obesity prevalence between studies and within and between countries due to differences in classification measures and growth references used. Classification measures included classifying overweight based on weight by age, weight-over-height by age, and BMI by age. The prevalence of obesity differed according to the measure used [19]. The reference range for BMI is affected by the growth reference used, namely the IOTF, 2007 WHO growth reference, or country-specific reference. Moreover, different growth references may opt for z scores or percentiles. A study in Malaysia showed that, although the agreement between the BMI-WHO, BMI-IOTF, and Child Growth Foundation data was good to very good, the prevalence of obesity was 10.7%, 8.8%, and 15.2%, respectively [32]. These differences affected the combinability and comparability of the study results. Future studies of childhood obesity should follow standardized references to minimize confusion.
Low response rates may have affected the generalizability of the data, causing selection bias among the subjects. For example, obese children tend to be less healthy and may have missed school on the day of the survey. The reduced response rate due to children with a higher weight range causes the results to be lower than the actual prevalence in the population. Therefore, this review excluded studies with low response rates.
This is the first systematic review and meta-analysis of the prevalence of overweight and obesity in Malaysia. It included only studies that used measured BMI for age, had a response rate > 85%, and used population- or school-based sampling. These criteria were chosen to minimize discordant definitions and biases between studies. This review screened published journal articles, theses, and national reports based on eligibility criteria and combined the results via a meta-analysis of prevalence, thereby combining data from studies spanning 26 years into a single analysis.
In this review, there was only one study each in the 1990s and the 2020s. This could have led to bias as only one study represented an entire decade. However, the overall trend showed a steady increase from the studies in the decades in between.
There was high heterogeneity among the studies. The review included studies that used either WHO or IOTF references for BMI. The raw BMI and age data of the participants from the studies that were included and recategorized into overweight and obese using a standardized reference would have standardized the prevalence of overweight and obesity. This could potentially reduce the discrepancies. Heterogeneity was also caused by increasing prevalence over the years. Limiting the study to a smaller timeframe may reduce heterogeneity.
Recommendations for further studies include exploring ethnic differences in obesity and associated factors. Interventional studies of managing childhood obesity should be conducted with sub-analyses according to ethnic group because of different and opposite responses by ethnicity. Future studies should use the same reference measures used for obesity.
In conclusion, the prevalence of overweight, obesity, and excess weight in Malaysia has increased over the past few decades, almost doubling over 26 years. A higher proportion of obesity was observed among boys and Sarawak natives. However, we found no significant differences between urban and rural settings or age groups. It is recommended that future studies of the prevalence of childhood excess weight follow a standardized reference for BMI by age to facilitate interstudy comparisons.
Notes
Conflicts of interest
The authors declare no potential conf licts of interest relevant to this article.
Funding
This study did not receive any specific grant from any funding agency.
Author contribution
Conceptualization: CKY1, MS; Data curation: CKY1, CKY2, MS; Formal analysis: CKY1, KC, LCL; Methodology: CKY1, KC, MS; Project administration: CKY1; Visualization: CKY1, KC, LCL; Writing - original draft: CKY1; Writing - review & editing : CKY1, CKY2, KC, LCL, MS
Acknowledgements
The authors thank the Director General of Health, Ministry of Health, Malaysia, for granting permission to publish this article.