Hidden link between endocrine-disrupting chemicals and pediatric obesity
Article information

Abstract
The increasing prevalence of pediatric obesity has emerged as a significant public health concern. Among various contributing factors, exposure to endocrine-disrupting chemicals (EDCs) has gained recognition for its potential role. EDCs, including bisphenols, phthalates, per- and polyfluoroalkyl substances, polycyclic aromatic hydrocarbons, and organochlorines, disrupt hormonal regulation and metabolic processes, contributing to alterations in fat storage, appetite regulation, and insulin sensitivity. This study offers a comprehensive review of the current research linking EDC exposure to pediatric obesity by integrating the findings from experimental and epidemiological studies. It also addresses the complexities of interpreting this evidence in the context of public health, highlighting the urgent need for further research.
Key message
Studies indicate potential connections between exposure to endocrine-disrupting chemicals (EDCs) and childhood obesity. Variations in the impact of EDCs in epidemiological studies may result from differences in exposure concentrations and timing, measurement methods, and interactive effects of multiple EDCs. Longitudinal studies on exposure to multiple EDCs are crucial to elucidating their contribution to pediatric obesity and minimize the adverse health consequences of EDC exposure.
Introduction
Endocrine-disrupting chemicals (EDCs) are a diverse group of substances that interfere with the endocrine system and the body's network of hormone-producing glands. These chemicals can mimic, block, or disrupt normal hormonal function, leading to a multitude of health issues [1]. EDCs, which encompass a variety of substances, including phthalates, bisphenols, per- and polyfluoroalkyl substances (PFAS), organochlorines, and polycyclic aromatic hydrocarbons (PAHs) [2,3], are found in numerous consumer products, industrial emissions, and natural sources, rendering their exposure ubiquitous and virtually inevitable in daily life [4].
Pediatric obesity is a critical and growing public health concern characterized by the excessive accumulation of fat that poses a risk to child and adolescent health [5]. The prevalence of pediatric obesity has increased dramatically in recent decades [6], leading to a surge in obesity-related health complications such as type 2 diabetes, hypertension, precocious puberty, and psychological issues [7-9]. These conditions affect the child's immediate well-being and have long-term implications for their adult health, underscoring the urgency of addressing this epidemic.
Emerging research suggests a complex interplay between environmental factors and a genetic predisposition in the development of pediatric obesity. Among these environmental factors, EDC exposure has gained attention owing to its potential role in modulating the risk of obesity. Preliminary findings of epidemiological and experimental studies suggest that EDCs may disrupt hormonal balance and impact metabolism and fat storage mechanisms, potentially contributing to obesity [10].
This paper reviews the potential association between EDC exposure and the risk of childhood obesity by addressing the experimental and epidemiological evidence, highlighting the need for comprehensive research and targeted interventions to mitigate this pressing public health issue.
Bisphenol A
1. General characteristics
Bisphenols, including bisphenol A (BPA), bisphenol S (BPS), bisphenol F (BPF), bisphenol B (BPB), and bisphenol P (BPP), are a group of synthetic organic compounds widely used in the manufacture of polycarbonate plastics and epoxy resins [11]. These materials are prevalent in a variety of consumer products such as water and baby bottles, food storage containers, and food and beverage can linings. The structure of bisphenols, characterized by 2 hydroxyphenyl groups, enables them to mimic estrogen, thereby categorizing them as xenoestrogens. BPA, the most widely recognized bisphenol, was first synthesized in 1891 and has been used in plastic manufacturing since the 1950s [12]. Despite its widespread applications, concerns over the potential health risks of BPA due to its endocrine-disrupting properties have prompted increased scrutiny and the development of alternative bisphenols, including BPS, BPF, BPB, and BPP.
The primary route of human exposure to bisphenols is through dietary consumption, predominantly from food and beverages that are contaminated due to contact with bisphenol-containing materials. Other exposure routes include dermal contact, dust inhalation, and direct oral contact with products made from or coated with bisphenols. Once absorbed, BPA enters the bloodstream and is primarily metabolized in the liver through glucuronidation mediated by uridine 5'-diphospho-glucuronosyltransferase enzymes, resulting in BPA glucuronide formation. This metabolite is subsequently excreted, mostly through the urine, with over 90% of the conjugated metabolites eliminated within 24 hours. The measurement of total urinary bisphenol levels, typically assessed after deconjugation with β-glucuronidase, is a reliable biomarker for bisphenol exposure. Notably, the terminal half-life of BPA is longer after dermal exposure versus oral intake because the skin continues to absorb BPA into the bloodstream even after the initial exposure has ended.
2. Impact on obesity in experimental studies
BPA has been extensively studied for its effects on adipogenesis across various experimental studies (Fig. 1). EDCs such as BPA can also act through estrogen receptor pathways to influence adipogenesis. BPA can bind to estrogen receptors (ERα and ERβ) with lower affinity than estradiol. ER activation by BPA leads to increased expression of genes associated with adipocyte differentiation in human mesenchymal stem cells [13]. Furthermore, the interaction of BPA with ER can impede adiponectin release, thereby exacerbating inflammation in fat tissues and disrupting lipid regulation [14].
The potential mechanisms of endocrine-disrupting chemicals (EDCs) in the development of obesity. BPA, bisphenol A; PFAS, per- and polyfluoroalkyl substances; PAHs, polycyclic aromatic hydrocarbons.
BPA also activates the expression of peroxisome proliferator-activated receptor γ (PPARγ), which is essential for fat cell development and energy balance [15]. Studies involving human adipose-derived mesenchymal stem cells revealed that BPA exposure increased the mRNA levels of key adipogenic markers such as PPARγ, C/EBPα, and C/EBPβ. This finding indicates the potential of BPA to promote fat cell formation through ER pathways and potentially via an alternative ER pathway [13]. Additionally, BPA exposure leads to increased preadipocyte growth, greater lipid accumulation, higher proinflammatory cytokine levels, and alterations in genes involved in lipid processing, particularly FABP4 and CD36. This effect has been observed in 3T3-L1 adipocyte models and primary adipocytes derived from children [16,17].
Experimental studies have shown that BPA exposure leads to dysfunction of the brown adipose tissue, which is crucial for thermogenesis and energy expenditure. BPA reduces the expression of uncoupling protein-1 and β-adrenergic receptors in brown adipocytes, leading to decreased thermogenic capacity and energy expenditure while increasing fat accumulation [18]. In an in vitro model, early-life BPA exposure can induce modifications in DNA methylation and histone marks, leading to epigenetic changes in the genes involved in hepatic oxidation. These epigenetic alterations are associated with increased fat and lean mass as well as hepatic steatosis [19].
In utero and adult BPA exposure also affect the hypothalamic neurons involved in appetite regulation, such as the agouti-related peptide and neuropeptide Y, leading to increased appetite and potential weight gain [20]. Moreover, BPA disrupts the gut microbiota, leading to altered microbial composition, reduced short-chain fatty acids, and increased systemic lipopolysaccharides and contributing to obesity, metabolic disorders, and inflammation [21].
3. Association with childhood obesity in epidemiological studies
The relationship between prenatal BPA exposure and childhood obesity has garnered extensive attention, particularly in North America, Europe, and Asia (Table 1). A substantial body of evidence has indicated a positive correlation between prenatal BPA exposure and increased childhood adiposity. These studies frequently reported that early BPA exposure was linked to accelerated weight gain during early childhood and higher adiposity indicators such as body mass index (BMI) z scores, skinfold thickness, body fat percentage, and waist circumference (WC) [22-27]. However, a shift in this trend appears in the more recent literature. Studies published after 2020 reported no significant association between prenatal BPA exposure and adiposity measures in children aged 5–11 years [28,29]. This finding suggests a potential reevaluation of earlier findings or indicates that the impact of BPA may be more nuanced than previously understood. Interestingly, a study from China presented a unique finding, suggesting that prenatal BPA exposure correlates with a specific pattern of BMI trajectory characterized by a low BMI that increases rapidly within the first 2 years of life [30]. This suggests that BPA influences growth patterns that are not uniformly observable across different populations or age groups.
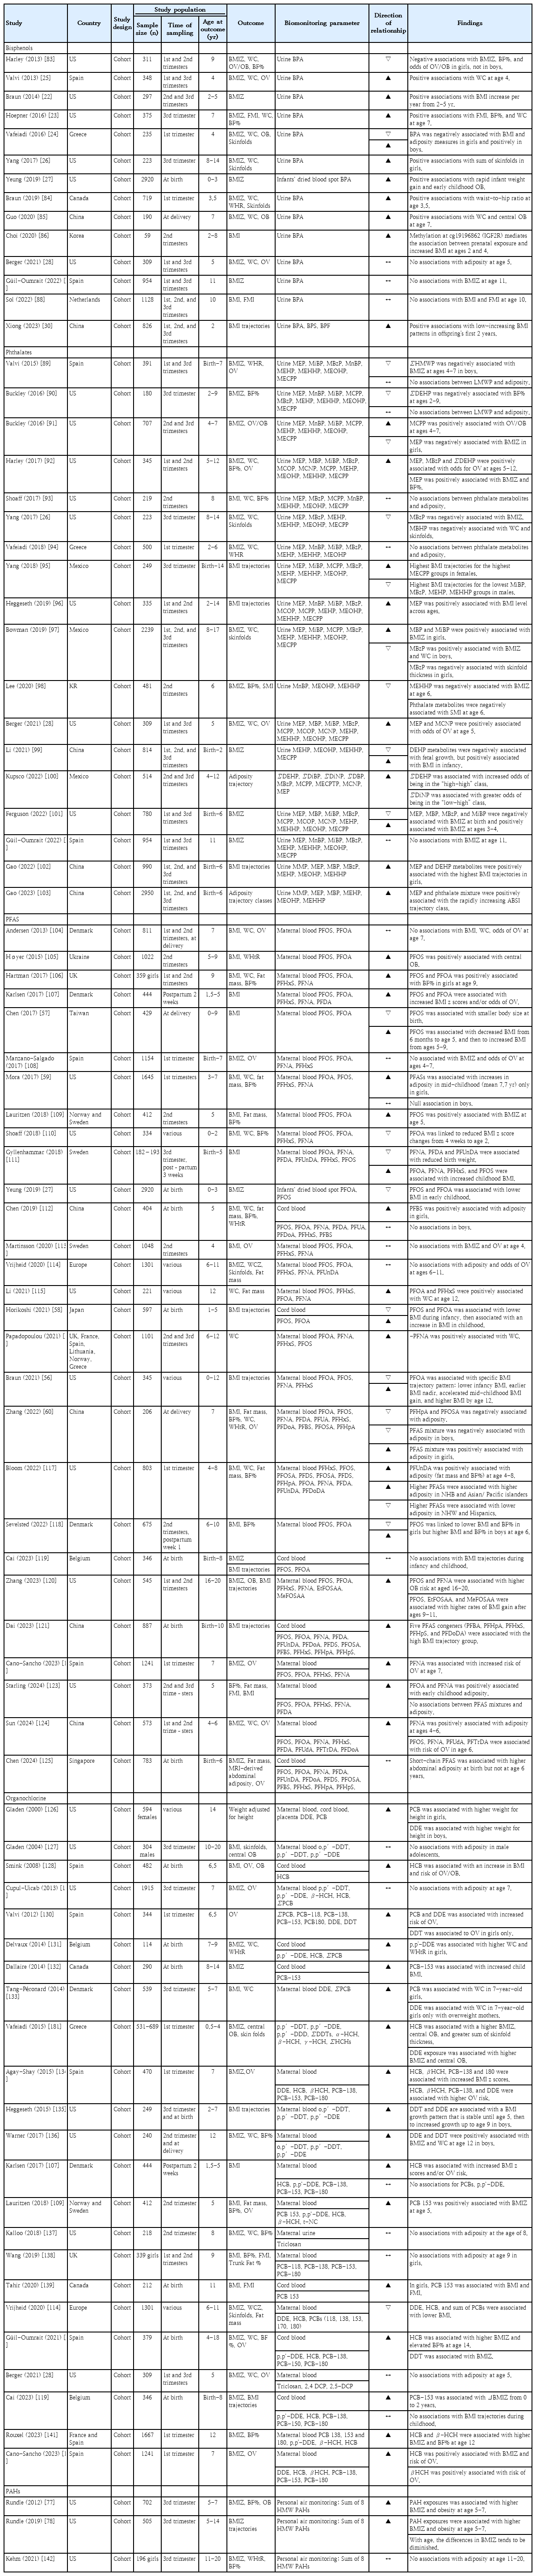
Prenatal exposure to EDCs and childhood obesity in epidemiologic studies
Research on postnatal BPA exposure and its effects on children, including studies from the United States (US) (through National Health and Nutrition Examination Survey [NHANES] data), Europe, Mexico, China, and Korea, primarily employed cross-sectional methodologies; only a few were prospective studies (Table 2). These studies generally indicated a potential link between postnatal BPA exposure, increased adiposity, and a higher risk of obesity in children. However, 2 prospective studies from the US revealed no significant relationship between BPA exposure in childhood and adiposity in later childhood [31,32]. Additionally, a serial cross-sectional study by Okubo et al. [33] utilizing the NHANES 2003–2014 data identified an association between higher BPA levels and obesity risk in 2003–2008 but variability in 2009– 2014. This inconsistency implies that the relationship between BPA exposure and obesity may be affected by several factors including exposure window, changes in BPA usage patterns, public awareness, and regulatory measures. A recent Korean study using Korean National Environmental Health Survey (KoNEHS) data indicated no significant association between urinary BPA concentrations and obesity in children aged 3–17 years [34]. Therefore, further studies are needed to explore how ethnicity-specific factors influence the relationship between BPA exposure and obesity risk.
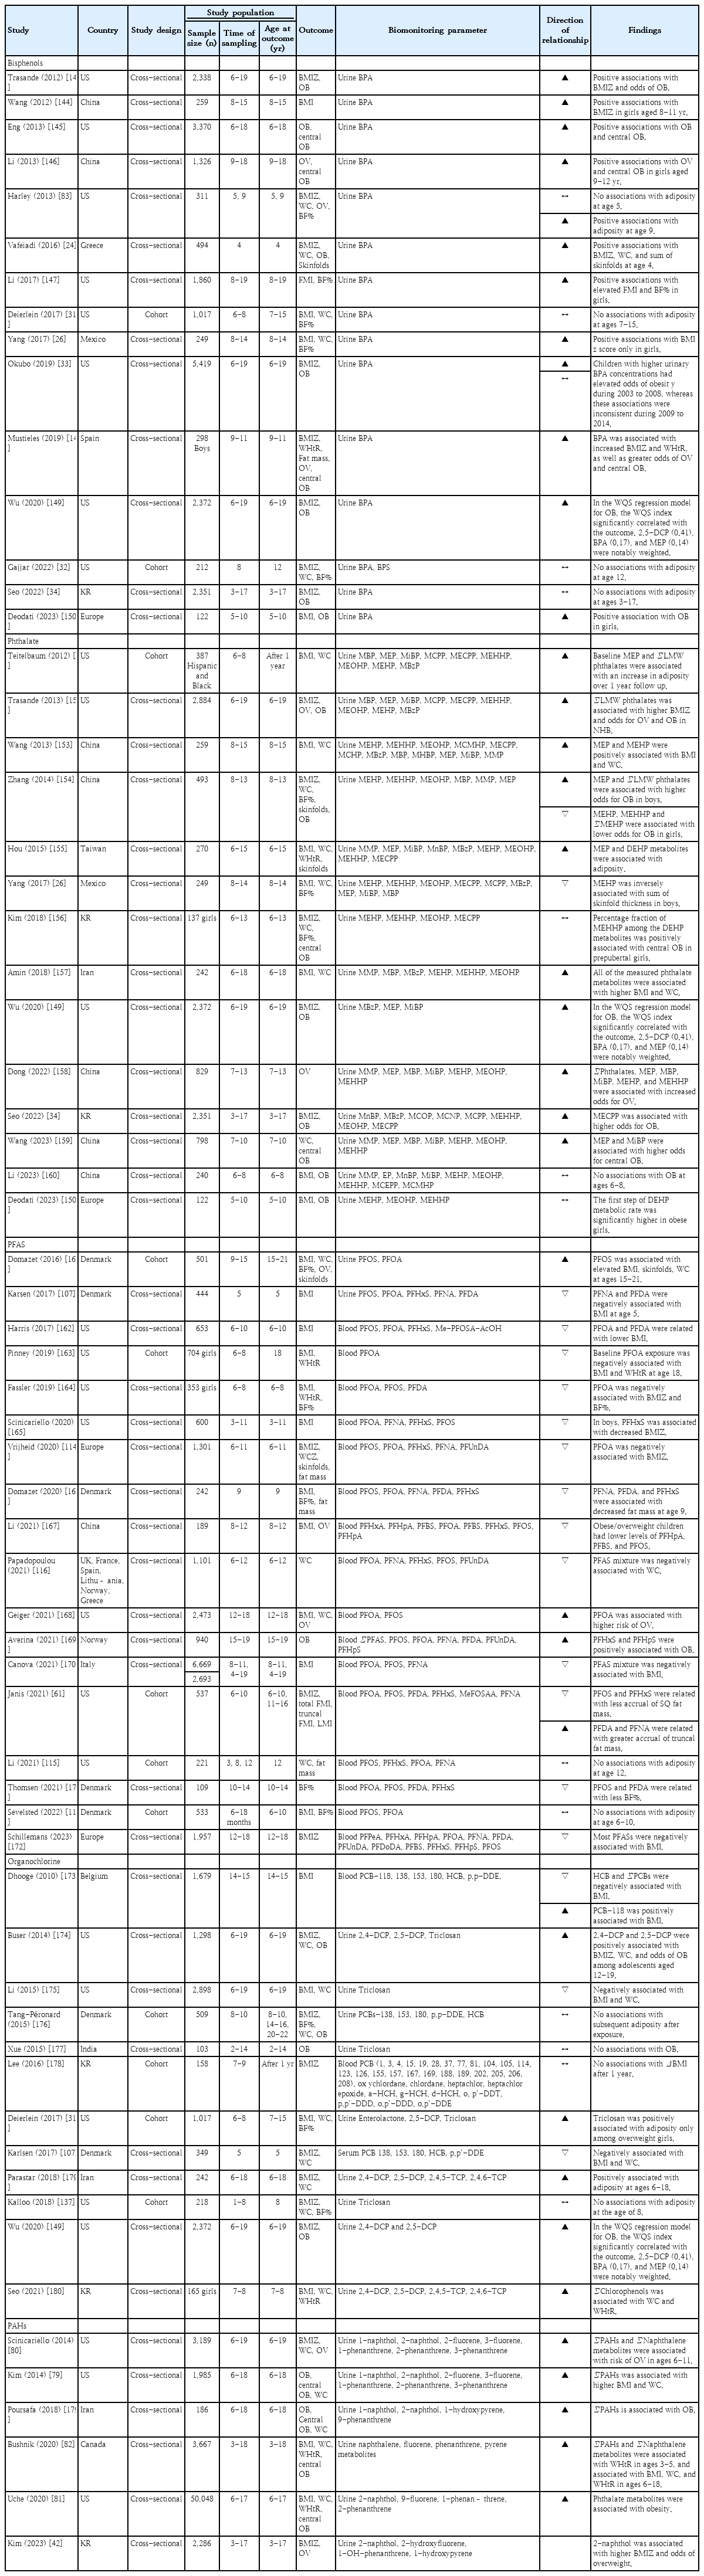
Postnatal exposure to EDCs and childhood obesity in epidemiologic studies
Phthalates
1. General characteristics
Phthalates, a group of phthalic acid diesters recognized for their ability to make plastics more flexible and durable, have been extensively used since their introduction in the 1920s [35]. These chemicals are added to polyvinyl chloride (PVC) plastics, which are found in diverse consumer products from packaging and flooring to toys and medical devices. Moreover, phthalates are applied in nonplastic products such as personal care products, detergents, and fragrances because of their ability to enhance scents and extend cosmetic durability. Phthalates can leach from these products into the environment and food sources, leading to human exposure.
Based on their molecular weight, phthalates are categorized into low molecular weight (LMW) and high molecular weight (HMW). LMW phthalates, which include phthalates with ester side-chain lengths of one to 4 carbons, are primarily used in personal care products and cosmetics [4]. Common LMW phthalates include dimethyl phthalate, diethyl phthalate, dibutyl phthalate (DBP), and diisobutyl phthalate. These phthalates are found in products such as nail polish to minimize chipping as well as in fragrances as scent stabilizers. Due to their lower molecular weight, LMW phthalates are not as tightly bound to the products, allowing them to off-gas or leach out more readily, especially when exposed to high temperatures. HMW phthalates, which have ester side-chain lengths of 5 or more carbons, are used in a wide range of products, particularly in those that require durability and flexibility. The key HMW phthalates include di (2- ethylhexyl) phthalate (DEHP), diisononyl phthalate, and diisodecyl phthalate. These phthalates are commonly found in PVC products such as plastic tubing, food packaging and processing materials, containers, vinyl toys, vinyl floor coverings, and building products. HMW phthalates are preferred in these applications because of their increased permanency and durability attributed to the longer carbon chains in their chemical structures.
The primary route of phthalate exposure is through ingestion, particularly from consuming food and beverages that have contacted materials containing them.36) Phthalates can also be absorbed through the skin via personal care products or other items containing these chemicals. Another exposure pathway involves inhaling dust or fumes from products that emit phthalates into the air.
Phthalates are metabolized in the liver through phases I and II enzymatic reactions, including hydrolysis, oxidation, and conjugation [36]. The metabolites are subsequently excreted primarily through the urine, although some are excreted via feces. The half-life of phthalates in humans varies depending on the specific compound; however, they are generally metabolized and excreted relatively quickly, often within 24–48 hours. Biomonitoring of phthalate exposure typically involves the measurement of phthalate metabolites in the urine (Supplementary Table 1). These metabolites reflect phthalate processing in the body and are considered reliable indicators of exposure. Advanced analytical methods have enabled the detection of multiple phthalate metabolites and provided a comprehensive assessment of exposure levels.
2. Impact on obesity in experimental studies
Extensive experimental studies explored the mechanisms by which phthalates contribute to obesity (Fig. 1). Several studies demonstrated that mono (2-ethylhexyl) phthalate activates PPARγ, which induces adipocyte differentiation and lipid accumulation [37,38]. Similarly, research on DEHP substitutes has shown that these compounds and their metabolites can accelerate adipogenesis through PPARγ activation in human mature adipocytes [39]. Phthalates such as DBP and DEHP exhibit antiandrogenic activity in vitro. For example, a study of reporter gene assays demonstrated that DBP, mono-n-butyl phthalate, and DEHP display potent antiandrogenic activity [40]. This antiandrogenic action suggests that phthalates can disrupt the normal function of androgens, which are critical for maintaining metabolic health and preventing obesity.
Phthalates, including DEHP, undermine thyroid function by blocking thyroid-stimulating hormone (TSH) receptors, attaching to thyroid hormone transport proteins and modifying iodine absorption in the thyroid follicle cells [41]. Thyroid hormones are crucial for regulating metabolism, and the disruption of thyroid function can lead to weight gain and obesity. Evidence suggests that phthalates can disrupt endocrine function and contribute to obesity via various epigenetic mechanisms. In particular, phthalate exposure is associated with altered DNA methylation and histone modifications in genes related to adipogenesis and insulin resistance [19]. These epigenetic changes can affect metabolic processes and have long-term health implications, including transgenerational effects.
Furthermore, a mouse model of prenatal DEHP exposure demonstrated long-term disruptions in glucose metabolism, energy expenditure, adipogenesis, and gut dysbiosis in the offspring. These disturbances demonstrate the interconnectedness between the host and the gut microbiota in terms of modifying energy metabolism [39].
3. Association with childhood obesity from epidemiological studies
Research into prenatal phthalate exposure and its effects on childhood obesity has been conducted in the US, China, Mexico, and Spain (Table 1). Their findings are mixed; while nearly half of these studies suggest that prenatal exposure may lead to increased BMI z scores, higher overweight risk, and accelerated adiposity in early childhood, other studies reported no significant effects or negative associations. Notably, 2 cohort studies, one each from China and the US, reported that certain phthalate metabolites had a negative impact on fetal growth but were linked to increased adiposity in early childhood [42,43]. Conversely, studies such as a recent Korean prospective study associated phthalate exposure with a reduced skeletal muscle index by 6 years of age [44]. This finding suggests a complex relationship between prenatal phthalate exposure and various aspects of childhood physical development, highlighting the need for further research to fully understand these dynamics.
Research on postnatal phthalate exposure and its impact on childhood adiposity has primarily been conducted in Asian countries, notably China, with several studies emerging from the US (Table 2). These studies consistently showed that LMW and HMW phthalates are associated with increases in BMI z scores, WC, and the likelihood of being overweight and obese in children. Specifically, findings from the KoNEHS highlight that mono-(2-ethyl-5-carboxypentyl) phthalate, a metabolite of DEHP, was linked to a higher odds of obesity among Korean children [45]. Research highlighted the sex-specific effects of phthalate exposure on obesity and revealed that female children might face lower risks of obesity, whereas male children are more likely to exhibit increased obesity odds [46]. This indicates a complex interaction between phthalate exposure and biological sex in determining the obesity risk among children.
Per- and polyfluoroalkyl substances
1. General characteristics
PFAS are synthetic compounds characterized by multiple fluorine atoms attached to an alkyl chain [47]. Their carbon-fluorine bonds, which are among the strongest in organic chemistry, contribute to their resistance to degradation in the environment and human body. Since their introduction in the 1940s, PFAS have been celebrated for their remarkable resistance to water, oil, and heat, leading to their integration into a wide array of products including non-stick cookware, water-repellent apparel, stain-resistant textiles, cosmetics, firefighting foams, and various grease-resistant applications [47]. These compounds are generally categorized by their functional groups into 2 main types: sulfonic acids, such as perfluorooctane sulfonic acid (PFOS), and carboxylic acids, such as perfluorooctanoic acid (PFOA). Additionally, PFAS are classified into short- and long-chain types based on their carbon chain lengths. PFOS and PFOA, 2 extensively studied and widely used PFAS compounds, have been phased out in several countries because of their environmental persistence and potential health risks [47]. Short-chain PFAS, characterized by 6 or fewer carbon atoms, have emerged as less bioaccumulative alternatives to their long-chain counterparts. However, they also exhibit high environmental mobility [48]. Despite ongoing efforts to identify safer substitutes, identifying alternatives that do not compromise product quality or safety remains a significant challenge (Supplementary Table 2).
PFAS, widely used in consumer products and industrial applications, pose significant exposure risks through contaminated drinking water originating from industrial discharges, firefighting foams at military and airport facilities, and waste site leachate [49]. Food packaging materials containing PFAS, including microwave popcorn bags and fast-food wrappers, can leach these chemicals into food. Moreover, PFAS infiltrate the food chain, thereby contaminating fish and seafood. Common items such as non-stick cookware, stain-resistant textiles, water-repellent clothing, and some cosmetics contain PFAS, leading to exposure through direct contact or inhalation of contaminated dust. Although less prevalent, occupational exposure can indirectly affect the families of workers who handle PFAS. Pregnant women and nursing infants are also at risk, as PFAS can transfer through the placenta and breast milk, prompting concerns regarding developmental impacts and long-term health risks [50].
Notably, the half-life of PFAS—the duration over which half of the substance leaves the body—can span several years. For instance, the estimated half-life of PFOA in humans is approximately 2.7 years, whereas that of PFOS may be approximately 3.4 years [51]. Thus, PFAS can persist in the body well beyond the cessation of exposure, with longer-chain PFAS and those featuring specific functional groups being eliminated more slowly. PFAS are notable for their resilience against metabolic breakdown, resulting in their prolonged presence and potential accumulation in the human body [51].
These substances withstand typical metabolic transformations and remain unchanged, leading to their gradual excretion, primarily through the urine. The elimination rate varies by PFAS variant, individual physiology, and exposure intensity. Key factors influencing excretion rates include PFAS chain length, chemical structure, and personal physiological differences such as age, sex, genetics, and overall health.
Blood serum levels serve as the principal biomarkers for PFAS exposure assessments, enabling the detection of diverse PFAS compounds and the evaluation of individual exposures [44]. Long-term monitoring of blood PFAS levels is critical because of their extended half-life and health implications. Additional biomarkers include PFAS detected in the urine, breast milk, and liver tissue, providing a comprehensive overview of an individual's exposure and accumulation.
2. Impact on obesity in experimental studies
Several in vitro and in vivo studies have provided significant insight into the adipogenic potential of PFAS (Fig. 1). A comprehensive study evaluated the adipogenic potential of 10 different PFAS in murine 3T3-L1 fibroblasts. One study reported that perfluorohexane sulfonate (PFHxS) significantly increased adipogenesis in the absence of rosiglitazone, a known PPARγ agonist, suggesting that PFAS can act through mechanisms independent of PPARγ activation [52]. Further investigations have demonstrated the complex interaction of PFAS with thyroid hormone processes, including competitive binding to thyroid transport proteins and the modulation of clearance enzymes, thereby affecting thyroid hormone signaling in both stimulatory and inhibitory manners [53]. PFAS exposure has also been linked to immune system activation, notably through the AIM2 inflammasome, resulting in increased proinflammatory cytokine production and subsequent tissue inflammation [54]. This suggests that PFAS exposure may foster chronic low-grade inflammation, disrupt metabolic function, and promote fat accumulation. A pivotal study highlighted the role of PFAS in body weight regulation, revealing that individuals with higher initial plasma PFAS levels experienced more significant weight regain postdieting, particularly among women, which is likely attributable to a decelerated decrease in resting metabolic rate, indicating a direct impact of PFAS on energy expenditure regulation [55].
3. Association with childhood obesity in epidemiological studies
Longitudinal studies on prenatal exposure to PFAS and their association with childhood obesity are presented in Table 1. Research across Europe, the US, and Asia on prenatal exposure to PFAS and childhood obesity has revealed significant findings. Among 28 reviewed studies, 20 suggested that prenatal PFAS exposure could lead to increased adiposity in children, with varying effects reported across studies. Interestingly, some studies suggested that exposure to legacy PFAS compounds such as PFOS and PFOA might be associated with lower adiposity at birth and during infancy but trigger rapid adiposity accretion in early childhood [56-58]. This pattern suggests a possible link between PFAS exposure and the risk of infants born small for gestational age catching up rapidly, which could predispose them to obesity. Additionally, a sex-specific impact is apparent, with girls exhibiting a higher susceptibility to obesity following PFAS exposure, whereas boys show null or negative associations [59,60].
Epidemiological studies, predominantly from Europe and the US, explored the association between postnatal exposure to PFAS and childhood obesity and revealed mixed outcomes (Table 2). Contrary to findings related to prenatal exposure, a significant proportion of these studies (14 of 18) identified negative associations between postnatal PFAS exposure and measures of childhood adiposity such as BMI z scores, WC, and body fat percentage. Importantly, a notable cohort study from the US highlighted that specific PFAS types might influence body composition in children in distinct ways [61]. For instance, higher PFOS and PFHxS levels were linked to decreased subcutaneous fat accumulation, whereas other types, such as perfluorodecanoic acid and perfluorononanoic acid, were associated with increased visceral fat accrual. Visceral fat is of particular concern because of its association with an elevated risk of cardiometabolic disease [62]. These findings imply that postnatal PFAS exposure may not uniformly contribute to obesity but could affect body fat distribution in a way that predisposes children to different health risks, underlining the need for nuanced approaches in assessing the health impacts of PFAS.
Organochlorines
1. General characteristics
Organochlorines, synthetic organic compounds characterized by covalently bonded chlorine atoms, have been extensively used in a range of applications including pesticides (e.g., dichlorodiphenyltrichloroethane [DDT] and lindane), solvents (e.g., carbon tetrachloride and trichloroethylene), and plastic production (e.g., PVC) since the early 20th century [63]. Chlorophenols, another important group within this class, have been utilized in wood preservation, disinfection, and as antiseptics owing to their antimicrobial properties [64]. In addition, some chlorophenols are produced during water chlorination or the bleaching of wood pulp with chlorine [64]. The organochlorine pesticide DDT gained prominence in the 1940s because of its ability to control malaria and other insect-borne diseases [63]. However, the environmental persistence and potential health risks associated with organochlorines, including chlorophenols, led to the restriction or outright ban of these compounds across several countries by the late 20th century [63].
Organochlorines, known for their lipophilicity, accumulate in fatty tissues because of their resistance to metabolic breakdown [65]. Although they undergo limited metabolism in the liver into more water-soluble metabolites, the process is slow, resulting in their gradual excretion, primarily through the feces and, to a lesser extent, urine [66]. The elimination of these compounds from the body can span years and is influenced by specific organochlorines and individual metabolic differences. For instance, the half-life of DDT and its metabolites in humans can extend to several years, with some studies suggesting a potential duration of 10 years or longer [65]. Conversely, chlorophenols exhibit comparatively shorter persistence, with their half-life in the human body ranging from hours to days depending on factors such as the specific chlorophenol compound, environmental exposure levels, and individual metabolic rates [65].
The primary routes of exposure to organochlorines are dietary intake, where they accumulate in the food chain; dermal absorption, particularly in agricultural settings; and inhalation, especially in industrial environments where they are produced or utilized [67].
Biomonitoring typically measures the concentrations and metabolites of organochlorine in the blood and adipose tissue (Supplementary Table 3). This approach effectively indicates the extent of chemical accumulation in individuals and underscores the critical need for ongoing surveillance, particularly among at-risk groups, to manage and mitigate associated health risks [67].
2. Impact on obesity in experimental studies
Evidence from in vitro and in vivo studies suggests a link between organochlorine exposure and obesity, highlighting its potential obesogenic effects (Fig. 1). Organochlorines interfere with thyroid hormone signaling pathways, which are essential for metabolism and energy regulation. In vitro studies have shown that DDT inhibits TSH release and can hinder TSH receptor activity [68]. Additionally, organochlorines facilitate adipogenesis by activating PPARγ in various cell lines, including hepatocytes and 3T3-L1 [69].
Exposure to organochlorines results in epigenetic changes that can lead to obesity and metabolic disorders. Studies have shown that organochlorine exposure can result in hypomethylation of the PPARγ promoter and/or histone H3 (H3K27me3), which promotes adipogenesis and contributes to lipid accumulation and obesity [19].
Organochlorines reduce the thermogenic capacity of brown adipose tissue by affecting the expression of uncoupling protein-1 and β-adrenergic receptors, key components of the thermogenic machinery in brown adipocytes [18]. Moreover, organochlorines have been implicated in increased oxidative stress and inflammation, thereby contributing to the development of insulin resistance and disruption of glucose metabolism [70].
Additionally, organochlorines, including DDT and hexachlorocyclohexane, have been shown to alter the gut microbiota, leading to changes in bile acid metabolism and increased obesity risk in murine models [45].
3. Association with childhood obesity in epidemiological studies
Research investigating the impact of prenatal exposure to organochlorines on childhood obesity has been predominantly conducted in Europe and North America (Table 1). Among these studies, a significant number (17 of 22) indicated that prenatal exposure to organochlorines, such as DDT, PCB, and HCB, is linked to various indicators of adiposity in children. These indicators included the BMI z score, fat mass index, trunk fat percentage, and skinfold thickness. Notably, only a small subset of these studies reported no significant association, highlighting the complex nature of the relationship between prenatal organochlorine exposure and childhood obesity.
Research is relatively sparse on the effects of postnatal organochlorine exposure on childhood obesity (Table 2). Despite the heterogeneity in the chemicals evaluated across these studies, approximately half suggested that such exposure could contribute to increased childhood adiposity as indicated by metrics such as BMI z score, WC, and body fat percentage. However, the other half found no significant or negative relationships. Nonetheless, a study from the US identified a specific increase in adiposity linked to triclosan exposure, with this effect exclusively observed in overweight girls, suggesting that the effects of organochlorine exposure may be contingent on the child's pre-existing body composition [27]. Furthermore, a study from Korea observed a positive association between urinary chlorophenol levels and central adiposity in 7–8-year-old girls [71], which corroborates the findings of similar cross-sectional studies in Iran [72] and the US [73]. These observations highlight the need for comprehensive research to fully elucidate the relationship between postnatal organochlorine exposure and childhood obesity.
Polycyclic aromatic hydrocarbons
1. General characteristics
PAHs are a significant group of organic compounds composed of 2 or more fused aromatic (benzene) rings that are created through incomplete combustion or pyrolysis of organic materials such as coal, oil, gas, wood, garbage, and tobacco [42]. PAHs are ubiquitous in the environment including the air, water, soil, and food. PAHs have been the focal point of environmental health studies for many decades because of their potential carcinogenic and mutagenic properties. In 1983, the United States Environmental Protection Agency identified 16 PAHs as priority pollutants, underscoring concerns regarding their exposure, resilience, and toxicity [43]. These compounds are characterized by low water solubility, low vapor pressure, and high melting and boiling points, which contribute to their stability and persistence in the environment that create long-term ecological and health risks.
PAHs are categorized based on their molecular weights into LMW and HMW types [44]. LMW PAHs, which comprise 2 or 3 aromatic rings, are generally more volatile and water-soluble, which enhances their biodegradability. In contrast, HMW PAHs, which comprise 4 or more aromatic rings, tend to persist in the environment and bioaccumulate because of their stability and lipophilicity. Furthermore, PAHs are classified as alternants, which consist of only 6 carbon benzene rings, or nonalternants, which incorporate rings with fewer than 6 carbon atoms. The symmetrical electron distribution of alternant PAHs contributes to their environmental persistence, whereas nonalternant PAHs, with their irregular structures, may display varied chemical reactivities and environmental behaviors (Supplementary Table 4).
PAH exposure in humans predominantly occurs through inhalation, ingestion, and dermal contact, all of which are linked to various anthropogenic and natural sources [42]. Anthropogenic activities, including waste incineration; production processes in the iron, steel, aluminum, and cement industries; coal-tar pitch and dye manufacturing; and asphalt and rubber tire manufacturing, significantly contribute to environmental PAH pollution. Although less prominent, natural events such as volcanic eruptions and forest fires also contribute to ambient PAH levels. Inhalation exposure arises from air pollution, encompassing tobacco, wood smoke, and asphalt fumes, and presents a common risk, particularly in urban settings and among smokers [42]. Ingestion is another significant route, with PAHs entering the human diet through the consumption of grilled, smoked, or charred food items, including meat and various plant-based foods prepared over open flames that absorb these compounds during cooking [42]. Additionally, dermal contact with contaminated soil, dust, or direct handling of PAH-containing materials in occupational settings poses risks, facilitating the absorption of PAHs through the skin [46].
Upon entering the human body, PAHs undergo metabolism, predominantly in the liver and kidneys, facilitated by cytochrome P450 enzymes [42]. This metabolic process leads to the formation of hydroxy derivatives (OH-PAHs), which are subsequently eliminated via the bile and urine. Moreover, PAHs may accumulate in the adipose tissue and can be secreted in breast milk [74]. The biological half-life of these compounds varies, with 1-hydroxypyrene having a half-life of approximately 3.9 hours, whereas other OH-PAHs have a half-life of 2.5–6.1 hours [75]. In terms of monitoring PAH exposure, 1-hydroxypyrene serves as a commonly used urinary biomarker indicative of PAH exposure a few days before sampling. Other detectable urinary OH-PAHs offer insight into PAH exposure extent and recency (Supplementary Table 4).
2. Impact on obesity in experimental studies
Several laboratory studies elucidated the biological and molecular pathways through which PAHs contribute to obesity development (Fig. 1). A recent study revealed that PAH exposure leads to the increased proliferation of 3T3-L1 preadipocytes and lipogenesis along with elevated expression levels of genes including Fasn, Acaca, Cebpa, Pparg, Fabp4, Plin1, Rarres2, Adipoq, and Retn, which are crucial for adipocyte differentiation and fat cell development [76]. These changes have been associated with altered methylation of target genes, including PPARγ [19].
Benzo [a]pyrene, an extensively studied PAH compound, disrupts the normal process of fat breakdown within adipose tissues by impairing β-adrenergic stimulation, resulting in a notable increase in body weight and fat accumulation in mice [71]. Furthermore, naphthalene metabolites obstruct thyroid hormone receptor-mediated transcription in laboratory settings, potentially decreasing the basal metabolic rate and hindering fat breakdown within adipose tissues [72].
Chronic PAH exposure has been linked to increased expression of inflammatory cytokines (e.g., Tnfα, Il-1β, and Il-6) in fat cells and macrophages, indicating an inflammatory response that may further contribute to obesity [73].
3. Association with childhood obesity from epidemiological studies
Research into the link between prenatal exposure to PAHs and childhood obesity has predominantly relied on personal air monitoring, although such studies are relatively few (Table 1). Cohort studies in the US demonstrated that prenatal exposure to PAHs is associated with increased measures of adiposity in children, such as higher BMI z scores and body fat percentages, particularly at age 5–7 years [77]. Nevertheless, further analyses of BMI growth patterns suggested that the initial differences in adiposity observed in early childhood tend to decrease by adolescence [78].
Research on the association between postnatal exposure to PAHs and childhood obesity primarily used cross-sectional data, predominantly from North America (Table 2). These studies consistently highlighted the potential impact of PAHs on increasing the risk of obesity in children. Notably, NHANES data have shown associations between total urinary levels of PAH metabolites, including naphthalene, and higher instances of overweight and central obesity in the US pediatric population aged 6–19 years [79-81]. Additionally, a national study conducted in Canada observed positive associations between PAH metabolites and central obesity in children aged 3–5 years and 6–18 years, underscoring the pervasive nature of this relationship across different cohorts at younger ages [82]. Remarkably, KoNEHS data identified a significant association between 2-naphthol, a primary naphthalene metabolite, and obesity in Korean children aged 6–11 years, suggesting that regular physical activity might mitigate this effect [42]. These findings underscore the importance of monitoring PAH exposure and advocating preventive measures, including increased physical activity, to protect children against the obesity-related risks associated with environmental pollutants.
Conclusions
Research suggests potential associations between early-life exposure to EDCs, including bisphenols, phthalates, and PAHs, and the risk of obesity in children. This body of research, which encompasses both experimental and epidemiological investigations, underscores the adverse impact of EDCs on key biological processes such as hormonal regulation, metabolic function, and adipogenesis, which may collectively predispose children to obesity. Variability in the observed effects has been noted, likely attributable to differences in the concentration of exposures, timing relative to developmental stages, outcome assessment methods, and potential interactive effects of concurrent exposure to multiple EDCs. While the exact mechanisms remain under investigation, these findings highlight the need for further research to understand how EDC mixtures contribute to pediatric obesity and guide public health strategies for reducing EDC exposure.
Supplementary material
Supplementary Tables 1-4 are available at https://doi.org/10.3345/cep.2024.00556.
Biomonitoring of phthalate exposure: common phthalates and their metabolites
Overview of widely studied PFAS compounds
Organochlorines and their metabolites for biomonitoring
Polycyclic aromatic hydrocarbons representatives and their metabolites
Notes
Conflicts of interest
No potential conflict of interest relevant to this article was reported.
Funding
This study received no specific grant from any funding agency in the public, commercial, or not-for-profit sectors.