Differences in immune cells and gene expression in human milk by parity on integrated scRNA sequencing
Article information

Abstract
Background
Human breast milk (HBM) is an important source of tolerogenic immune mediators that influence the infant immune system. HBM-derived immune components are affected by various factors; however, few studies have examined the relationship between parity and immune cell profiles of HBM.
Purpose
This study aimed to clarify the effects of parity on HBM immune cell heterogeneity and gene expression by integrating and analyzing publicly available single-cell RNAsequencing (scRNA-seq) datasets.
Methods
We clarified the effects of parity on HBM immune cell heterogeneity and gene expression by integrating and analyzing publicly available scRNA-seq datasets.
Results
The proportion of innate immune cells was significantly higher in the primiparous versus multiparous group, whereas the proportion of adaptive immune cells was significantly higher in the multiparous group (P=0.021). The 2 immune clusters were reannotated and classified into monocyte, T/B cell, and CD45¯ groups. The proportions of monocytes and T/B cells were higher in the primiparous and multiparous groups, respectively. In a gene set enrichment analysis of monocytes, genes with a direct role in the infant immune system and immune response-related genes were more highly expressed in the primiparous group.
Conclusion
Our results support the parity-dependent differences in gene expression between innate and adaptive immune cells.
Key message
Question: Is there a difference in immune cells in human breast milk by parity?
Finding: There were higher proportions of monocytes and T/B cells in the primiparous and multiparous group, respectively. The expression of genes with a direct role in the infant immune system and immune response-related genes were highest in the primiparous group
Meaning: There were parity-dependent differences in the expression of genes between innate and adaptive immune cells.
Graphical abstract. UMAP, uniform manifold approximation and projection.
Introduction
Human breast milk (HBM) is essential for early human growth and development. HBM contains immune components such as secretory IgA required for immune complex formation and disease prevention in infants, besides containing water and nutrients, such as proteins, carbohydrates, and lipids [1-4]. These HBM components can be affected by various maternal and environmental factors, such as lactation stage, maternal body mass index (BMI), and maternal diet [1,2]. For instance, HBM immune components can be different between preterm and term pregnancies. Also, HBM immune components can change during the stages of lactation including colostrum, transitional and mature milks. However, it is largely unknown about the relationship of parity with the components of HBM.
With the recent advance of molecular biology, single-cell RNA sequencing (scRNA-seq) analysis has become available offering in depth cellular characterization on heterogeneity and gene expression program at the single-cell level in health and disease [5,6]. In particular, the analysis of publicly available datasets can provide unprecedented biological insights by integrating independent analyses [7-9]. Most of the previous scRNA-seq research on pregnancy has been conducted using mammary tissue or confirmed differences between pregnancy and nonpregnancy [10]. There are still relatively few studies related to scRNA-seq of HBM [11-14]. Therefore, we investigated parity-dependent variations in the immune cells and gene expression of HBM using publicly available scRNA-seq datasets of HBM.
Methods
1. Data collection and preprocessing
We searched the scRNA-seq-related studies of HBM through PubMed, Google Scholar, Embase, Web of Science, and Scopus databases and identified a total of 4 articles [11-14]. We downloaded the related datasets from the following open-source datasets: (1) https://www.ncbi. nlm.nih.gov/geo/query/acc.cgi?acc=GSE153889 (GEO accession GSE153889), (2) github.com/aleciajane/LactatingMammaryCells.git; "E-MTAB-9841" (Batch 1), "E-MTAB-10855" (Batch 2) and "E-MTAB-10885" (Batch 3), (3) Broad Data Use Oversight Sy stem (broadinstitute.org); DUOS-000140 and https://singlecell.broadinstitute.org/single_cell/study/SCP1671, and (4) doi.org/10.5281/zenodo.5784799. Among the 4 datasets, 2 datasets were finally selected because they provided clear information on the collection times of HBM samples and parity of the lactating mothers and could be integrated with other datasets in the Seurat package (ver. 4.2.1) in R program (ver. 4.2.0) [11,12]. Among the samples collected from 11 donors in the 2 datasets, none of the samples was colostrum or transitional milk. The samples from 3 subjects collected in the late mature milk stage (postnatal 8, 8, and 12 months, respectively) were excluded. For one donor who provided the sample twice on the same date, only the dataset of the freshest sample was selected. Finally, the datasets of the early mature HBM collected from 8 donors were selected and divided into a primiparous group and a multiparous group according to parity. Quality control for exclusion of low-quality cells and doublets was performed with the following criteria in the R program: (1) specific genes are expressed in less than 3 cells, (2) cells that have unique feature counts over 6,000 or less than 200, and (3) cells that have greater than 10% of mitochondrial genes.
2. Data integration and clustering
After log normalization of datasets from 8 donors, we first integrated the individual data from 4 primiparous groups and 4 multiparous groups using FindIntegrationAnchors and IntegrateData in the Seurat package. Then, the 2 resultant datasets were integrated into a single dataset. We implemented a standardized workflow for visualization and clustering of the integrated dataset, using scaling (with ScaleData), principal component analysis (PCA with RunPCA), and uniform manifold approximation and projection (UMAP with RunUMAP). We used the FindIntegrationAnchors and IntegrateData functions with a dimensionality of 30 to remove potential batch effects in single-cell data integrated from different datasets into the shared space. Based on the shared nearest neighbor-based algorithm, we identified clusters at a resolution of 0.65. The FindMarkers and FindAllMarkers functions in the Seurat package were used for the differential expression to identify cluster-specific marker genes or compare the characteristics between clusters or groups. Cell counts and proportions of each cluster were confirmed using the table and prop. table functions.
3. Analysis for confirmation of immune cell clusters and integration, clustering, and annotation of immune cells
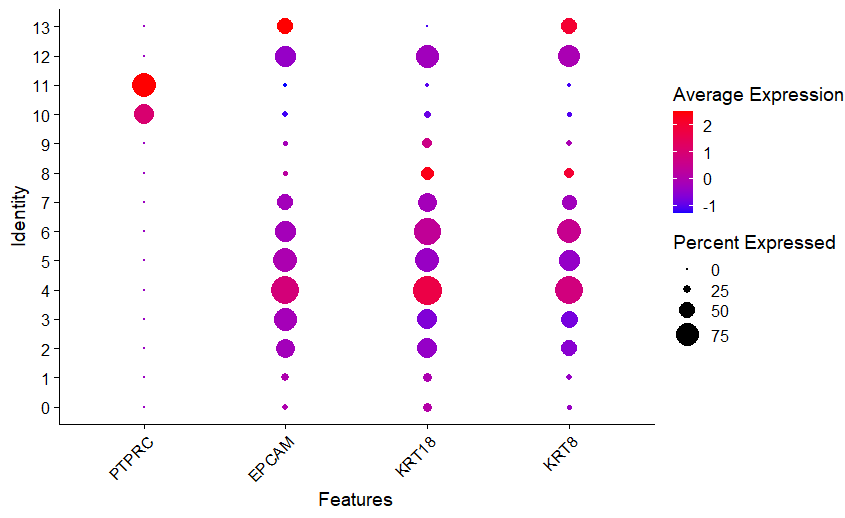
We relied on widely recognized marker genes used in previous studies to annotate the entire cluster of integrated data into an immune cell cluster and nonimmune cell cluster, including cells of epithelial origin [11,13,14]. The PTPRC (CD45) gene, a hematopoietic cell marker, and the EPCAM, KRT18, and KRT8 genes, which are epithelial or luminal cell markers, were chosen as markers to distinguish immune cell clusters and nonimmune cell clusters. In immune cell clusters, the CD14, CD68, FCGR3A (CD16a), IL1B, IRF8, CD83, ANPEP (CD13), and ITGAM (CD11b) genes were used to confirm the innate immune cells, and the CD3E, CD3D, CD69, NKG7, TRAC, IL7R (CD127), CD8A, and CD19 genes were used to distinguish the adaptive immune cells.
We generated a single immune cell dataset by integrating 2 immune cell clusters (innate immune cell cluster and adaptive immune cell cluster). By rescaling the integrated data, a new clustering of immune cells was created. Cell type annotations were achieved using well-known markers for immune cells including monocytes, T, and B cells. Furthermore, we evaluated the expression of genes associated with macronutrients (proteins, fatty acids, cholesterol, triglycerides, and carbohydrates) in the regenerated immune cell cluster.
4. Comparison of gene expression according to parity and gene ontology pathway functional enrichment analysis
After annotation and grouping of immune cell clusters, differentially expressed gene (DEG) analysis was performed using the limma package in the R package. The adjusted P values for individual genes were obtained using the Benjamini-Hochberg method. DEGs between 2 groups were determined based on an adjusted P value <0.05 and log2fold change (log2FC) >0.58. We identified significantly expressed genes in the primiparous and multiparous groups, respectively, by comparing the primiparous group versus the multiparous group.
Gene ontology (GO) annotation pathway enrichment analysis using the R package clusterProfiler (ver. 4.2.4) [15]. The adjusted P values were calculated using the Benjamini-Hochberg method, and the cutoff of adjusted P values <0.05 was set as significant. Gene set enrichment analysis (GSEA) was performed in each of the 2 immune cell clusters to identify classes and the association of highly expressed genes with disease phenotypes in primiparous and multiparous groups.
5. Statistical analysis
Statistical analysis for comparison of clinical data in the open information collected was performed using R (ver. 4.2.0; R Foundation for Statistical Computing, Vienna, Austria) and the statistical software SPSS 18.0 for Windows (SPSS Inc., Chicago, IL, USA). The chi-square test and the Wilcoxon test were used to analyze between-group differences, and P values <0.05 were considered significant.
Results
1. Characteristics of integrated HBM single-cell dataset and confirmation of immune cell clusters
To determine the possible relationship of parity with immune cell profile at the single-cell level, the integrated dataset was grouped into primiparous and multiparous groups according to parity. The mean postnatal time was 9.5 weeks (range, 2–16 weeks), and there was no significant difference in postnatal time between the primiparous and multiparous groups (8, 12, 12, and 16 weeks vs. 2, 2, 8, and 16 weeks, P=0.225). In total, 113,147 cells (primiparous: 84,109 and multiparous: 29,038) were included in this integrated analysis after quality control of the raw scRNA-seq dataset (Supplementary material 1). Clustering analysis identified 14 clusters based on the marker genes of each cluster (Fig. 1A and B; Supplementary material 2). Of the 14 clusters, clusters 10 and 11, which had the hematopoietic cell marker PTPRC expression without the expression of epithelial or luminal cell markers EPCAM, KRT18, and KRT8, were identified as immune cell clusters (Fig. 1C and D; Supplementary material 3). UMAP of the total clusters revealed distinct clusters arising from differences in parity (Fig. 1E).
Characteristics of integrated human breast milk single-cell dataset. (A) UMAP of integrated human breast milk single cell dataset. (B) Heatmap of total integrated clusters. (C) Violin plot of hematopoietic cell marker gene and epithelial and luminal cell marker genes. (D) Feature plot of hematopoietic cell marker gene and epithelial and luminal cell marker genes. (E) UMAP divided by parity. UMAP, uniform manifold approximation and projection.
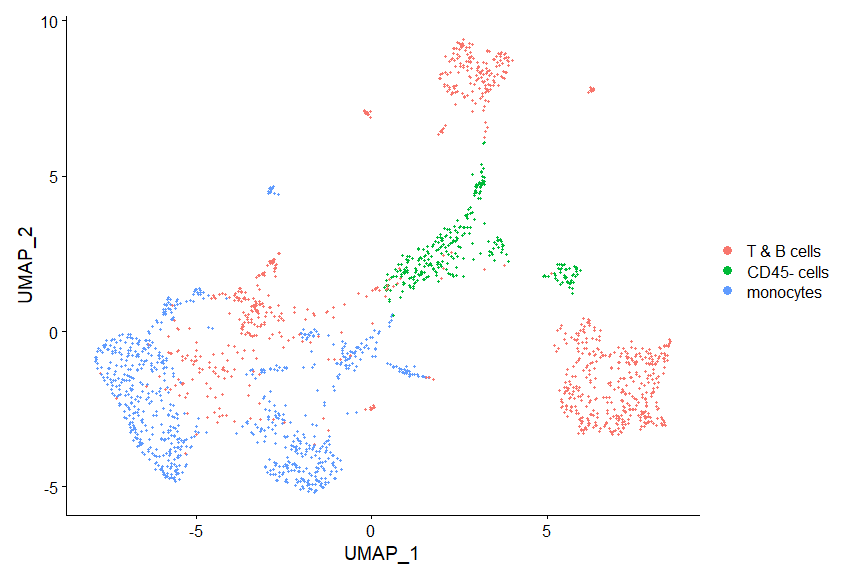
We annotated clusters according to the expression of generally known immune marker genes and found that 2 hematopoietic clusters were divided into innate (cluster 10; Fig. 2A and B) and adaptive immune cells (cluster 11; Fig. 2A and C) while non-hamatopoietic cells without expressing PTPRC were nonimmune cells (Fig. 2D-F). Of note, the B-cell marker gene CD19 was not significantly expressed in the total 14 clusters. Both annotated immune cell clusters (innate and adaptive immune cell clusters) were group according to parity (Fig. 2G and H; Supplementary material 1). We compared the cell count and proportion of each immune cluster in total immune and nonimmune cells between primiparous and multiparous groups. The cell counts and proportions (%, shown in brackets) of the innate immune cluster in the primiparous and multiparous groups were 1,116 (1.33%) and 178 (0.613%), respectively. The cell counts and proportions (% of total cells in each group, shown in brackets) of the adaptive immune cluster in the primiparous and multiparous groups were 444 (0.523% of 84,109) and 219 (0.754% of 29,038), respectively. The primiparous group had a higher cell proportion of the innate immune cell cluster but a lower proportion of the adaptive immune cluster than the multiparous group (Fig. 2I) (P=0.021).
Confirmation of immune cell clusters. (A) Dot plot of immune marker genes. (B) Violin plot of innate immune cell marker gene. (C) Violin plot of adaptive immune cell marker gene. (D) Annotated UMAP (innate immune cells, adaptive immune cells, and nonimmune cells). (E) UMAP of innate immune cells. (F) UMAP of adaptive immune cells. (G) UMAP of innate immune cells by parity. (H) UMAP of adaptive immune cells by parity. (I) Cluster proportion of innate and adaptive immune cells by parity. UMAP, uniform manifold approximation and projection.
2. Analysis of the immune cells
In order to further subdivide the immune cell clusters, both the innate immune cell cluster and the adaptive immune cell cluster were extracted and integrated. Through an analysis of the integrated immune clusters, we identified and annotated 11 clusters based on the marker genes of each cluster (Fig. 3A and B; Supplementary materials 4 and 5). The immune cells were largely grouped into monocytes (clusters 3, 4, 5, 7, and 8), T (clusters 0, 1, 6), B cells (cluster 10), and less characterized cells (clusters 2 and 9) (see counts and proportions in Supplementary materials 6 and 7). Then, we compared the cell proportion by parity (Fig. 3C and D). In the monocytes cluster group, the cell count and proportion (shown in brackets) of the primiparous and multiparous groups were 765 (0.49038462) and 26 (0.06549118), respectively. In the T/B-cell cluster group, the cell count and proportion of the primiparous and multiparous groups were 580 (0.37179487) and 298 (0.75062972), respectively. In the comparison between the innate and adaptive immune cell clusters, the proportions of monocytes and T/B cells were higher in the primiparous group and multiparous group, respectively, but the significance was low (P=0.060). In the cluster group in which PTPRC expression was insignificant, there was little difference according to parity (215 (0.13782051) versus 73 (0.18387909), respectively). Of the 5 monocyte clusters, one cluster (cluster 8) had high expression of dendritic cell markers, and another cluster (cluster 7) had high expression of CD14 genes and low expression of FCGR3A genes with epithelial marker expression (Supplementary material 6). In the other 3 clusters (clusters 3, 4, and 5), high expression of CD14 and FCGR3A was confirmed, and expression of the SELL (CD62L, L-selectin), CCR2, and CX3CR1 genes was confirmed in cluster 4 (Supplementary material 6). The 3 T-cell groups were annotated into NK+ (cluster 0), CD4+ (cluster 1), and NK+CD8+ T cells (cluster 6), respectively (Supplementary material 6). Although the cell frequency was small, the B-cell cluster (cluster 10) was also identified in the integrated immune cells (Supplementary material 6). Finally, the total immune cluster was annotated (Fig. 3E).
Characteristics of integrated immune cells. (A) UMAP of integrated immune cells. (B) Heatmap of integrated immune clusters. (C) Comparison of immune cells cluster proportions by parity. (D) Cluster proportion of monocytes, T/B cells, and PTPRC-negative cells by parity in integrated immune cells. (E) UMAP of annotated immune cells. UMAP, uniform manifold approximation and projection.
3. Gene expression in immune cells according to parity
We compared the expression levels of individual genes in the monocyte and T-cell cluster groups between primiparous and multiparous groups. We also performed GSEA to interrogate whether DEGs were enriched in certain biological pathways of GO. The expression of 35 genes, such as S100A8, S100A9, TIMP1, CD14, IL1B, CCL4, FCGR2A, and CCL3, was significantly higher in the primiparous group of monocytes (upregulated in the primiparous group) (Fig. 4A; Supplementary material 8A). In the multiparous group, 11 genes, such as SNGH29, EEF1G, CCL17, CD5, and CD2, were significantly upregulated (downregulated in the primiparous group). Significant DEGs were designated by GSEA (Fig. 4B). Genes annotated to GO terms related to inflammatory, cellular, and immune responses were found to be expressed at a higher level in monocytes in the primiparous group.

DEGs and GSEA results of monocyte group and T-cell group. (A) DEGs of the monocyte group. (B) GSEA result of the monocyte group. (C) DEGs of the T-cell group. (D) GSEA result of T-cell group. DEGs, differentially expressed genes; GSEA, gene set enrichment analysis.
In the T cells, the expression of 138 genes, such as CSN1S2AP, SNHG5, RPL18AP3, LRRC75A-AS1, CXCL3, CXCL8, and CCL3, were significantly higher in the primiparous group than in the multiparous group, and 142 genes, including GNB2L1, ATP5E, ATP5L, GLTSCR2, ATP5B, and CD81, were significantly higher in the multiparous group than in the primiparous group (Fig. 4C; Supplementary material 8B). Significant DEGs designated by GSEA as involved in cellular metabolic processes were expressed higher in the T-cell cluster of the multiparous group (Fig. 4D).
4. The expression of macronutrient-associated genes in integrated HBM cells and immune cells
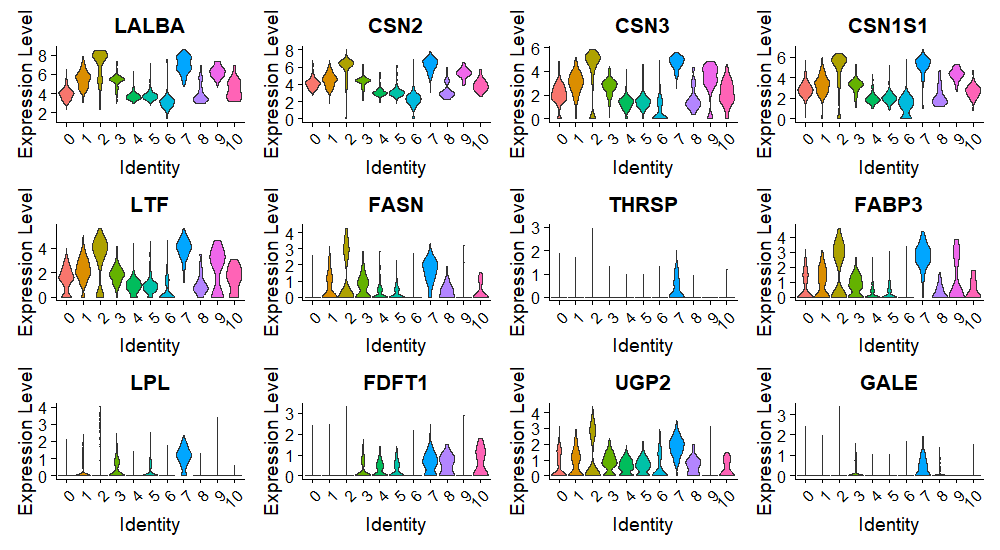
We identified the expression of marker genes associated with milk proteins (LALBA [lactalbumin], CSN2 [casein], CSN3, CSN1S1, and LTF [lactotransferrin]), fatty acids, triglycerides, cholesterol (FASN, FABP3, LPL, and FDFT1), and carbohydrates (UGP2). In the total integrated clusters of HBM collected from 8 donors, protein markers were expressed in all clusters, including 2 immune clusters (Fig. 5A; Supplementary material 9). The genes associated with fats and carbohydrates were not expressed in all clusters, but their expression in the innate and adaptive immune clusters was confirmed. The expression of each macronutrient-associated gene was also detected in the integrated immune clusters, including 2 PTPRC-negative clusters (Fig. 5B). Protein marker genes were evenly expressed in almost all clusters, but fat-associated genes were mainly expressed in the monocyte and PTPRC-negative clusters.
Expression of macronutrient marker genes in human breast milk cells and immune cells. (A) violin plot of integrated immune cell clusters. (B) Violin plot of immune cell clusters.
Discussion
The importance of immune components in HBM is no longer emphasized. However, 87% of HBM is composed of water, and the proportion of immune cells is not very high [1,2]. In addition, the cells of epithelial or luminal origin also occupy a large portion of the solid components in HBM, and the various components of HBM are mixed and play multiple roles. Therefore, scRNA-seq can be a meaningful technique to identify the immune cells of HBM and reveal its characteristics. Some studies have already used scRNA-seq analysis to identify HBM cells and changes according to the lactation stage or transcriptional changes in the mammary gland [11-14]. Furthermore, the immune cells were analyzed in more detail, and the presence of various genes was confirmed.
Immediately after birth, the transition from the protected uterine environment to the outside world poses several demands and challenges. In this process, initial immunity, such as the formation of the intestinal epithelium, gut microbiota, and direct immune response, is essential, and the immune components in HBM play an important role in this process. In addition, pregnancy, childbirth, and lactation induce major immunological changes, both for the newborn and the pregnant woman [16]. However, in previous studies related to scRNA-seq of HBM, analysis of these clinical implications of the immune system has not been mainly performed. Moreover, the change in immune cells according to parity, which is the number of births a woman has had in her past, has not been confirmed. Our study is valuable because it identified the difference in immune cells of HBM according to parity and analyzed its clinical importance.
First, we performed an integrated analysis of scRNA-seq datasets from previous studies and identified 113,147 cells in 14 clusters from 8 donors after quality control. Based on the expression of the PTPRC (CD45) gene, it was confirmed that 2 clusters were immune cells, and according to the characteristics of the markers, they could be divided into innate immune and adaptive immune, and their proportion of the total cell counts was 1.14% and 0.59%, respectively. Among the cells found in HBM, progenitor cells, mammary stem cells, epithelial cells, lactocytes, and myoepithelial cells originate from the duct or skin of the breast, but immune cells, hematopoietic stem cells, and hematopoietic progenitor cells are known to originate from blood [17-19]. In general, lactated infants consume 108 immune cells, with macrophages and neutrophils accounting for a larger proportion and lymphocytes occupying a relatively smaller proportion [20]. It is known that leukocytes are the most abundant in colostrum and gradually decrease with the lactation stage. Trend et al. identified 23,650 cells/mL of leukocytes in mature milk about 30 days after delivery [21,22]. In addition, the frequency of each component also changes slightly according to the lactation stage, and the leukocyte levels in HBM change in response to lactation and infant infection [1,21]. As lactation progresses, there is a decrease in the proportion of CD45+ leukocytes, myeloid cells, B-cell precursors, and CD16- monocytes, and in mature milk, immature granulocytes increase [23].
For a more accurate comparison of the influence of parity and to minimize the confounding effect of the lactation stage, we only analyzed early mature milk in a relatively stable state. Nevertheless, the number of cells was not large, and there was a slightly higher proportion of adaptive immune cells than innate immune cells. Perhaps this was due to the elimination of the dead cells through quality control before analysis rather than simply analyzing the total cells that they were identified in HBM, and the differences in sample collection or according to the study were affected. The composition of lymphocytes in HBM includes around 80% CD3+ T cells, 10% gammadelta T cells, 3%–4% CD16+ NK cells, and 2% B cells [20]. In our study, most of them were CD3+ T cells, and the proportion of B cells was 3.3%.
Monocytes increase during pregnancy [16,24-26]. In particular, intermediate monocytes increase, classical monocytes decrease, and the proportion of non-classical monocytes does not change [16]. By contrast, lymphocytes decrease during pregnancy, including the level of T cells, especially the T helper cells and cytotoxic T cells [16,27]. However, neither the absolute total lymphocyte count and proportion of T cells nor the absolute level of the total B cells change with the trimester of pregnancy [16,27]. Nonetheless, there is a change in the B cells subset. Chen et al. [28] confirmed that DEGs related to B-cell function were downregulated in the peripheral blood of pregnant women. In addition, they confirmed the downregulation of genes associated with B-cell activation, such as MS4A1, CD79B, and BLNK. These changes in the blood of pregnant women have also been identified in HBM after childbirth.
As mentioned above, HBM has a high ratio of monocytes and a low ratio of lymphocytes. These results were also confirmed in cell-level assays through scRNA-seq. In our analysis, classical monocytes (CD14++CD16–), the main monocyte subset in peripheral blood of healthy adults, were not identified, and all 5 monocyte clusters were CD14++CD16++ monocytes, CD14++CD16+ monocytes, or dendritic cell clusters. These dynamic changes in the immunological components demonstrate the major systemic immunological adaption during pregnancy [16,29].
However, the increase in monocytes and the decrease in T/B cells in pregnant women compared to nonpregnant women tended to be prominent in the HBM of primipara, while the HBM of multipara tended to be different in the cell proportion. Reflecting on the overall cell frequency and immune cell frequency, it was confirmed that there was an interesting difference in the immune cell proportion according to parity. In the primiparous group, the proportion of cells in the innate immune cell cluster and the subdivided monocyte group were significantly higher than those in the multiparous group. In the multiparous group, it was slightly increased proportions of adaptive immune cell clusters and subdivided T/B cells. We considered whether these differences might be the effect of the lactation stage, but it was not possible to examine this further because the postpartum period of the multiparous group, which showed a decrease in the proportion of monocytes, was about 5 weeks shorter than in the primiparous group. We have identified the cause of these changes in monocytes and lymphocytes of the immune system according to the parity of postpartum women. In general, the proportion of memory cells increases in women after pregnancy. A study by Osborne et al. [30], which investigated the relationship between postpartum depression and T cells, confirmed that the T-cell activity increased in the postpartum period of healthy women. Kieffer et al. [31] showed that pregnancy affects central and effector memory T cells in the short- and long-term, and the proportion of CD4+ effector memory cells increases and can persist for more than 1 year after birth. Hanasoge Somasundara et al. [32] also confirmed the increase of NKT-like cells and upregulation of immune signaling molecules in the cell composition of mammary tissue from nulliparous and parous female mice. In that study, the abundance of NKTs in the postpregnancy mammary tissue increased 12-fold, as identified by the markers NK1.1 and CD3. It is known that the presence of CD1d and NKT affects postpregnancy mammary epithelial cells and plays an important role in the inhibition of mammary oncogenesis. It is expected that more interesting results will be obtained if the prevalence of breast cancer is compared with the results of peripheral blood and HBM according to parity. Since immune cells in breast milk are derived from the blood of the lactating mother, this increase in memory cells during the postpartum period is expected to affect the HBM of the multiparous group.
In the DEG results of monocytes, the expression of S100A9 and S100A8 was significantly higher in the primiparous group than in the multiparous group. S100A8/ A9, also known as calprotectin, is mainly derived from immunocytes, such as neutrophils and macrophages, which are useful as markers for various inflammatory reactions in adults [33]. It is known that HBM contains immune components more than other biological fluids, such as cord blood, peripheral blood, and urine, and mature milk contains more than colostrum [34,35]. In infants, HBM plays important roles in shaping the immune system, in the development of the infant intestinal microbiota, and in reducing the sepsis risk [36,37]. With the GSEA results confirming the activation of a key gene associated with the immune system, it can be expected that S100A8/A9 plays a more direct role as an immune source for the immune system stimulation of the infant lactated from the primiparous mother in which there is no experience of pregnancy, and the immune system for the infant has not yet developed. Conversely, in the GSEA result of the multiparous group, it was confirmed that genes related to T cells or immunoglobulins were somewhat activated.
In the DEGs of T cells, various genes were upregulated in the primiparous group, most of which were associated with ion channels or activities. In the multiparous group, the activation of the GNB2L1 gene was the most significant. This gene plays various roles, including cyclin-binding activity, enzyme-binding activity, and protein domain-specific binding activity. Although it does not play a significant role in the immune system, it acts as a key regulator for T-cell homeostasis [38]. The GSEA results also showed an increase in genes related to nucleic acids, which are involved in cellular function and metabolism processes, and play an important role in the growth and development of infants. They exist in higher quantities in HBM than in milk of other species [39].
Micronutrients and macronutrients play various roles in the formation of human immunity. Among them, protein affects NK cell and macrophage activation in innate immunity and plays a role in T/B-cell activation, lymphocyte proliferation, and antibody and cytokine production in adaptive immunity [40]. Carbohydrate regulates immunity to infection and T-cell recognition, while fatty acids affect macrophage metabolism and function, leukocyte migration, dendritic cell infiltration, cell membrane composition, and T/B-cell regulation, as well as provide an energy source for proper immune cell functioning. When we subset and integrated the initial 2 immune clusters, there were 2 PTPRC-negative subclusters, in which the expression for macronutrients was higher than that of the other immune clusters. It is highly likely that contamination occurred in the process of cell separation, but it is also possible that these nutrient-related genes play a role in the expression and function of immune cells. Further scRNA-seq analysis and investigation are needed in more subjects.
There were several limitations to our investigation. The data were divided into 2 groups according to the parity from the open dataset, and the postpartum period was matched, but some unavailable data, such as the BMI of the lactating mother, were not matched. However, in most breastfeeding studies, it is not easy to control all influential factors, such as diet and age. In addition, there was a difference in the number of cells between the 2 groups and the donor, but we identified the representative gene and the ratio according to the group. The limitation of the integrated study can be addressed by further analysis of our HBM samples, and we will confirm the parity-dependent trends identified in this analysis.
In conclusion, our results suggest that gene expression in innate immune cells, such as monocytes and adaptive immune cells, including T cells, might be parity-dependent.
Supplementary material
The supplementary materials 1-9 for this article is available at https://doi.org/10.3345/cep.2024.01585.
cell frequency
total cluster markers
total cluster immune marker dotplot
immune total markers
immune cells frequency
(a) T-cells marker vlnplot, (b) B-cells marker vlnplot, (c) NK cells marker vlnplot, (d) dendritic cells marker vlnplot, (e) monocytes marker, (f) immune PTPRC epi marker vlnplot
annotated UMAP
DEGmonocytes
DEGTcells
macronutrients marker
Notes
Conflicts of interest
The authors declare no potential conflicts of interest.
Funding
This research was supported by the 2023 research grant from the Korean Pediatric Society (Seokcheon research award) and the Chung-Ang University Research Grants in 2024.
Author contribution
Conceptualization: DYY, IK; Data curation: DYY; Formal analysis: HJP, MSS, HSK, SJL; Funding acquisition: DYY; Writing-original draft: DYY; Writing- review & editing: IK