Differential effects of dietary and physical activity interventions on adiposity of children with obesity
Article information

Abstract
Background
Managing obesity in children remains challenging. In addition to body mass index (BMI), incorporating body composition into evaluations of postobesity interventions would help assess changes in adiposity.
Purpose
This study aimed to identify the relationship between dietary intake, physical activity, and changes in BMI z scores and adiposity among children with obesity.
Methods
Children aged 7–15 years with obesity received monthly dietary and physical activity instructions for 6 months. Three-day dietary records and physical activity questionnaires were collected at 0, 3, and 6 months. Body composition was measured using bioelectrical impedance analysis. These relationships were analyzed using uni- and multivariate linear regression analyses.
Results
A total of 155 children with obesity completed the 6-month study. A higher total protein intake per ideal weight for height was significantly correlated with a decrease in BMI z score and trunk fat mass index (trunk fat mass [FM] in kg/height in m2). Mean dietary fiber intake was negatively correlated with BMI z score, FM, FM index (FMI, FM in kg/height in m2), and visceral fat area (VFA) at 6 months. Each 1 g/kg/day increase in protein intake and additional 1 g/day of dietary fiber intake led to a 0.191 kg/m2 (95% confidence interval [CI], -0.309 to -0.072) and 0.028 kg/m2 (-0.05 to -0.005) reduction in BMI z score. Each 1 g/day increase in protein intake led to a reduction of 0.009 kg/m² in trunk FMI (-0.016 to -0.002) and 0.21 cm² in VFA (-0.418 to -0.002). The outcomes observed at 6 months were consistent with the overall 6-month findings, reinforcing the efficacy of the intervention.
Conclusion
Our study showed beneficial effects of high dietary protein and fiber intakes on BMI z scores and adiposity of children with obesity. Fine-tuning dietary interventions that emphasize appropriate protein and fiber intakes may be more practical for managing childhood obesity.
Key message
Question: How do dietary intake and physical activity affect body mass index (BMI) z scores and adiposity among children with obesity?
Finding: Higher dietary protein and fiber intakes were significantly associated with a decrease in BMI z scores and adiposity among children with obesity.
Meaning: Optimizing dietary interventions by focusing on protein and fiber intakes could be an effective strategy for managing childhood obesity.
Introduction
Pediatric obesity stands as the most prevalent nutritional disorder among children and adolescents worldwide [1], affecting 14.4 million individuals and ranking as one of the most common pediatric chronic diseases [2]. Obesity increases the risk of heart diseases in both children and adults, and it predisposes individuals to insulin resistance, type 2 diabetes, hypertension, hyperlipidemia, and depression among youth [1-3]. With an increasing number of children becoming overweight, there is a growing need for health professionals to explore effective methods for prevention and treatment of obesity. The management of childhood obesity involves lifestyle modifications, including changes in dietary habits to limit energy intake from total fats and sugars, and an increase in the consumption of fruits and vegetables. Furthermore, promoting higher levels of physical activity is integral. Some authorities have proposed that physical activity should be increased to a moderate-intensity exercise for 60 minutes, 5 days per week to treat childhood obesity which indeed is difficult to achieve [4]. Moreover, obesity management in children is still a challenge and difficult to identify a better outcome, especially a measurement of adiposity which is an important factor of metabolic derangement in obesity. Since fat mass better predicts cardiometabolic risk, the outcome of pediatric obesity management should be evaluated using body composition in addition to BMI [5-8].
From the study by Durá-Travé et al. [9], examining a prolonged (24 months) combined dietary and physical activity intervention on body composition in adolescents with obesity, there was a significant decrease in BMI and fat mass index (FMI) in both genders. There was also a study assessing the impact of a family-based program focusing on exercise, nutrition, and behavior modification strategies in children and adolescents with overweight and obesity over a 12-month period [10]. The findings revealed a significant reduction in total body fat percentage at 3, 6, and 12 months. There was a longitudinal study that included children with obesity who participated in a combined intervention comprising dietary, behavioral, and physical activity recommendations [11]. The authors demonstrated that FMI significantly decreased, while weight, height z score, and fat-free mass (FFM) did not show significant changes from baseline. However, in the severe obesity group, no significant changes in weight, height z score, body composition, or waist/hip ratio were noted during the intervention period. The study regarding the longitudinal intervention of diet control together with physical activity and improvement of nutritional status in childhood obesity, utilizing both BMI and body composition assessment, remains inconsistency and relatively unexplored in Asia. Such research may yield different outcomes from the Western countries due to ethnic and cultural diversity [12]. Hence, this study aimed to evaluate the relationships of dietary intake and physical activity instruction, as a combined intervention, with body composition in Thai children with obesity.
Methods
This study was a prospective matched cohort study conducted from August 2017 to July 2020 at King Chulalongkorn Memorial Hospital (KCMH), Thailand. The study received approval from the Institutional Review Board (IRB), Faculty of Medicine, Chulalongkorn University (IRB No. 240/60). Prior to study enrollment, all participants and their guardians provided informed consent by signing assents and consent forms, respectively.
1. Subjects and study design
Our study included 165 children aged 7–15 years with a BMI exceeding the median plus 2 standard deviations (SDs) as per the World Health Organization growth reference [13]. The exclusion criteria were reported elsewhere [14]. All groups received consistent guidance on maintaining a diet low in energy (1,000–1,200 kcal/day) and low in fat (25% of total energy from fat). The participants were instructed to engage in non–weight-bearing exercise for 60 minutes per day on at least 4–5 days per week and limit screen time to less than 2 hours per day. Behavioral modification instructions were provided to all participants. Monthly follow-ups were conducted for a period of 6 months. This study was a part of the large randomized controlled trial exploring the effect of inulin supplementation in children with obesity which has been published [14].
2. Dietary and physical activity assessment
A registered dietitian utilized 3-day dietary records to assess dietary intake. Daily calorie consumption, macronutrient distribution percentage, and fiber intake were calculated using the Institute of Nutrition, Mahidol University Calculation-Nutrients database version 3.0 (Institute of Nutrition, Mahidol University, Nakhon Pathom, Thailand) [15]. Physical activity assessment included exercise duration and intensity, which was divided into high, moderate, and low intensities. These allowed for the establishment of correlations between these combined interventions and BMI z score, body composition, and waist circumference.
Data on dietary control and physical activity were collected at month 0, 3, and 6, and analyzed as averages to determine associations and predictions with changes in BMI z score, body composition, and waist circumference over the 6-month period (difference of month 6 minus month 0). Additionally, the accumulative dietary intake and exercise data from month 0, 3, and 6 were examined as averages to identify relationships and predictions of BMI z score, body composition, and waist circumference at month 6.
3. Anthropometry and body composition
Anthropometric measurements, such as weight, height, and waist circumferences, were conducted by trained personnel. Body composition was evaluated using bioelectrical impedance analysis with the InBody 770 (InBody Co., Ltd., Cheonan, Korea). FMI (kg/m2) and FFM index (FFMI, kg/m2) were subsequently calculated similarly to BMI [16].
4. Statistical analysis
Demographic data were summarized using means and SDs. Correlations were evaluated using Spearman's rho correlation, and predictions were explored using univariate and multivariate linear regression. All statistical tests were 2-sided, and a P value <0.05 was considered statistically significant. Analyses were carried out using IBM SPSS Statistics ver. 23.0 (IBM Co., Armonk, NY, USA) and R Program (Free Software Foundation, Inc., Boston, MA, USA).
Results
The study included a total of 165 children with obesity, with 98 being male (59.4%). The baseline demographic data were presented in Table 1. The average BMI z score was 3.22±1.02, and the mean FMI, trunk FMI, FFMI, and visceral fat area (VFA) were 11.75±2.92 kg/m2, 5.65±1.41 kg/m2, 16.13±2.07 kg/m2, and 129.37±40.25 cm2, respectively. Total protein intake per ideal weight for height, total protein intake per day, and dietary fiber intake per day were 1.58±0.65 g/kg/day, 57.43±21.62 g/day, and 3.96±3.04 g/day, respectively. The data indicated elevated levels in BMI, BMI z score, and waist circumference for the corresponding age group. Total protein per ideal weight for height and total protein intake per day approached the upper limit of dietary reference intake (DRI) compared to Thai DRI 2020 [17], while dietary fiber intake was notably low compared to recommendations for children of the same age [18].
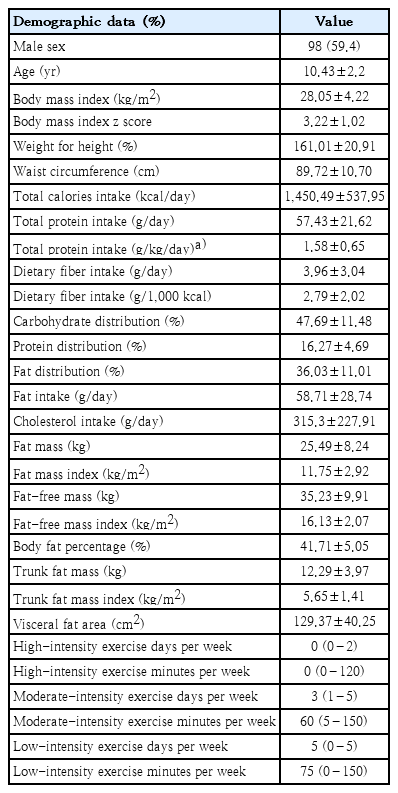
Baseline demographic data of children with obesity (N=165)
The data from 155 children with obesity who completed the study were evaluated for the relationships of dietary intake and physical activity instruction with the changes in BMI z score, body composition, and waist circumference in 6 months. It was observed that total protein intake per ideal weight for height significantly increased from the baseline and showed a negative correlation with BMI z score (r=-0.2, P=0.012) (Fig. 1A) and trunk FMI (r=-0.197, P=0.014) (Fig. 1B). Increasing in total protein intake per day showed a significantly negative correlation with body fat percentage (r=-0.217, P=0.007) (Fig. 1C), FMI (r=-0.221, P=0.006) (Fig. 1D), and VFA (r=-0.272, P=0.001) (Fig. 1E) in 6 months.
Relationships between total protein intake per ideal weight for height and total protein intake and changes in BMI z score and body composition during the 6-month study period: (A) total protein intake per ideal weight for height with BMI z score, (B) total protein intake per ideal weight for height with trunk FMI, (C) total protein intake with body fat percentage, (D) total protein intake with FMI, and (E) total protein intake with VFA. The correlations were evaluated using Spearman rho correlation. BMI, body mass index; FMI, fat mass index; VFA, visceral fat area.
Moreover, dietary fiber intake per day was negatively correlated with the changes of BMI z score (r=-0.259, P=0.001) (Fig. 2A), FM (r=-0.191, P=0.017) (Fig. 2B), FMI (r=-0.175, P=0.029) (Fig. 2C), trunk FM (r=-0.198, P=0.014) (Fig. 2D), trunk FMI (r=-0.194, P=0.016) (Fig. 2E), and VFA (r=-0.183, P=0.03) (Fig. 2F).
Relationships between fiber intake and changes in BMI z score and body composition during the 6-month study period: (A) fiber intake with BMI z score, (B) fiber intake with FM, (C) fiber intake with FMI, (D) fiber intake with trunk FM, (E) fiber intake with trunk FMI, and (F) fiber intake with VFA. The correlations were evaluated using Spearman rho correlation. BMI, body mass index; FM, fat mass; FMI, fat mass index; VFA, visceral fat area.
The relationships of dietary intake and physical activity instruction with BMI z score, body composition, and waist circumference at month 6 revealed that total protein per ideal weight for height was negatively associated with waist circumference (r=-0.344, P<0.001) (Fig. 3A), FM (r=-0.457, P<0.001) (Fig. 3B), trunk FM (r=-0.174, P=0.03) (Fig. 3C), and VFA (r=-0.352, P<0.001) (Fig. 3D). The relationships of dietary fiber with BMI z score, adiposity, and waist circumference at month 6 were not observed.
Relationships between total protein intake per ideal weight for height and waist circumference and body composition at month 6: (A) total protein intake per ideal weight for height with waist circumference, (B) total protein intake per ideal weight for height with FM, (C) total protein intake per ideal weight for height with trunk FMI, and (D) total protein intake per ideal weight for height with VFA. The correlations were evaluated using Spearman rho correlation. BMI, body mass index; FM, fat mass; FMI, fat mass index; VFA, visceral fat area.
A six-month period prediction model is shown in Table 2. Each increment of 1 g/kg/day of the mean total protein intake per ideal weight for height resulted in a decrease of 0.191 kg/m2 in BMI z score (95% confidence interval [CI], -0.309 to -0.072). Additionally, each increment of 1 g/day of protein intake led to a reduction of 0.017 kg/m2 in FMI (95% CI, -0.032 to -0.001), 0.009 kg/m² in trunk FMI (95% CI, -0.016 to -0.002), and 0.21 cm2 in VFA (95% CI, -0.418 to -0.002). For each increment of 1 g/day of dietary fiber intake, there was a decrease of 0.028 kg/m2 in BMI z score (95% CI, -0.05 to -0.005). Regarding physical activity, each additional minute of low-intensity exercise per week was associated with a decrease in waist circumference by 0.008 cm (95% CI, -0.015 to -0.001). Final outcomes at month 6 prediction model are shown in Table 3. Each 1 g/kg/day increment in the average total protein intake per ideal weight for height led to a decrease of 6.67 cm in waist circumference (95% CI, -9.855 to -0.349). Moreover, it resulted in a 3.537 kg reduction in trunk FM (95% CI, -4.76 to -2.314) and a 0.531 kg/m2 reduction in trunk FMI (95% CI, -0.998 to -0.064), and a decrease of 28.792 cm2 in VFA (95% CI, -41.609 to -15.975). Each additional day of moderate-intensity exercise per week resulted in a reduction of 0.903 cm in waist circumference (95% CI, -1.793 to -0.014).
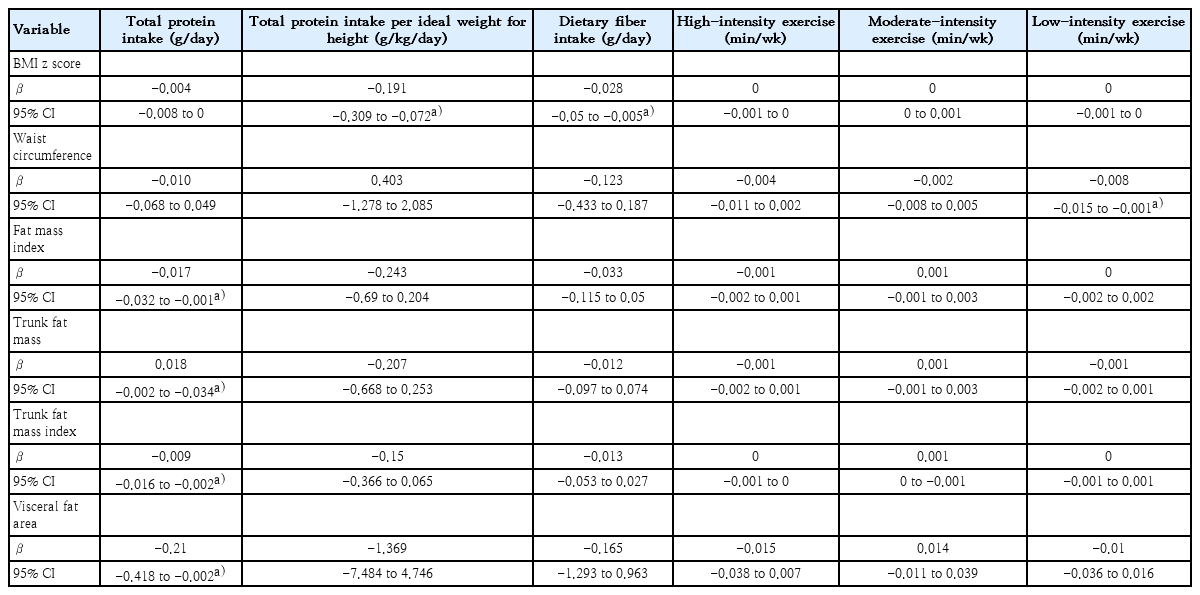
Predictions of dietary intake instructions and physical activity with BMI z score, body composition, and waist circumference in children with obesity over the 6-month study period
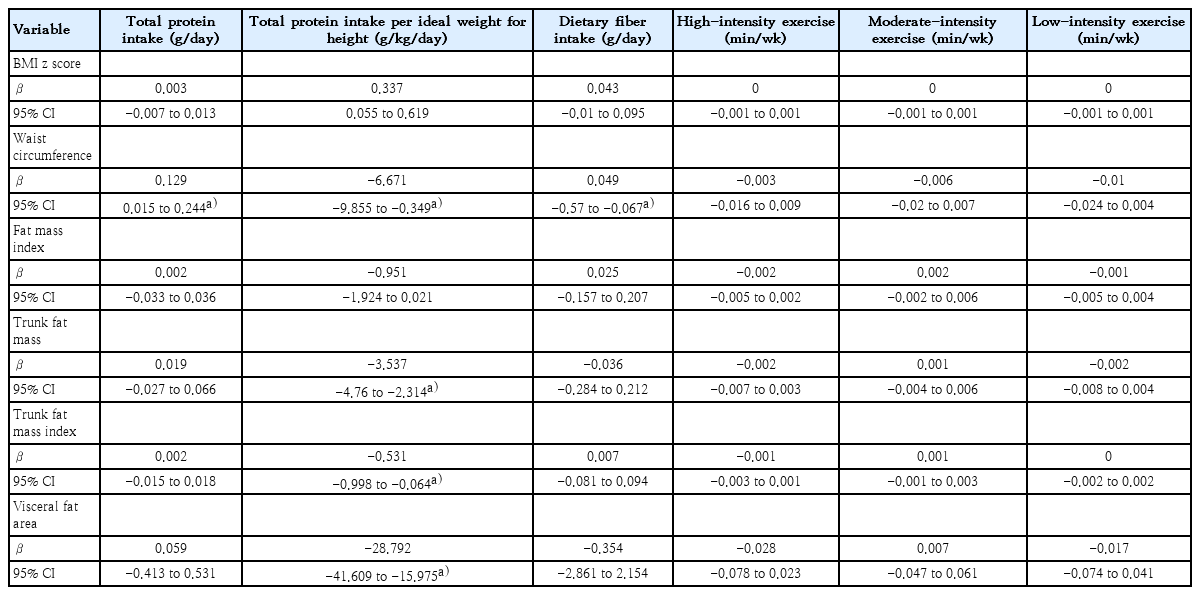
Predictions of dietary intake instruction and physical activity with BMI z score, body composition, and waist circumference among children with obesity at study month 6
In the multivariate linear regression model adjusted for age and sex (data not shown), an increase in dietary fiber intake was still associated with a decreased BMI z score over a six-month period (95% CI, -0.044 to -0.001). Additionally, at month 6 prediction model showed that an increase in total protein intake per ideal weight for height was associated with a decrease in trunk FM (95% CI, -2.647 to -0.006). We further evaluated whether the association between dietary fiber intake and BMI z score over 6 months varied by sex using a likelihood ratio test, which indicated no significant difference. Similarly, no sex differences were found in the association between total protein intake per ideal weight for height and trunk FM. Moreover, we found that the associations between dietary fiber intake and BMI z score as well as between total protein intake per ideal weight for height and trunk FM did not differ by the tanner stage. We then assessed whether tanner stage served as a confounding factor in these associations. For the relationship between dietary fiber intake and BMI z score, tanner stage was indeed a significant confounder, altering the association by approximately 12% and warranting its inclusion in the multivariable model (95% CI, -0.0468 to -0.0038). However, the direction of the association remained consistent. In contrast, for the association between total protein intake per ideal weight for height and trunk FM, tanner stage was not identified as a confounding factor.
Discussion
As far as we know, this is the first longitudinal study to examine the correlations and predictions of combined interventions as dietary intake and physical activity instruction on the changes of BMI z score, body composition, and waist circumference in children with obesity in Asia. Protein intake was negatively correlated with BMI z score, body fat percentage, FMI, trunk FMI, and VFA during the 6-month period of the intervention. Dietary fiber intake was negatively correlated with BMI z score and adiposity over 6 months. Both dietary protein and fiber intake instruction showed significant predictions of the changes in BMI z score and adiposity after the 6-month intervention. Physical activity also significantly predicted the changes in waist circumference. The outcomes observed at month 6 were consistent with the overall 6-month findings, demonstrating the robustness of the results.
Our findings aligned with Durá-Travé et al [9], who followed 196 children with obesity for 24 months. The study reported significant decreases in BMI z score, body fat, and FMI in boys, and similar reductions in BMI z score, waist circumference, body fat, and FMI in the girls after the combined intervention. A multidisciplinary team provided nutrition education and physical activity guidance to participants and families, consistent with our study. Scott and Costello [10] conducted a 12-month study on the Lifestyle Modification Program with 114 children aged 8–17 years with overweight and obesity. Implemented in a hospital setting, participants received supervised behavior adjustments over 5 days, along with dietary and exercise advice. Significant reductions in total body fat percentage were observed at 3, 6, and 9 months, with a median decrease from 37.5% to 30.3% by 12 months (P<0.001). This study, similar in sample size and age group to ours, found associations between the combined intervention and adiposity. However, discrepancies in body fat percentage outcomes may be due to differences in the formats of dietary and exercise advice. Moreover, these 2 studies did not demonstrate the differential effects of different macronutrients intakes on the changes in body composition. Another study on 109 children and adolescents with obesity, aged 9.1–13.9 years, evaluated a 12-month combined dietary, behavioral, and physical activity intervention [11]. The authors reported a significant decrease in FMI in the obesity group with weight z score improvement after the intervention, consistent with our findings. However, no significant changes in height or height z score were observed, likely due to the normal growth pattern for age in this population. Current systematic reviews on combined interventions for adolescents with obesity are limited and vary in methods and outcomes, making definitive conclusions challenging [19-21]. While these studies generally report reductions in BMI and adiposity [19,22-24], and improvement in metabolic parameters [22,25], they did not specifically explore the associations of dietary protein and fiber intake instruction with the changes in BMI z score and body composition as our research meticulously elucidated.
High-protein diets can be used for weight reduction due to protein's appetite-reducing effects, which leads to decreased food consumption and lower energy intake, contributing to weight loss. When consumed in appropriate amounts, protein can help preserve muscle mass which is more metabolically active. In addition, higher protein intake can lead to an increase in energy expenditure because it requires more energy for digestion and metabolism compared to other nutrients [26,27]. However, existing research studies involved adults more than pediatric populations. Thus, our research stands among the first few studies to investigate protein intake and its associations with BMI z scores and body composition in children and adolescents with obesity.
Regarding dietary fiber intake, a 2-year follow-up study involving 7- to 11-year-old Latinas found that increased levels of dietary and soluble fiber correlated with a reduction in visceral body fat [28]. In addition, a study of the CASPIAN-IV cross-sectional nationwide sample of 5,187 individuals aged 6 to 18 years demonstrated that each 1 g/1,000 kcal increase in dietary fiber intake was associated with decreased weight and waist circumference [29]. The findings from both studies were consistent with ours. However, our study revealed additional significant correlations, which were BMI z score, FMI, and trunk FMI. These differences in findings may be attributed to the different intervention approaches.
Fiber intake has been recognized not only for its ability to increase satiety and decrease the absorption of macronutrients but also for its role in altering gut microbiota and promoting the production of short-chain fatty acids (SCFAs) which could improve body composition [14,30,31]. A study on fiber supplementation as inulin demonstrated an increase in muscle biomarkers correlating with gains in FFM in children with obesity. This effect was attributed to Bifidobacterium metabolites produced during inulin digestion, particularly SCFAs, which exhibited anti-inflammatory properties and reduced systemic inflammation, thereby promoting muscle synthesis and potentially substituting body fat [30]. The results reconciled with another study regarding the effect of fiber supplementation on handgrip strength in adults [32]. Additional findings from this study strengthen the relationship between dietary fiber intake and positive changes in body composition. Moreover, studies utilizing National Health and Nutrition Examination Survey data have indicated that consuming whole grains could reduce the risk of overweight and obesity. This effect was attributed to the alteration of gut hormones, specifically peptide YY (PYY) and glucagon-like peptide-1 (GLP-1). These hormones play a crucial role in regulating appetite and satiety. Soluble fiber, when fermented in the digestive system, leads to the production of PYY and GLP-1, contributing to feelings of fullness and satiety, leading to weight loss [31,33,34].
Our study was a large prospective cohort study demonstrating the correlation between dietary intake instruction, particularly focusing on protein and fiber intake, and identification of changes in BMI z score and body composition in children with obesity, while several previous studies did not specify the dietary components. A significant amount of data was collected from multiple time points over the 6-month study period, making the results highly reliable and demonstrating strong associations and predictions regarding the impact of the protein and dietary fiber intake on BMI and body composition. The consistency of the results over the 6-month period and at month 6 also ensures the effectiveness of the intervention. Another strength of the study was its focus as an interventional trial, specifically designed to evaluate the direct effects of combined treatment on obesity. Therefore, this could be applied to the management of childhood obesity in clinical settings. The limitation of the study was the absence of a control group, potentially leading to biased and inconsistent estimates of causal effects in the results. Furthermore, the information regarding exercise duration and intensity was based on interviews, which should be meticulously considered due to potential subjective interpretation.
In conclusion, our study showed beneficial effects of higher dietary protein and fiber intake from the monthly dietary instruction on adiposity in children with obesity. Therefore, fine-tuning dietary intervention emphasizing the instruction of appropriate protein and fiber intake could be more practical comparing to a broad and detailed dietary advice which may be difficult to achieve in real-life situation. Further study on the appropriate amounts of dietary protein and fiber intake as an intervention in childhood obesity, with long-term clinical and metabolic outcomes, is warranted.
Notes
Conflicts of interest
No potential conflict of interest relevant to this article was reported.
Funding
This research was funded by the Ratchadapiseksompotch Funds, Faculty of Medicine, Chulalongkorn University (Grant no. RA60/122) and the Center of Excellence in Pediatric Nutrition, Faculty of Medicine, Chulalongkorn University.
Acknowledgments
The study was conducted by the Center of Excellence in Pediatric Nutrition, Division of Nutrition, Department of Pediatrics, Faculty of Medicine, Chulalongkorn University, Bangkok, Thailand. The authors thank Professor Chitsanu Pancharoen, MD. for supporting us in participant enrollment; Jaraspong Uaariyapanichkul, MD, Puthita Saengpanit, MD, Ekkarit Panichsillaphakit, MD, and Tanisa Kwanbunbumpen MD for assistance with study information; and Chula Clinical Research Center (ChulaCRC), Faculty of Medicine, Chulalongkorn University for research assistant training. The authors appreciate the effort and dedication of all the researchers, data collection team, and all of those involved in this project. Last but not least, the authors sincerely thank all the participants and their parents for their participation in this study.
Author Contribution
Conceptualization: CV, YC, SC; Data curation: AT, CV; Formal analysis: AT, CV; Funding acquisition: CV; Methodology: CV; Project administration: CV; Visualization: AT, CV; Writing-original draft: AT, CV; Writing- review & editing: AT, CV, YC, SC