Nonlinear association between neutrophil-to-lymphocyte ratio and asthma in children and adolescents in the United States: a cross-sectional study
Article information

Abstract
Background
The neutrophil-to-lymphocyte ratio (NLR) is a marker of systemic inflammation associated with various diseases including respiratory conditions. However, the relationship between NLR and asthma in the pediatric population remains underexplored.
Purpose
This study aimed to explore the association between NLR and asthma in children and adolescents and assess its potential role as a predictive biomarker for pediatric asthma.
Methods
We retrospectively analyzed the medical records of 12,974 children and adolescents from the National Health and Nutrition Examination Survey in 2011–2020. NLR was defined as the ratio of NLR counts. Asthma was diagnosed using a structured questionnaire. Multivariate logistic regression models were used to evaluate the association between NLR and asthma. A restricted cubic spline was used to explore nonlinear relationships, and a threshold analysis was conducted to identify potential cutoff values for the NLR.
Results
A total of 12,974 children and adolescents were included (male: 6,686 [51.5%]; mean [interquartile range] age, 10 [5.0–14.0 years]). After the adjustment for confounders, participants with the highest versus lowest NLR exhibited a significantly elevated risk of asthma (odds ratio [OR], 1.39; 95% confidence interval [CI], 1.13–1.71). Additionally, a multivariate restricted cubic spline analysis revealed a nonlinear relationship between NLR and asthma (P=0.023). A threshold analysis revealed that an NLR<2.23 was significantly associated with an increased risk of asthma (OR, 1.23; 95% CI, 1.05–1.45), while an NLR≥2.23 showed no significant association. A subgroup analysis revealed no interactive role of NLR and asthma.
Conclusion
Our findings indicate a nonlinear saturation-effect relationship between NLR and asthma in children and adolescents.
Key message
Question: Is there a nonlinear relationship between neutrophil-to-lymphocyte ratio (NLR) and asthma in children and adolescents?
Finding: NLR showed a nonlinear association with asthma, with an NLR threshold of 2.23 identifying individuals at higher risk.
Meaning: An NLR<2.23 may serve as a potential biomarker for asthma risk assessment and management in pediatric populations, thereby offering a simple tool for the early identification of at-risk individuals.
Graphical abstract. NHANES, National Health and Nutrition Examination Survey.
Introduction
Asthma is one of the most prevalent chronic respiratory conditions affecting children and adolescents worldwide, with significant morbidity and healthcare burden. In the United States alone, millions of children and adolescents suffer from asthma [1], which not only impairs their quality of life but also leads to frequent hospital visits and healthcare costs. Understanding the underlying mechanisms and identifying reliable biomarkers for asthma is critical to improving its diagnosis and management in young populations.
The neutrophil-to-lymphocyte ratio (NLR) has recently gained attention as a readily available, cost-effective marker of systemic inflammation [2]. Numerous studies have suggested that NLR is associated with various inflammatory and chronic diseases, including cardiovascular condition [3-5], cancer [6], and autoimmune disorders [7]. In respiratory diseases, elevated NLR has been linked to poorer outcomes, increased disease severity, and exacerbations in conditions like chronic obstructive pulmonary disease [8]. However, the role of NLR in pediatric asthma remains underexplored, and its clinical significance in this context has yet to be fully established.
Given the inflammatory nature of asthma and the potential of NLR as a marker of immune dysregulation, it is essential to investigate the association between NLR and asthma in children and adolescents. Moreover, the relationship between inflammation markers and asthma may not be linear, suggesting the need for more nuanced analyses. This study aims to investigate the potential nonlinear association between NLR and asthma using data from the National Health and Nutrition Examination Survey (NHANES), providing valuable insights into how NLR could function as a biomarker for assessing asthma risk in the pediatric population.
Methods
1. Data source and study population
This cross-sectional study utilized data from the 2011–2020 NHANES, a national survey administered by the National Center for Health Statistics (NCHS) [9]. Details about the database were described elsewhere [10]. The NHANES study protocol received approval from the research ethics review board at the NCHS, and all participants provided written informed consent at the time of enrollment [11]. The NCHS IRB/ERB protocol numbers of 2011–2020 National Health and Nutrition Survey are ‘#2011-17’ and ‘#2018-01.’ No further institutional review board approval was necessary for secondary analysis. This study followed the STROBE (Strengthening the Reporting of Observational Studies in Epidemiology) reporting guideline. Deidentified data for participants aged less than 20 years were extracted. Individuals who lacked information about asthma and complete blood count (CBC) were eliminated.
2. Assessment of asthma
Participants with asthma were identified based on their responses to 2 questions in the Medical Condition Questionnaire: “Has a doctor or other health professional ever told you that you have asthma?” and “Do you still have asthma?” The subjects were classified as having asthma if they answered "yes" to both questions and as nonasthmatic if they responded "no" to either question.
Assessment of asthma exacerbation was operationalized through the evaluation of participant responses to 2 standardized survey items: "During the past 12 months, have you had an episode of asthma or an asthma attack?" and "During the past 12 months, have you had to visit an emergency room or urgent care center because of asthma?". Those who answered “yes” to either question were classified as having experienced asthma exacerbation within the preceding 12-month interval.
3. Assessment of NLR
CBC and blood cell distribution were assessed for all participants using the Beckman Coulter MAXM during the 2011–2012 cycle and the Beckman Coulter DxH 800 instrument in the 2013–2020 cycle. NLR was calculated as follows: NLR=neutrophil counts/lymphocyte counts. Participants were then stratified into quartiles (Q1–Q4) according to their NLR levels for analysis.
4. Covariates
Baseline data for participants were gathered using questionnaires and laboratory assessments, covering variables such as sex, age, race/ethnicity, body mass index (BMI) category, family income, exposure to secondhand smoke, family history of asthma, asthma onset age, as well as white blood cell (WBC) count, eosinophil percentage (EOPC), monocyte, neutrophil, lymphocyte counts, and hemoglobin (HGB) levels. Race/ethnicity was classified into 5 categories: Mexican American, other Hispanic, non- Hispanic White, non-Hispanic Black, and individuals of other races. The BMI category was executed in accordance with the standardized age- and sex-specific percentile growth charts established by the US Centers for Disease Control and Prevention [12], which were defined as follows: underweight (BMI < 5th percentile), normal weight (BMI, 5th–85th percentile), overweight (BMI, 85th–95th percentile), and obese (BMI ≥95th percentile). As per a report from the United States government [13], the poverty-to-income ratio (PIR) was employed to categorize family income. This ratio facilitated the categorization of family incomes into 3 distinct levels: low (PIR ≤ 1.3), medium (PIR 1.3–3.5), and high (PIR > 3.5).
A multivariate single imputation approach was employed to address missing data, utilizing an iterative imputer. A Bayesian Ridge model served as the estimator during each step of the round-robin imputation process [14].
5. Statistical analysis
Continuous variables are expressed as the mean (standard deviation) or median (interquartile range), whereas categorical variables are presented as percentages. To evaluate statistical differences in baseline characteristics across varying NLR groups, t tests or one-way analysis of variance were used for continuous variables, while chi-square or Fisher exact test were employed for categorical variables.
We utilized both univariate and multivariate binary logistic regression models to examine the relationship between NLR and asthma. NLR was categorized into 4 quantiles and treated as a categorical variable for analysis. Covariates with a 2-sided P value < 0.05 in the univariate logistic regression were considered statistically significant and included in the multivariable model to adjust for potential confounding effects. We developed 3 models for analysis. Model 1 was adjusted for age, sex, race/ethnicity, BMI category, and PIR. Model 2 included additional adjustments for family history of asthma and exposure to secondhand smoking. Model 3 was further adjusted for WBC and EOPC.
We employed a restricted cubic spline (RCS) model with 4 knots at the 5th, 35th, 65th, and 95th percentiles to create smooth curves for examining potential nonlinear dose-response relationships between NLR and asthma. The placement of these knots followed established statistical practices, ensuring adequate flexibility to capture nonlinear patterns while avoiding overfitting. In cases where a nonlinear correlation was identified, a 2-piecewise regression model was applied to assess the threshold effect of NLR on asthma as illustrated in the smoothing plot. The threshold point, corresponding to the inflection in the smoothing plot, was determined objectively based on model fit and likelihood ratio tests.
Additionally, to evaluate the robustness of the association between NLR and asthma across different subgroups, interaction and subgroup analyses were performed stratified by age, sex, BMI category, family history of asthma, and exposure to secondhand smoke.
Subsequently, we performed multiple sensitivity analyses to validate our findings. First, we excluded subjects with missing covariate data, employing both multivariable logistic regression and RCS modeling to verify the reproducibility of trends observed in the primary single imputation analysis. Second, asthma treatment was incorporated as an additional covariate in the multivariate regression model during the 2011–2012 surveillance cycle to assess the stability of the NLR-asthma association. Third, to further examine the association between NLR and asthma, we investigated the relationship between NLR and asthma exacerbation. Finally, we explored the potential for unmeasured confounding between NLR and asthma by calculating E values.
Statistical analyses were conducted using R software (ver. 4.2.1; R Foundation for Statistical Computing) and Free Statistics software (ver. 2.0; Beijing FreeClinical Medical Technology Co., Ltd.). A 2-sided P value of <0.05 was considered to indicate statistical significance.
Results
1. Study population
The present study draws upon data from the NHANES for the period spanning 2011 to 2020. Of the 45,462 participants who completed the interview, 26,280 were aged 20 years or older. The remaining 19,182 pediatric participants were further filtered, resulting in the exclusion of those with incomplete asthma questionnaire responses (n=1,830) and those with missing CBC data (n=6,208). Ultimately, a total of 12,974 individuals were included in the present study, comprising 1,379 individuals with asthma and 11,595 individuals without asthma (Fig. 1).
Study flowchart.
2. Baseline characteristics
The baseline characteristics of the study population are presented in Table 1, classified according to quartiles of NLR. No significant differences were observed between the 4 survey cycles with regard to NLR. The median age of the included participants was 10 years, with 51.5% of this group identified as male and 26.9% as Non-Hispanic White. The overall prevalence of asthma was 10.6%, with a median age of onset of 3 years. Significant differences were observed in age, sex, race/ethnicity, BMI category, household income, WBC, EOPC, monocyte, and HGB between different NLR levels (all P<0.05).
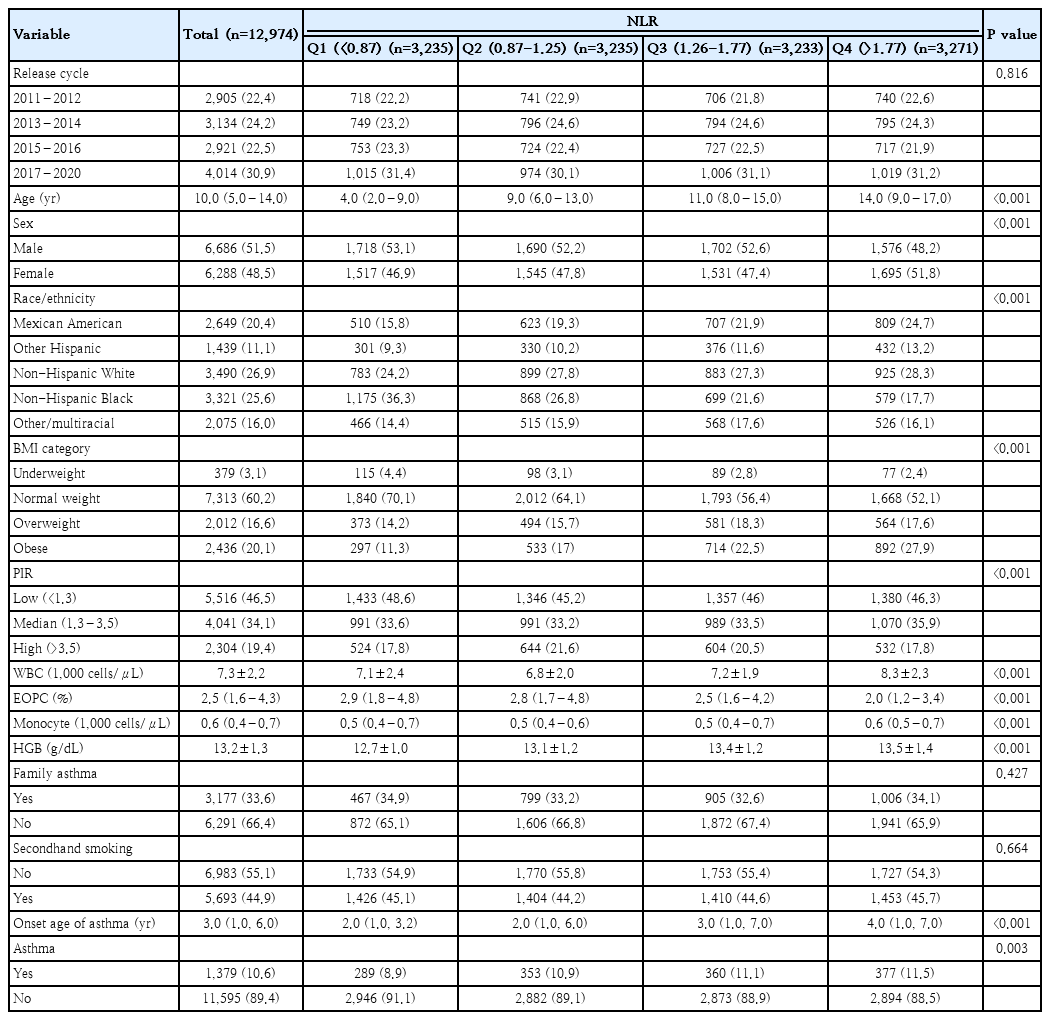
Patients’ baseline characteristics categorized by NLR
3. Association between NLR and asthma
The univariate logistic regression analysis revealed that the following variables were significantly associated with the presence of asthma: sex, age, race/ethnicity, PIR, BMI category, eosinophil count, family history of asthma, and secondhand smoking (Supplementary Table 1).
In the multivariate logistic regression analysis, with adjustment for all potential confounders, compared with the lowest NLR group Q1 (<0.87), the adjusted OR values for NLR and asthma in Q2 (0.87–1.25), Q3 (1.26–1.77), and Q4 (>1.77) were 1.27(95% CI, 1.06–1.52; P=0.009), 1.34 (95% CI, 1.11–1.62; P=0.002), and 1.39 (95% CI, 1.13–1.71; P=0.002), respectively (Table 2).
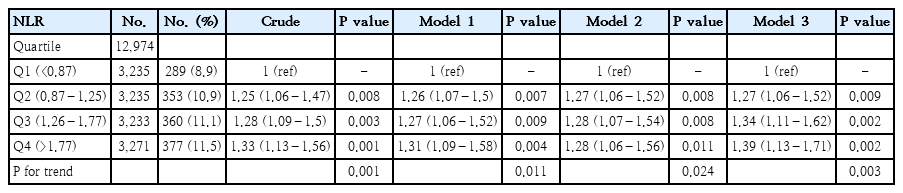
Association between NLR and asthma
Furthermore, an RCS analysis was performed to evaluate the dose-response relationship between NLR and asthma. After controlling for all covariates, a nonlinear relationship between NLR and asthma was observed (P=0.023) (Fig. 2). Specifically, in the threshold analysis, the OR between NLR and asthma was 1.23 (95 % CI, 1.05–1.45; P=0.010) in individuals with NLR<2.23. This indicates that for every 1 unit increase in NLR, the risk of asthma rose by 23%. In contrast, the OR was 0.82 (95 % CI, 0.63–1.06; P=0.123) in individuals with NLR≥2.23 (Table 3), which means that the risk of asthma no longer increases with increasing NLR level.
Association between NLR and asthma odds ratio. Solid and dashed lines represent the predicted value and 95% confidence intervals. They were adjusted for age, sex, race/ethnicity, BMI category, PIR, family asthma, secondhand smoking, WBC, EOPC. Only 99% of data are shown. NLR, neutrophil-to-lymphocyte ratio; BMI, body mass index; PIR, poverty-to-income ratio; WBC, white blood cell count; EOPC, eosinophil percentage.
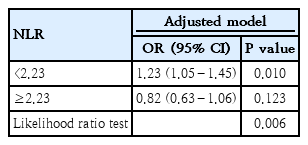
Threshold effect analysis of relationship between NLR and asthma.
4. Stratified analysis and sensitivity analysis
Stratified analysis showed no significant interactions between different subgroups when stratified by sex, age, BMI category, family history of asthma, and secondhand smoking (Supplementary Fig. 1). Subsequently, after removal of participants with missing values, sensitivity analysis showed that the association between NLR and asthma remained significant (Supplementary Tables 2 and 3).
Additionally, we executed an extended analytical approach utilizing the 2011–2012 surveillance cycle data, wherein asthma treatment was incorporated as an additional covariate in the multivariable logistic regression model. Compared with the lowest NLR group Q1 (<0.87), the adjusted OR values for the association between NLR and asthma in Q4 (>1.78) was 2.93 (95% CI, 1.13–7.65; P=0.028), which demonstrates that even when accounting for treatment effects, NLR remains significantly associated with asthma (Supplementary Table 4).
Furthermore, in order to examine the role of NLR in asthma severity, we investigated the association between NLR and asthma exacerbation in the past year. After adjusting for all covariates, a positive correlation was observed (OR, 1.09; 95% CI, 0.77–1.54; P=0.616). However, this association was not statistically significant (Supplementary Table 5).
To enhance the reliability of our primary findings, we computed E values to evaluate the potential impact of unmeasured confounding variables. The association between NLR and asthma remained strong unless the OR for the risk of asthma due to an unmeasured confounder was 2.13.
Discussion
The primary finding of this cross-sectional study is the identification of a nonlinear association between NLR and asthma in children and adolescents, with a turning point of 2.23. These result highlights the complexity of the inflammatory processes underlying asthma in pediatric populations and suggest that NLR may be a useful biomarker for asthma risk stratification. Furthermore, the subgroup analysis showed no significant interactions across the various subgroups. Additionally, the sensitivity analysis confirmed that the association remained consistent and robust throughout.
Our study is one of the few to demonstrate that the relationship between NLR and asthma may not be linear, particularly in pediatric populations. This distinction could be important for identifying optimal NLR ranges that minimize asthma risk and for understanding the complex immune responses involved in asthma development. Clinically, NLR may serve as a supplementary marker for asthma risk assessment, particularly in individuals with lower values. For individuals with NLR≥2.23, elevated levels may reflect systemic inflammation linked to severe asthma or comorbid conditions, underscoring the need for comprehensive clinical evaluation.
Our results are in line with several prior studies that have linked NLR to various inflammatory diseases, including asthma. Ke et al. [15] found that an elevated NLR level was linked to an increased risk of both all-cause mortality and respiratory disease-related mortality among adults with asthma. An independent risk of a severe exacerbation within the following year was shown to be correlated with an NLR level, according to a research by Mochimaru et al. [16] on adults. A Polish cross-sectional study revealed that NLR levels were significantly elevated in children with asthma, and an NLR threshold of 0.53 could reliably distinguish asthmatic children from their non-asthmatic counterparts [17]. However, most of the existing literature has focused on linear associations, without exploring the possibility of nonlinearity. Our study is one of the few to demonstrate that the relationship between NLR and asthma may not be linear, particularly in pediatric populations. This distinction could be important for identifying optimal NLR ranges that minimize asthma risk and for understanding the complex immune responses involved in asthma development.
The mechanism underlying the observed nonlinear association between NLR and asthma may be multifaceted. Asthma is primarily characterized by chronic inflammation in the respiratory tract and fluctuating airflow obstruction. Neutrophils can negatively impact the airways by contributing to airway narrowing through remodeling, promoting mucus hypersecretion via neutrophil elastase [18], enhancing airway smooth muscle responsiveness [19], and accelerating the decline in lung function [20]. Neutrophils also serve as a primary source of the cytokine Oncostatin M, which has been shown to impair epithelial barrier function in the airways of individuals with asthma [21]. Additionally, lymphocytes play a key role in maintaining and restoring tissue homeostasis after exposure to cytokines derived from the epithelium [22]. This may explain the dose-response relationship between NLR and asthma.
Since NLR can be readily derived from standard blood tests, it serves as a cost-effective and non-invasive marker of systemic inflammation. This is of particular value for the pathological classification of asthma and for early risk stratification. Arwas et al. [23] demonstrated that elevated NLR is strongly associated with severe asthma exacerbations, allowing clinicians to identify high-risk patients promptly. Similarly, Wawryk-Gawda et al. [17] reported significantly higher NLR levels in children with allergic asthma, suggesting that NLR monitoring could help distinguish between asthma phenotypes and guide tailored treatment strategies. Moreover, Xu et al. [24] found that a high NLR not only aids in diagnosing coexisting conditions such as community-acquired pneumonia but also predicts poorer outcomes, underscoring its prognostic value. These findings indicate that incorporating NLR assessment into routine clinical practice may facilitate earlier intervention and improved management of pediatric asthma, thereby potentially enhancing overall clinical outcomes.
Our study has several strengths. First, it utilizes a large, nationally representative dataset from NHANES, enhancing the findings' generalizability. Second, the study mainly focuses on exploring the nonlinear association between NLR and asthma in children and adolescents, providing new insights into the role of inflammation in pediatric asthma. Third, the robust statistical modeling and sensitivity analyses performed ensure the reliability of the results. However, several limitations should be acknowledged. Firstly, the study's cross-sectional design restricts our ability to draw causal inferences. While we identified an association between NLR and asthma, we cannot determine whether elevated NLR directly contributes to asthma development or is a consequence of the disease. Longitudinal studies are essential to establish the temporal relationship between these variables. Additionally, due to data constraints, we could not account for several significant factors, including allergen exposure and detailed assessments of asthma severity. This may have introduced residual confounding into the analysis. Nevertheless, the sensitivity analysis using the E-value method produced E values greater than the observed association strength between allergens and asthma [25,26], suggesting that allergens are unlikely to significantly attenuate the relationship identified in our study. Finally, the NLR may fluctuate based on various physiological and environmental factors, so a single measurement may not fully capture the inflammatory state over time.
In conclusion, this study demonstrated a nonlinear association between NLR and asthma among United States children and adolescents, identifying a threshold of 2.23. Our results indicate that NLR could serve as a valuable biomarker for detecting individuals with an elevated risk of asthma. While NLR alone cannot directly modify asthma risk factors, its value lies in its ability to reflect underlying systemic inflammation, which is central to asthma pathogenesis. NLR may complement existing diagnostic and monitoring strategies, particularly in resource-constrained settings where advanced diagnostic tools are unavailable. Further investigations are required to elucidate the mechanisms behind this relationship and to validate these findings in future longitudinal studies.
Supplementary material
Supplementary Tables 1-5 and supplementary Fig. 1 are available at https://doi.org/10.3345/cep.2024.01844.
Association of covariates and asthma risk
Association between NLR and asthma after deletion of missing covariates
Threshold effect analysis of the relationship between NLR and asthma after deletion of missing covariates
Association between NLR and asthma (2011–2012)
Association between NLR and asthma exacerbation
FForoestr pelots oft m upltivlaoriatb leo logfi stmics aunallytsiisv baetwreiean NtLeR alnod agsthimsat. ics analysis of NLR and asthma. Except for the stratification component itself, each factor was adjusted for age, sex, race/ethnicity, BMI category, PIR, family asthma, secondhand smoking, WBC, and EOPC. BMI, body mass index; EOPC, eosinophil percentage; NLR, neutrophil-to-lymphocyte ratio; PIR, poverty-to-income ratio; WBC, white blood cell count.
Notes
Conflicts of interest
No potential conflict of interest relevant to this article was reported.
Funding
This research was sponsored by key Chlinical Specialty Discipline Construction Program of Fuzhou, Fujian, P.R.C (Grant number [201912007]).
Acknowledgments
We would like to express our sincere gratitude to the participants and staff of the NHANES for their valuable contributions to the data collection and management.
Author Contribution
Conception and design: CC, LZ; Data curation: CC; Data analysis and interpretation: CC; Writing - Original Draft: CC; Writing - Review & Editing: CC, LZ