Assessment of natural killer cell subpopulations in pediatric patients with transfusion-dependent β-thalassemia major
Article information

Abstract
Background
Iron overload is a hallmark complication in patients with transfusion-dependent β-thalassemia major, primarily resulting from ineffective erythropoiesis, repeated blood transfusions, and increased gastrointestinal iron absorption. This iron accumulation, reflected in elevated serum ferritin levels, has been implicated in immune dysregulation. Natural killer (NK) cells are a pivotal component of the innate immune system, known for their cytotoxic activity and cytokine secretion, particularly interferon-gamma (IFN-γ). Disruption in NK cell subsets may compromise immune surveillance and defense against infections in these patients.
Purpose
To evaluate the distribution and function of NK cell subpopulations in pediatric patients with transfusion-dependent β-thalassemia major and explore their association with iron overload and immune dysfunction.
Methods
Seventy-eight children were enrolled and divided into 2 groups: 43 pediatric patients with transfusion-dependent β-thalassemia major and 35 apparently healthy controls. NK cells and their subsets (CD56bright, CD56dim, CD56neg) were quantified using multicolor flow cytometry. Serum IFN-γ levels were measured to assess NK cell cytokine activity. Ferritin levels were used as a marker of iron overload.
Results
Patients showed a significant reduction in CD56bright and CD56dim NK cells compared to controls (P<0.001), indicating impaired NK-mediated immunity. Conversely, the CD56neg subset, associated with dysfunctional or altered NK cell phenotypes, was significantly elevated in patients (P<0.002). A strong negative correlation was observed between serum ferritin levels and CD56dim NK cells (P=0.003), suggesting that iron overload suppresses cytotoxic NK activity. Moreover, IFN-γ levels inversely correlated with CD56bright (P<0.001) and CD56dim (P=0.019) cells, but positively correlated with CD56neg cells, implicating this altered subset as a potential compensatory source of cytokine production.
Conclusion
Hyperferritinemia in pediatric β-thalassemia major is linked to a dysregulated NK cell profile, marked by suppression of functional CD56bright and CD56dim subsets and expansion of the atypical CD56neg subset. These alterations may compromise innate immunity and contribute to increased infection risk. Our findings highlight the immunomodulatory impact of iron overload and underscore the clinical importance of monitoring NK cell dynamics in thalassemia management.
Key message
Question: How does iron overload affect immunity in pediatric patients with transfusion-dependent β-thalassemia major?
Finding: Iron overload in these patients is associated with disrupted natural killer (NK) cell subpopulations, reflecting impaired innate immunity.
Meaning: This highlights the need to monitor immune profile alongside iron status during thalassemia management.
Introduction
In β-thalassemia major (βTM), mutations in the β-globin gene of hemoglobin result in the absence or reduced production of the β-globin chain in erythrocytes [1]. This leads to ineffective erythropoiesis, causing iron overload due to the need for frequent blood transfusions and excessive iron absorption from the gastrointestinal tract [2,3].
Patients with transfusion-dependent thalassemia Necessitate lifelong monitoring of iron overload. Serum ferritin measurement is the standard clinical and hematological test used to assess iron levels in these patients. A ferritin target of 1,000 μg/L is generally recommended as a standard practice for managing iron overload in transfusion-dependent thalassemia [4,5].
Advancements in the management of thalassemia, particularly through blood transfusions and iron chelation therapy, have significantly improved both the quality of life and life expectancy of transfusion-dependent thalassemic patients. However, these treatments also contribute to complications such as hemosiderosis and immunological changes, which increase susceptibility to infections [6]. Multiple factors such as iron overload, chelation therapy, and repeated exposure to alloantigens through transfusions collectively contribute to the observed immunological alterations [7].
Blood transfusions induce immunomodulatory effects, known as transfusion-related immunomodulation (TRIM), which include both immunosuppressive and proinflammatory responses. While the exact mechanisms of TRIM are not fully understood, the buildup of immunomodulatory factors in stored blood commonly known as the "storage lesion" is believed to contribute to this phenomenon [8].
Natural killer (NK) cells are essential components of the innate immune system, accounting for approximately 10%–20% of the lymphocyte population in normal peripheral blood [9]. They are primarily recognized for their ability to lyse tumor cells without prior activation. In addition to their cytotoxic functions, NK cells produce cytokines such as interferon (IFN)-γ and granulocyte-macrophage colony-stimulating factor [10], playing a crucial role in defending against a range of viral, bacterial, and parasitic infections. Furthermore, NK cells contribute to adaptive immunity through interactions with dendritic cells (DCs), modulating their activity either positively or negatively, which influences the broader immune response [11].
NK cells are identified by the presence of CD56 and the absence of T-cell receptor and CD3. They are further divided into subsets based on the expression of CD56 and the presence of CD16. CD56bright NK cells express high levels of CD56 and low levels of CD16, while CD56dim NK cells exhibit lower levels of CD56 and higher levels of CD16. These subsets perform distinct functions within immune responses, contributing to specialized roles in immune defense [12].
Iron overload in βTM may impact the function and population of NK cells, potentially altering the immune response over time. Therefore, we aimed to examine the characterization of NK cell subsets in pediatric patients with βTM and iron overload, and explore the correlation between NK cell subsets and hyperferritinemia.
Methods
Our study was a case-control study conducted on 78 children, divided into a patient group and a control group. The patient group consisted of 43 transfusion-dependent children with βTM, recruited from the Hematology and Oncology Unit of the Pediatric Department at Menoufia University Hospitals, Egypt. The control group comprised 35 apparently healthy children, matched in age and sex with the patient group. This study was carried out at the Clinical Pathology Department of Menoufia University Hospitals, Egypt, extended from January 2024 to January 2025, following approval from the Ethical Committee of Menoufia University Hospitals (IRP number: 10/2023 CPATH 17). Written consent was obtained from the parents or legal guardians of each child participating in the study.
1. Inclusion criteria
Our study included pediatric patients diagnosed with βTM who had a history of receiving more than 10 units of packed red blood cells (RBCs) and/or a serum ferritin level exceeding 1,000 μg/L.
2. Exclusion criteria
Patients with underlying Patients with concurrent infections (based on history, clinical examination) or other hereditary hemoglobinopathies were excluded to avoid confounding factors affecting immune parameters.
3. Clinical course and timing of blood collection
To minimize variability due to clinical status, blood samples were collected at steady-state conditions, defined as absence of fever, infection, or acute complications for at least 2 weeks prior to sampling. None of the patients were acutely ill or undergoing transfusion at the time of sample collection. Blood was collected just before their scheduled transfusion, to reflect their baseline immune profile without acute transfusion effects.
4. Diagnostic and laboratory workup
The diagnosis of βTM was confirmed by clinical records, abdominal ultrasound, complete blood count (CBC), peripheral blood film, hemoglobin electrophoresis, and family studies. Clinical follow-up data were used to assess iron chelation, transfusion frequency, splenectomy history, and history of recurrent infections.
Six milliliters of peripheral venous blood were collected from each child participating in the study. Three milliliters were drawn into a plain tube for measuring serum levels of urea, creatinine, alanine aminotransferase (ALT), and aspartate aminotransferase (AST) using the AU680 auto analyzer (Beckman Coulter, USA); ferritin using the Architect i1000SR immunoassay analyzer (Abbott Diagnostics, USA); C-reactive protein (CRP) by turbidimetry; and IFN-γ levels using an ELISA kit (SUNREDBIOTECH, China).The remaining 3 mL were collected in K2EDTAcontaining tubes for CBC analysis using the Sysmex XN-1000 hematology auto analyzer (Sysmex Corp., Japan) and flow cytometric analysis of NK cells and their subsets using multicolor flow cytometry (CytoFLEX flow cytometer - Beckman Coulter).
5. Flow cytometric analysis
1) Principles
The Stain-Lyse-Wash method13) was used to detect membrane antigens characterizing NK cells through flow cytometry. This was achieved using a combination of fluorochrome-conjugated monoclonal antibodies (McAbs), including CD3 allophycocyanin, CD56 phycoerythrin, and CD16 fluorescein isothiocyanate. The monoclonal antibodies were supplied by Beckman Coulter. The EDTA blood sample was processed within one hour. Tubes were labeled with the patient’s name, laboratory number, and the combination of McAbs to be used, including isotypic controls. Isotypic controls consisted of mouse immunoglobulin (Ig) of the same isotype as the McAbs but without antigen specificity. Each sample was adjusted to a lymphocyte count of 5–10×10³/μL by using phosphate buffered saline (PBS). A 100-μL aliquot of either the original or adjusted specimen was transferred into a tube, followed by the addition of 30 μL of the McAbs combination (10 for each McAb). The tube was then incubated in the dark at room temperature for 15 minutes. After incubation, 3 mL of lysing solution was added and left for 10 minutes in the dark at room temperature. The tube was then centrifuged at 2,000 rpm for 5 minutes, and the supernatant was discarded. The remaining pellet was washed 3 times with 2 mL of PBS, with centrifugation at 2,000 rpm for 5 minutes after each wash, followed by supernatant removal. Finally, the pellet was resuspended in 200 μL of PBS for further analysis.
2) Gating strategy
The CytoFLEX flow cytometer was used to measure NK cells and their subsets. The negative gating strategy was employed for NK cell selection, followed by their classification into subpopulations. The selection process began with gating the lymphocyte population based on forward and side scatter characteristics. NK cells were then identified by gating on the CD3-negative population. Subsequently, the selected NK cells were classified into 3 distinct subsets based on CD56 and CD16 surface expression: CD56bright (CD56++CD16+/−), CD56dim (CD56+CD16+), and CD56neg (CD56−CD16+) (Fig. 1A-C).
Gating strategy for evaluation of natural killer cells subpopulations. (A) Gate P1 represents the total lymphocyte population identified based on forward and side scatter characteristics. (B) Gate P2 represents the CD3-negative cell population. (C) Gate P10 represents the CD56bright (CD56++CD16+/−) population, characterized by high expression of CD56 with variable or absent CD16 expression. Within gate P11, along with the red rectangle, the upper right quadrant (Q1-UR) identifies the CD56dim (CD56+CD16+). The lower right quadrant (Q1-LR) corresponds to the CD56neg (CD56−CD16+). FCS-A, forward scatter-area; SSC-A, side scatter-area; APC-A, allophycocyanin-area; PE-A, phycoerythrin-area; FITC-A, fluorescein isothiocyanate-area.
6. Statistical analysis
The results were tabulated and statistically analyzed using IBM SPSS Statistics ver. 20.0 (IBM Co., USA). Qualitative data were presented as numbers and percentages. The Shapiro-Wilk test was used to assess the normality of data distribution. Quantitative data were described using the range (minimum and maximum), mean, standard deviation, median, and interquartile range. For group comparisons, the chi-square test and Fisher exact test were used for categorical variables. When quantitative variables were normally distributed, the Student t test was applied to compare 2 groups. If the data were not normally distributed, the Mann-Whitney test was used instead. Statistical significance was determined at a 5% level, with a P value <0.05 considered statistically significant and a P value <0.001 considered highly significant.
Results
Our case-control study was conducted on 43 transfusion- dependent βTM pediatric patients (25 males and 18 females) mean age 10.26±4.39 years, and 35 apparently healthy children (21 males and 14 females) mean age 8.61±5.25 years as the control group. There was no statistically significant difference between the patient and control groups regarding age and sex. Some clinical characteristics of the included patients were demonstrated (Table 1).
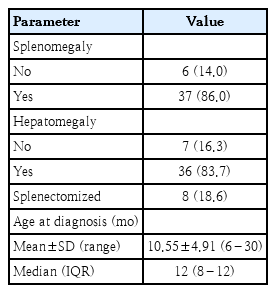
Distribution of the studied cases based on different clinical parameters in patients (n=43)
As part of the clinical evaluation, a detailed history of past infections was also documented. Recurrent infections (defined as 3 or more episodes per year) were reported in approximately 36% of thalassemic patients. The most common types included respiratory tract infections (65.1%), gastrointestinal infections (32.6%), urinary tract infections (23.3%), and skin or soft tissue infections (16.3%).
Ferritin levels were compared across various clinical subgroups of thalassemic patients. Patients with a history of splenectomy exhibited a higher mean ferritin level (2,374 .00±1,513.51 μg/L) compared to those without splenectomy (1,725.00±1,015.28 μg/L); however, this difference was not statistically significant (P=0.293). Similarly, patients with splenomegaly had elevated ferritin levels (1,980.00±1,418.07 μg/L) relative to those without splenomegaly (1,425.00±826.03 μg/L), though this difference also did not reach statistical significance (P=0.213). When analyzing ferritin in relation to transfusion frequency, patients transfused every 15 days showed the highest mean ferritin levels (2,019.70±1,588.51 μg/L), followed by those transfused every 20 days (1,599.20±1,186.41 μg/L), and every 30 days (1,594.30±1,467.36 μg/L). The Kruskal-Wallis test revealed no statistically significant difference among these groups (P=0.141).In contrast, ferritin levels were significantly higher in CRP-positive patients (2,677.90±1,014.65 μg/L) compared to CRP-negative patients (1,687.40±1521.36 μg/L), with the difference reaching statistical significance (P=0.035), suggesting a potential influence of systemic inflammation on ferritin elevation (Table 2)
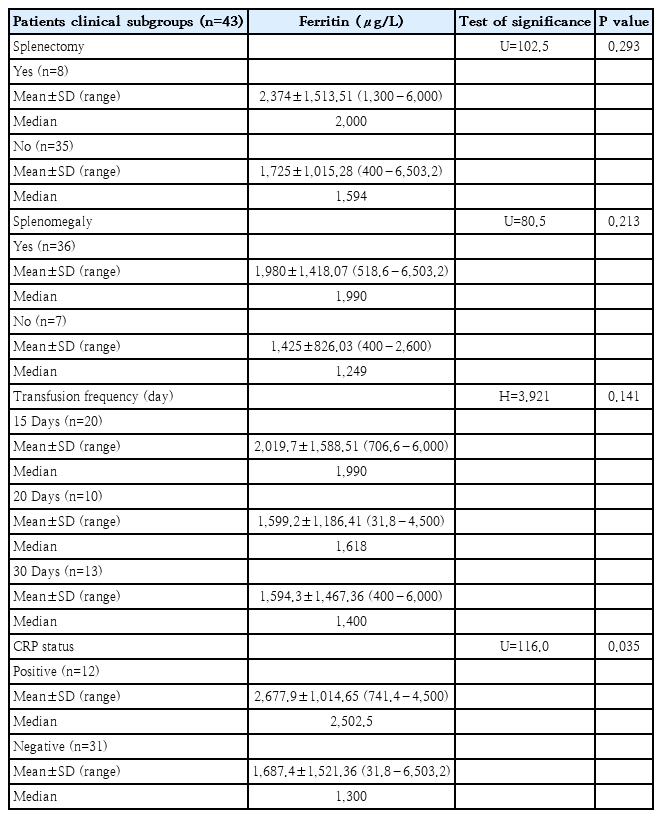
Comparison of serum ferritin levels across clinical variables in patients
A comparative analysis of laboratory findings between the patient group and the control group revealed that the patients exhibited significantly elevated levels of platelet count, IFN-γ, ferritin, and AST compared to the controls (P<0.001). Conversely, patients exhibited significantly lower Hb levels (P<0.001) and WBC count (P=0.020). No significant differences were observed between the 2 groups regarding CRP levels, ALT, serum urea, and creatinine (Table 3).
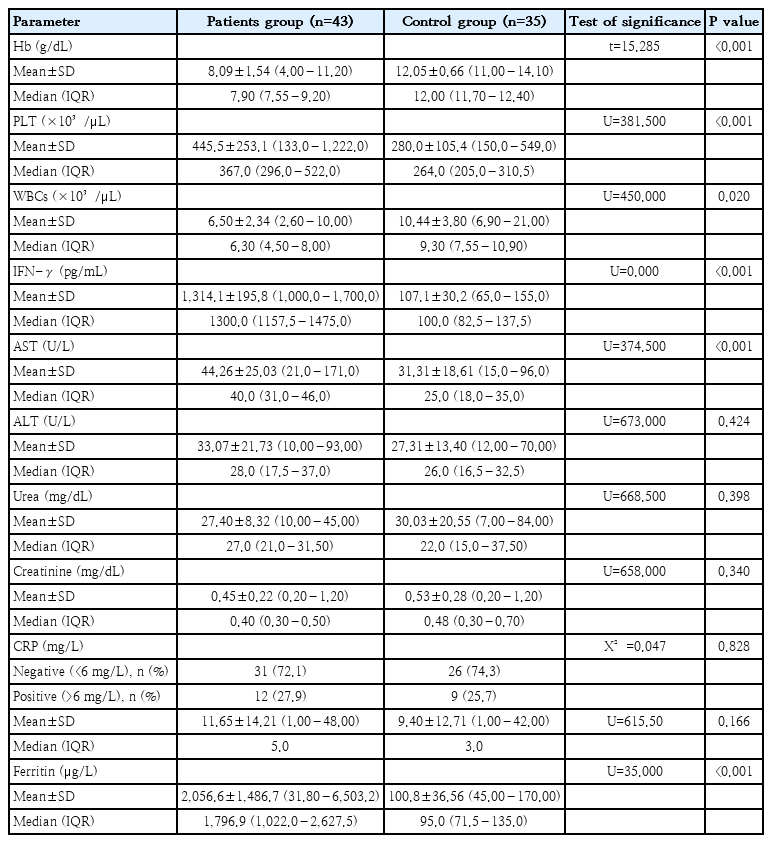
Comparison between patients and control group according to CBC, serum IFN-γ, serum ferritin, AST, ALT, serum creatinine, and serum urea
Moreover, the Mann-Whitney test was used to compare NK cell subsets between patients and the control group. The results showed that both CD56dim and CD56bright subsets were significantly lower in patients compared to the control group (P<0.001). In contrast, the CD56neg subset was significantly higher in patients than in the control group (P=0.002). Additionally, the percentage of CD3+ T cells was significantly lower in thalassemia cases compared to controls, with a highly significant P value (P<0.001) (Table 4 and Fig. 2). Using receiver operating characteristic curve analysis, a ferritin level of 2,111 μg/L was identified as the optimal cutoff point associated with NK cell suppression (Fig. 3).
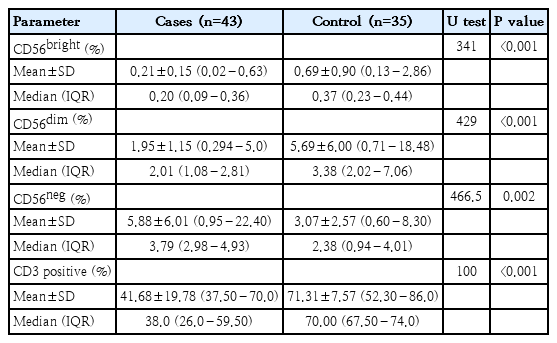
Comparison of natural killer cell subsets and CD3 positive cells between patients and control group
Comparison of natural killer cell subsets (CD56bright, CD56dim, CD56neg) and CD3 positive cells between patients and control group.
ROC curve identifying ferritin cutoff associated with natural killer cell suppression. ROC, receiver operating characteristic; AUC, area under curve; Sens, sensitivity; Spec, specificity; Thresh, threshold.
Spearman correlation analysis was performed to explore the relationship between serum ferritin levels and various clinical, hepatic, and immunological parameters in the patients. The results showed no significant correlation between ferritin and age at diagnosis (P=0.897) or transfusion frequency (P=0.157). Among liver function markers, a statistically significant positive correlation was found between ferritin and AST levels (P=0.010), while the correlation with ALT was not significant (P=0.160). In terms of immune cell populations, ferritin levels showed a significant negative correlation with CD56dim subset (P=0.003), indicating a potential suppressive effect of iron overload on this cytotoxic NK subset. No significant correlations were observed with CD56bright (P=0.216) or CD56neg NK cells (P=0.949). Additionally, ferritin levels were significantly negatively correlated with CD3-positive T cells (P=0.035), suggesting that iron overload may also impact the adaptive immune compartment. Finally, no significant correlation was observed between ferritin and IFN-γ levels (P=0.635) (Table 5).
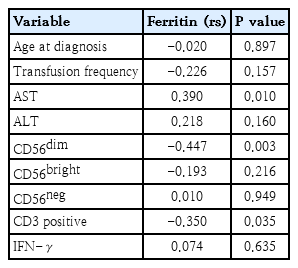
Correlation between serum ferritin levels and clinical, biochemical, and immunological parameters in thalassemia patients
In addition, point biserial correlation was used to assess the relationship between ferritin levels and binary clinical variables, including splenomegaly and splenectomy. The results revealed no significant association between ferritin levels and the presence of splenomegaly or a history of splenectomy, indicating that these clinical factors are not major determinants of ferritin variation in the studied patients (Table 6).
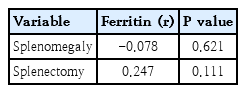
Correlation results of ferritin with splenomegaly and splenectomy status
Additionally, a correlation study was conducted to investigate the relationship between IFN-γ levels and NK cell subsets. The results indicated a negative correlation between IFN-γ levels and both the CD56bright and CD56dim subsets, with P values of <0.001 and 0.019, respectively. In contrast, the CD56neg subset showed a positive correlation with IFN-γ levels (Fig. 4A-C).
Spearman correlation between serum IFN-γ levels and natural killer cell subsets. (A) Correlation between serum IFN-γ level and CD56bright subset. (B) Correlation between serum IFN-γ level and CD56dim subset. (C) Correlation between serum IFN-γ level and CD56neg subset. IFN-γ, interferon-gamma; rs, Spearman correlation coefficient.
Discussion
Beta thalassemia is a common genetic disorder that primarily affects children worldwide, with a higher prevalence in Mediterranean regions such as Egypt. βTM is the most severe form of the disease, caused by mutations or deletions in the β-globin gene, leading to reduced or absent β-globin protein production. This genetic defect disrupts hemoglobin synthesis, resulting in ineffective erythropoiesis and increased RBC turnover [14].
For most children with βTM, early and regular blood transfusions are essential for disease management. Additional treatment options include iron chelation therapy to prevent iron overload and, in some cases, splenectomy to mitigate complications associated with an enlarged spleen [15].
Our study investigated the impact of regular blood transfusions and iron overload on NK cells, focusing on their subsets and cytokine production. Specifically, we measured the serum levels of IFN-γ in Egyptian pediatric patients with βTM and compared them with healthy children serving as the control group.
Regular blood transfusions support normal growth and development in children while alleviating complications associated with anemia. However, it is important to recognize the potential adverse effects that may accompany these transfusions. These include hemolytic and nonhemolytic transfusion reactions, transfusion-transmitted infections, transfusion-related acute lung injury, and TRIM, and others [16].
There are several potential mechanisms underlying TRIM. One such mechanism involves RBC hemolysis, which can occur both during storage and after transfusion. This process leads to a decrease in pH, an increase in lactate and other metabolic wastes, and the release of microparticles, along with the accumulation of cell-free hemoglobin, heme, and iron [17]. The iron present can exist in the form of transferrin-bound iron, nontransferrin-bound iron, or labile plasma iron. Given the well-established bioactivities of these species, RBC hemolysis can disrupt the plasma redox balance and interfere with normal signaling in the coagulation, vascular, and immune systems [18]. TRIM affects the immune system by altering the balance between helper and suppressor T lymphocytes, reducing their ratio. It also impairs the function of NK cells, hampers antigen presentation, and weakens cell-mediated immunity [19].
Iron overload can further contribute to immune suppression by impairing the proliferation and activation of T cells, B cells, and NK cells [20]. Our findings were consistent with previously established evidence. The serum ferritin levels were significantly higher in patients compared to the control group. We also observed a reduction in NK cell subsets (CD56dim and CD56bright) in the patient group, with the percentage of CD56dim cells showing a negative correlation with ferritin levels, which aligns with the immunosuppressive effects of both iron overload and TRIM. Additionally, CD3+ T lymphocytes were found to be decreased in comparison with the control group. This is in agreement with Amrita et al. [21], who reported a correlation between serum ferritin levels and CD4, CD8, and the CD4/CD8 ratio. Increased ferritin levels due to iron overload were associated with a decrease in CD4 cells, an increase in CD8 cells, and a lower CD4/CD8 ratio.
One of the NK cell subsets is CD56neg cells, which were first identified 30 years ago in patients with human immunodeficiency virus [22]. These cells have been shown to expand during chronic infections, such as hepatitis C virus, particularly in individuals who failed treatment [23]. More recently, CD56neg cells have also been observed in elderly individuals (>60 years of age) coinfected with human cytomegalovirus and Epstein-Barr virus [24]. In our study, we observed that the percentage of CD56neg NK cells was higher in patients compared to the control group. We speculate that this elevation may be due to iron overload in the patients, which could lead to chronic inflammation and oxidative stress. This hypothesis aligns with the findings of Catherine et al. [25], who reported an accumulation of CD56neg NK cells in children exposed to Plasmodium falciparum malaria and in pediatric cancer patients diagnosed with endemic Burkitt lymphoma. They suggested that CD56neg NK cells may represent an adaptive response to chronic diseases.
In addition to their role in cytotoxic responses against viruses, parasites, bacteria, and tumor cells, NK cells also have cytokine production activity, including the secretion of IFN-γ. We measured the serum levels of IFN-γ in all the participating children. Our results showed that the IFN-γ levels were significantly higher in patients compared to the control group. This finding aligns with studies by Salsaa and Zoumbos [26] and Obeid et al. [27], who also found elevated levels of IFN-γ in βTM patients compared to controls. While our study observed elevated (IFN-γ) levels in patients with βTM, other research has reported decreased IFN-γ levels in these patients. For instance, Fadhil et al. [28] found reduced IFN-γ levels in β-thalassemia patients compared to control groups. Similarly, Gluba-Brzózka et al. [29] demonstrated significantly decreased IFN-γ production by activated lymphocytes from β-thalassemia patients compared to normal controls. These discrepancies may arise from differences in study design, patient demographics, and methodologies, highlighting the need for further research to elucidate the kinetic of IFN- in β-thalassemia.
Normally, IFN-γ is produced by activated NK cells [30], CD4+ Th1 cells [31], and CD8+ cytotoxic T cells [32]. We suggest that the production of IFN-γ in our study may be attributed to the CD56neg NK cell subset, as evidenced by the immunosuppressive effects of iron overload on CD3+ T lymphocytes and NK cell subsets (CD56dim and CD56bright) in the patients. Additionally, we observed a positive correlation between IFN-γ levels and the percentage of CD56neg cells, further supporting this hypothesis. This suggestion is supported by the following explanation: Both CD56neg and CD56dim NK cells are characterized by similarly high expression of CD6 and CX3CR1. CD6 is involved in the secretion of cytokines and chemokines, such as IFN-γ, TNF, CXCL10/IP-10, and CXCL1, in CD56dim NK cells, indicating a similar role in CD56neg NK cells [33]. Interestingly, in T cells, CD6 stabilizes the immunological synapse in crosstalk with DCs [34,35]. Since the crosstalk between NK cells and DCs also relies on stable immunological synapses, it is plausible to speculate that CD6 plays a crucial role in the function of CD56dim and CD56neg NK cells [36]. Furthermore, CX3CR1, through its interaction with CX3CL1 on DCs, may enhance the activation of CD56neg NK cells and promote IFN-γ production [37].
In conclusion, our study revealed alterations in immune cell populations, including CD3+T lymphocytes and NK cell subsets, in pediatric patients with βTM—findings likely associated with hyperferritinemia and TRIM. However, given the limited sample size, further in-depth mechanistic investigations are necessary to validate these observations. In addition, more research is needed to evaluate the functional activity of CD56neg NK cells. Future studies should also focus on defining effective therapeutic strategies to enhance NK cells within the adaptive subpopulation.
Notes
Conflicts of interest
No potential conflict of interest relevant to this article was reported.
Funding
This study received no specific grant from any funding agency in the public, commercial, or not-for-profit sectors.
Author contribution
Conceptualization: HHES; Data curation: HHES; Formal analysis: NHEM, HHES; Funding acquisition: HHES; Methodology: FIE, HHES; Project administration: HHES; Visualization: MESAEH, HHES; Writing - original draft: MARS, HHES; Writing - review & editing: FIE, HHES