Clinical outcomes and healthcare utilization of hospitalized children with influenza versus COVID-19
Article information
 , Chuin-Hen Liew, MPaeds2, Kah Kee Tan, FRCPCH3, Joanne Pereira, MRCPCH1, Muhammad Ihsan Roslan, MRCPCH1, Xiang Lin Cheng, MRCPCH1, Hui Yi Lim, MRCPCH1, Farah Nuruliayana A. Nazri, MMed1, Asuwani Maran, MD1, Wan Fei Wong, MD1, Yasothai Chandran, MMed1, Syaniza Shaharudin, MD1, Pon Ling Lau, MD1, Naveen Nair Gangadaran, MRCPCH1, Marlindawati Mohd Ali, MPath1
Abstract
Background
Influenza and coronavirus disease 2019 (COVID-19) are major causes of pediatric respiratory illness with overlapping clinical features but potentially differing impacts on healthcare utilization and outcomes.
Purpose
To compare the clinical presentations, healthcare resource utilization, and outcomes of children hospitalized with influenza and COVID-19 and address the gaps in pediatric data from Southeast Asia.
Methods
This retrospective observational study included children aged ≤12 years hospitalized with laboratory-confirmed influenza or COVID-19 at a tertiary hospital in Malaysia between May 1, 2022, and May 1, 2023. Patients with viral or bacterial coinfections were excluded. Influenza A and B cases were collectively analyzed. The patients' demographic data, clinical presentation, resource utilization, and outcomes were also evaluated. Propensity score matching (PSM) was performed to balance the cohorts for age, sex, ethnicity, and comorbidities. Outcomes were compared using standardized mean differences (SMDs).
Results
A total of 299 patients were included (influenza, n=177; COVID-19, n=122). Patients with influenza were older (median, 3.6 years vs. 1.8 years; P<0.001) and more likely to have fever, cough, and rhinorrhea. COVID-19 patients presented earlier in the illness (median, 2 days vs. 4 days; P<0.001). After PSM, 102 patients were included in each group. Patients with influenza required greater healthcare resource use, including intravenous fluids (60.8% vs. 43.1%; SMD=0.36), empirical antibiotics (40.2% vs. 12.7%; SMD=0.66), respiratory support (40.2% vs. 26.5%, SMD=0.29), pediatric intensive care unit admission (10.8% vs. 2.9%; SMD=0.32), and longer duration of oxygen therapy (SMD=0.93).
Conclusion
Children hospitalized for influenza demonstrated higher clinical severity and greater healthcare resource utilization than those hospitalized for COVID-19. These findings highlight the burden of influenza and inform hospital resource planning during periods of viral circulation.
Key message
Question: How do clinical presentations, healthcare resource utilization, and outcomes differ between children hospitalized with influenza versus coronavirus disease 2019 (COVID-19)?
Finding: Patients with influenza were older, were more symptomatic, and required greater healthcare resources, including intravenous fluids, empirical antibiotics, respiratory support, and pediatric intensive care unit admission.
Meaning: Influenza involves greater severity and a higher healthcare burden than COVID-19, highlighting the need for preventive strategies such as vaccination and hospital resource planning during seasonal outbreaks.

Graphical abstract
Introduction
Influenza and coronavirus disease 2019 (COVID-19) are major causes of respiratory illness in children, often leading to hospitalization. While both viruses share similar transmission routes and overlapping clinical features, their clinical outcomes and hospital resource utilization may differ significantly.
Several studies have compared the severity and outcomes of influenza and COVID-19 [1-3]. However, most data come from Western settings, with limited pediatric data from Southeast Asia where regional differences in epidemiological patterns, healthcare access and vaccination coverage can influence clinical outcomes and hospital resource utilization.
During the early stages of the COVID-19 pandemic, strict public health measures such as mask mandates, social distancing and school closures led to a sharp decline in influenza cases [4,5]. However, a resurgence of influenza cases was observed after relaxation of these measures, resulting in a period where both viruses cocirculated [6,7]. This provided a unique opportunity to directly compare the clinical impact of both infections in hospitalized children.
Our study aimed to compare the clinical characteristics, healthcare resource utilization and outcomes of pediatric patients hospitalized with influenza and COVID-19 during this period of cocirculation. The findings of this study would provide valuable insights into the differential burden of these infections, improve resource planning and guide public health strategies for managing these infections.
Methods
1. Setting and design
This was a retrospective study conducted at Hospital Tuanku Ja’afar Seremban, Negeri Sembilan, Malaysia, the sole tertiary referral center in the state with pediatric intensive care unit (PICU) facilities. The hospital serves a population of approximately 1,200,000 people including 290,000 children below 12 years. We included children aged ≤12 years who were hospitalized with laboratory-confirmed influenza or COVID-19 between 1 May 2022 and 1 May 2023. Patients with multiple respiratory viral co-detections or bacterial coinfections were excluded to minimize confounding effects on clinical presentation and disease outcomes.
Data were extracted from hospital electronic medical records using a structured data collection form. Information collected included demographics, underlying comorbidities, clinical and laboratory findings and hospital outcomes such as PICU admission, length of stay and mortality rates. Additionally, hospital resource utilization was recorded such as the use of intravenous (IV) fluids, bronchodilators, corticosteroids, antibiotics and respiratory support.
2. Study definitions
Clinical signs and symptoms were recorded at presentation to the hospital. Fever was defined as a body temperature of ≥37.5˚C, and illness duration was calculated form the onset of symptoms. The source of infection was classified as an adult or child contact, based on prior definitions [8]. In cases where multiple household members exhibited symptoms, the earliest symptomatic individual was considered the primary sick contact. Adventitious lung sounds such as crackles, wheezing or rhonchi were documented. Patients were categorized based on clinical phenotypes at presentation, including upper respiratory tract infection (URTI), lower respiratory tract infection (LRTI), fever with nonspecific symptoms, asthma exacerbation, acute gastroenteritis, febrile seizures and croup, as described previously [9]. For the purpose of this study, cases of influenza A and B were grouped together and analyzed collectively as the influenza cohort.
3. Laboratory methods
Nasopharyngeal aspirates (or endotracheal aspirates for ventilated patients) were obtained within 24 hours of admission from all patients presenting with fever and/or cough, regardless of their clinical phenotype. Direct fluorescent antibody (DFA) assays were used for antigen detection, using the D3 Ultra DFA Respiratory Virus Screening and Identification Kit (Diagnostic Hybrids, Inc., USA). This panel detects influenza A, influenza B, adenovirus, respiratory syncytial virus, human metapneumovirus and parainfluenza types 1–3. Testing for severe acute respiratory syndrome coronavirus 2 was performed separately using a lateral flow chromatographic immunoassay (Prodetect, Mediven, Malaysia).
4. Statistical analysis
Categorical variables were presented as frequencies and percentages (%), with comparisons performed using the chi-square test or Fisher exact test, as appropriate. Continuous variables, which displayed a skewed distribution as evidenced by the Kolmogorov-Smirnov test, were expressed as medians and interquartile ranges (IQRs) and analyzed using the Mann-Whitney U test. Statistical significance was defined as a P value <0.05.
To compare resource utilization and outcomes between influenza and COVID-19 patients, propensity score matching (PSM) was employed to minimize confounding bias. The propensity score was estimated using a logistic regression model, using age (years), ethnicity, sex, and presence of comorbidities as covariates. A 1:1 nearest-neighbor matching approach was applied with a caliper width of 0.2. The balance of baseline covariates after matching was assessed using standardized mean differences (SMDs), with values <0.2 considered acceptable balance between groups. Group comparisons were reported with effect sizes. For continuous outcomes, Cohen d was used to describe the magnitude of difference, interpreted as trivial (SMD < 0.2), small (0.2–0.49), moderate (0.5–0.79), and large (≥0.8) [10]. For categorical variables, the SMD was calculated using the formula formula [11]
Data analyses were conducted using Python, R, and SPSS. Data visualization was performed using Matplotlib (ver. 3.7.2) and Seaborn (ver. 0.12.2) to generate figures. The Kolmogorov-Smirnov and Little Missing Completely at Random test were performed using SciPy (ver. 1.11.1). Missing data were handled using Multiple Imputation by Chained Equations through Scikit-learn (ver. 1.3.0). PSM was conducted in R using the Rcmdr Plug-in Package (ver. 4.2.1). The chi-square test, Fisher exact test, and Mann-Whitney U test were conducted using IBM SPSS Statistics ver. 26.0 (IBM Co., USA).
Details regarding outlier analysis, missing data handling, imputation methodology and postmatching balance assessments are provided in Supplementary Tables 1–2 and Supplementary Figs. 1–3.
5. Code availability
The code used for data preprocessing, including handling missing data, outlier detection, and statistical analyses, is available on GitHub at the following link: https://github.com/chuinhen/Flu_COVID19/blob/main/code/FluCOVID19.ipynb.
6. Data availability
The processed dataset and SPSS output files used in this study have been made publicly accessible on Figshare and can be accessed via the following link [12]: https://doi.org/10.6084/m9.figshare.28632833, https://doi.org/10.6084/m9.figshare.29646368.v1.
7. Ethical considerations
The study was reviewed and approved by the Medical Research and Ethics Committee, Ministry of Health Malaysia [NMRR-22-02497-W9I(3)] and received informed consent exemption. No personal or identifiable data were collected during the conduct of the study.
Results
During the study period, 319 children hospitalized with a positive respiratory viral test for influenza or COVID-19 were identified. After excluding 20 patients due to viral and bacterial coinfections, the study population comprised 299 patients: 177 with influenza and 122 with COVID-19. Vaccination uptake was low, with only 3 patients (1 in the influenza group, 2 in the COVID-19 group) having received influenza vaccine and 10 patients (5 in each group) having received COVID-19 vaccine in the preceding year.
The median age of children with influenza was significantly higher than those with COVID-19 (3.6 years [IQR 1.4–5.8 years] vs. 1.8 years [0.8–3.7 years], P<0.001). There were significant differences in ethnic distribution, with a higher proportion of Malays in the influenza group (88.7% vs. 70.5%, P<0.001) and a higher proportion of Chinese in the COVID-19 group (16.4% vs. 1.7%, P<0.001). The proportion of patients with sick contact with a child was higher in the influenza group than in the COVID-19 group (46.3% vs. 10.7%, P<0.001), whereas contact with a sick adult was higher in the COVID-19 group (57.4% vs. 27.7%, P<0.001). There were no differences in the comorbidities between both groups (Table 1).
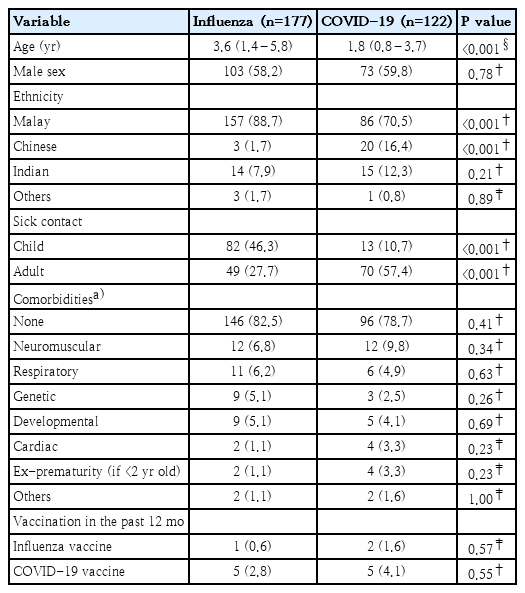
Demographic and baseline characteristics of children hospitalized with influenza versus COVID-19
Table 2 demonstrates the clinical features and laboratory investigation findings on admission. Children with COVID-19 presented earlier in the course of their illness than those with influenza (median day of illness 2 vs. 4, P<0.001). Fever was more commonly reported among influenza patients (97.2% vs. 89.3%, P<0.01), corresponding to the higher median temperature on arrival (38.0˚C vs 37.6˚C, P<0.001). Symptoms such as cough (87.6% vs. 59.8%, P<0.001) and rhinorrhea (69.5% vs. 51.6%, P=0.002) were more common in influenza cases. Children with influenza were more likely to present with a clinical phenotype of URTI (41.8% vs. 19.7%, P<0.001) or LRTI (26.6% vs. 14.8%, P=0.02), whereas patients with COVID-19 were more likely to present with a fever with nonspecific symptoms phenotype (24.6% vs. 9.6%, P<0.001). Croup was more frequently observed in COVID-19 patients than in influenza patients (4.9% vs. 0.6%, P=0.02). Laboratory investigations revealed a lower median platelet count among those with influenza (255×109/L vs. 286×109/L, P= 0.04), but a higher median C-reactive protein level (13.1 mg/L vs. 6.7 mg/L, P=0.03).
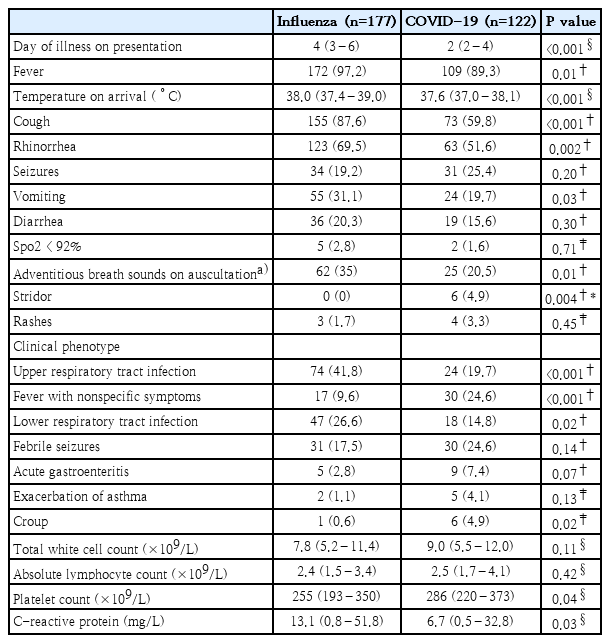
Clinical and laboratory characteristics of children hospitalized with influenza versus COVID-19
PSM was performed to balance key confounding factors, including age, sex, ethnicity, and the presence of comorbidities, to ensure comparability of clinical outcomes between the 2 groups. The initial unmatched cohort consisted of 177 influenza patients and 122 COVID-19 patients, while the matched cohort had 102 patients in each group (Table 3). All matched variables successfully attained balance (SMD<0.2), except for the Chinese ethnicity variable, which had an SMD of 0.40, indicating a residual imbalance. The density distribution plots of the propensity scores overlapped (Supplementary Fig. 3), demonstrating balanced covariates between the 2 groups and supporting their comparability.
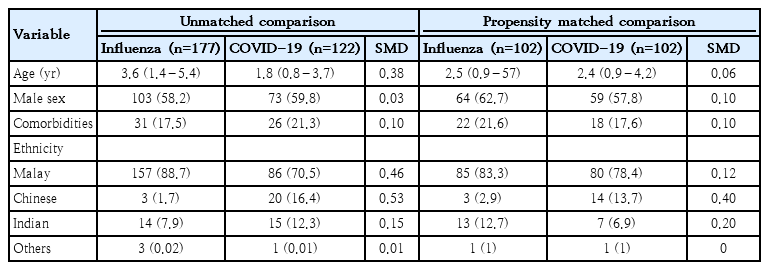
Demographic and clinical characteristics of patients with influenza versus COVID-19 before versus after propensity score matching
The utilization of healthcare resources and outcomes were compared between both groups postmatching (Table 4). Children with influenza demonstrated higher usage of IV fluids (60.8% vs. 43.1%, SMD=0.36) and empirical IV antibiotics (40.2% vs. 12.7%, SMD=0.66). There was a higher rate of PICU admissions among influenza patients compared to COVID-19 patients (10.8% vs. 2.9%, SMD=0.32). The need for any form of respiratory support was higher in the influenza group (40.2% vs. 26.5%; SMD=0.29), with high-flow nasal cannula usage specifically higher among influenza patients (7.8% vs 1.0%, SMD=0.34). The median duration of oxygen therapy was longer for influenza patients compared to COVID-19 patients (3 [IQR, 2–4] days vs. 1 [IQR, 1–2] days; SMD=0.93). Similarly, the median length of hospitalization was higher for influenza patients (3 [IQR, 2–4] days vs. 1 [IQR, 1–2] days; SMD 0.70). Mortality was low in both groups, with only one death reported in the influenza group.
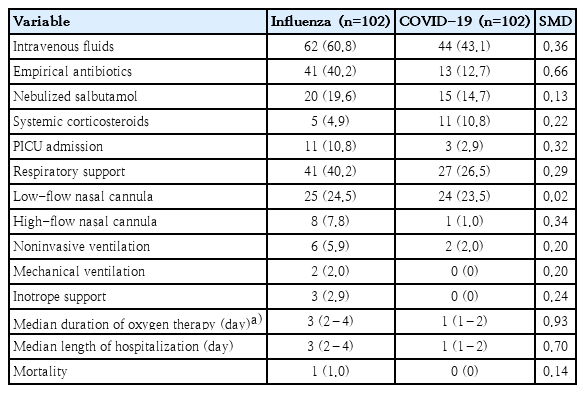
Healthcare resource utilization and clinical outcomes of patients with influenza versus COVID-19 after propensity score matching
Discussion
In this study, we compared the differences in clinical presentation, resource utilization and clinical outcomes between influenza and COVID-19 infections in hospitalized pediatric patients. The study was conducted during a period when multiple Omicron sublineages (including BA.2, BA.5, and XBB) predominated in Malaysia [13,14], and both influenza A and B were cocirculating with periods of alternating dominance (Supplementary Fig. 4). At the time of the study, COVID-19 vaccination for children was no longer mandatory and influenza vaccination was not included in the national immunization program, which may explain the low vaccination uptake.
We observed significant demographic differences between these infections. Patients with influenza were significantly older than those with COVID-19, contrasting with reports earlier in the pandemic [1,15]. A shift in epidemiology was seen with the emergence of the Omicron variant, with COVID-19 patients being younger while influenza continued to affect more school-going children [16,17]. This trend was consistent with our findings, where COVID-19 patients were younger than those with influenza, aligning with observations from others [18]. We observed differences in ethnicity between both groups, which may be influenced by healthcare access and insurance coverage. COVID-19 hospitalizations in the country were generally not covered by private insurance during the study period, which may have contributed to the differences in admission patterns. Among the patients with COVID-19, there was a higher proportion of patients with sick contact with adults, a trend we have observed previously [8]. In contrast, influenza patients, who tend to be older, likely contracted influenza through contact at schools, explaining the higher proportion of sick contact with children in the influenza group.
We also observed that the median day of illness at presentation to hospital was earlier for COVID-19 patients compared to those with influenza. This earlier presentation may be due to readily available home test kits for COVID-19, which facilitates earlier diagnosis and subsequent hospital admission. Symptoms such as fever, cough, rhinorrhea were more common in influenza than COVID-19, consistent with previous studies [18,19]. On the other hand, stridor was more frequently observed in COVID-19, particularly during the Omicron wave, as previously reported [20]. This can be explained by Omicron's predilection for upper airways [21], increasing risk of subglottic airway obstruction and resulting in croup. Some studies have suggested that total white and differential counts may help differentiate between COVID-19 and influenza [22-24]. We observed a statistically significant difference in platelet counts, with lower values in influenza patients. However, both groups had median platelet counts within the normal range, suggesting limited clinical relevance despite statistical significance. Overall, we did not find the full blood count parameters to be reliable in distinguishing between these infections.
Our findings demonstrate that influenza patients required significantly higher healthcare resource utilization than COVID-19 patients. This was demonstrated by the higher usage of intravenous fluids, empirical antibiotics and high-flow nasal cannula in the influenza group. Additionally, influenza patients had higher rates of PICU admission, longer median duration of oxygen therapy and a longer length of hospitalization, suggesting increased clinical severity. While our findings are consistent with previous studies [25,26], they differ from others that reported COVID-19 as more severe than influenza in terms of PICU admission or mortality [3,27,28]. However, these studies compared hospitalizations of influenza and COVID-19 during separate time periods, which can introduce bias due to differences in healthcare practices, treatment protocols and public health measures. Unlike those studies, our study was conducted during a period where COVID-19 and influenza cocirculated, allowing for a more direct comparison. The epidemic patterns and clinical presentation of influenza during this period were broadly consistent with those observed locally prior to the pandemic [29]. Additionally, previous studies often relied on unmatched cohorts, increasing the risk of confounding and selection bias. In contrast, we used propensity matched scoring to balance the differences in the age and demographics between both groups. This allowed a fair comparison of the healthcare resource utilization and outcomes of both diseases. Our findings are consistent with previous studies done locally reporting the generally mild outcomes of pediatric COVID-19 throughout the pandemic [9].
Our findings are subject to several limitations. First, our study was conducted in a single center, limiting the generalizability of the findings to other settings with different demographics or resource availability. Second, we utilized antigen detection methods for diagnosis, which are less sensitive than polymerase chain reaction-based techniques and may have resulted in underreporting of viral coinfections. However, antigen tests are commonly used in real-world settings due to their rapid turnaround time, making our findings reflective of routine clinical practice. Moreover, the same diagnostic methods were applied to both groups, minimizing bias in the comparison between groups. Third, while PSM was used to reduce confounding and improve comparability, matching was limited to age, ethnicity, sex, and comorbidities. Although these are important variables, unmeasured confounders may still have impacted clinical outcomes. Additionally, due to substantial baseline differences, achieving optimal matching for ethnicity was challenging, potentially resulting in residual imbalances. Fourth, our study was conducted during the period when the Omicron variant predominated, which may limit comparisons with studies conducted during more severe prior variants. Despite these limitations, our study provides valuable insights on the healthcare resource utilization and outcomes of pediatric influenza and COVID-19 infections. Our findings highlight the burden of influenza in pediatric populations and emphasize the importance of preventive strategies such as vaccination and timely antiviral therapy. Additionally, our findings can be useful for hospital resource planning and preparedness for future outbreaks.
In conclusion, influenza and COVID-19 present with overlapping clinical symptoms. However, children with influenza demonstrated higher healthcare resource demands compared to COVID-19. Although COVID-19 presented as a milder illness, continued vigilance is required due to the potential for emerging variants and long-term consequences of this evolving virus.
Supplementary materials
Supplementary Tables 1-2 and Supplementary Figs. 1-4 are available at https://doi.org/10.3345/cep.2025.00759.
Outlying values for continuous variables
Missing values for continuous variables
Quantile-quantile plots for continuous variables. This figure shows QQ plots for the continuous variables. The red diagonal line represents the theoretical normal distribution reference line under normality. Deviations from this line indicate skewed from normality. All QQ plots displayed nonlinear patterns, indicating that all tested continuous variables deviated from a normal distribution. LOS, length of stay; TWC, total white cell; ALC, absolute lymphocyte count; CRP, C-reactive protein; ALT, alanine aminotransferase; ALP, alkaline phosphatase
Comparison of observed and imputed data distributions for continuous variables. This figure presents the density distributions of selected continuous variables, comparing the observed (original) and imputed data. The x-axis represents the variable values, while the y-axis represents density. Blue color represents the observed data distribution, while the red represents the imputed values, which were generated using Multiple Imputation by Chained Equations. The overlaid density curves and histograms illustrate the similarity between the observed (blue) and imputed (red) distributions, showing that the imputation process preserved the original data distribution structure. CRP, C-reactive protein; ALT, alanine aminotransferase; ALC, absolute lymphocyte count; TWC, total white cell; ALP, alkaline phosphatase.
Density plot of propensity score matching. This figure illustrates the distribution of propensity scores after matching for patients with influenza and coronavirus disease 2019 (COVID-19). The x-axis denotes the propensity scores, while the y-axis represents the density of subjects. The gray line represents the total sample distribution, while the orange and blue lines correspond to the matched groups (influenza and COVID-19, respectively). The density curves illustrate the overlap in propensity score distributions, thereby reflecting balance of covariates between the two comparing groups after matching.
Detection of influenza subtypes in Malaysia during the study period. The figure displays the temporal distribution and alternating predominance of influenza A and B during the study period. Source: World Health Organization. FluNet. Available at: https://worldhealthorg.shinyapps.io/flunetchart/.
Notes
Conflicts of interest
No potential conflict of interest relevant to this article was reported.
Funding
This study received no specific grant from any funding agency in the public, commercial, or not-for-profit sectors.
Acknowledgments
We thank the Director-General of Health Malaysia for permission to publish this article.
Author contribution
Conceptualization: DCEN, CHL, MMA; Methods: DCEN, CHL, MMA; Data curation and project administration: JP, MIR, XLC, HYL, FNAN, AM, WWF, YC, SS, PLL, NNG; Formal Analysis and Visualization: CHL; Draft writing: DCEN, CHL; Writing, reviewing, and editing: DCEN, CHL, KKT.