Association between sodium content of intravenous immunoglobulin and electrolyte changes and clinical course of Kawasaki disease
Article information

Abstract
Background
Intravenous immunoglobulin (IVIG) formulations used to treat Kawasaki disease differ markedly in sodium content; however, the clinical significance of this factor remains unclear.
Purpose
Here we investigated whether sodium content influences electrolyte changes and short-term clinical outcomes of Kawasaki disease.
Methods
This single-center retrospective cohort study included 744 children with first-episode Kawasaki disease treated with 2-kg IVIG in 2010–2020. The patients were categorized into high-sodium (Glovenin-I or Venilon-I) and low-sodium (Venoglobulin IH) groups. Serum electrolytes, total protein, and immunoglobulin G levels were measured before and after IVIG administration. Outcomes included additional IVIG administration and the presence of coronary artery lesions.
Results
Compared to the low-sodium group, the high-sodium group had significantly increased serum sodium (2.9±3.2 mEq/L vs. 1.7±2.7 mEq/L) but significantly decreased serum potassium (-0.13±0.50 mEq/L vs. -0.03±0.49 mEq/L) levels after IVIG therapy. After its administration, hyponatremia occurred more often in the low-sodium group (4.4% vs. 0.3%), whereas hypokalemia occurred more frequently in the high-sodium group (9.9% vs. 5.5%). Total protein, immunoglobulin G, and albumin levels were higher in the low-sodium group. The rates of additional IVIG use and coronary artery lesions did not differ significantly between groups.
Conclusion
Our findings demonstrate that the sodium content of IVIG contributes to distinct changes in electrolyte and protein concentrations during the acute phase of Kawasaki disease. However, these biochemical differences were not associated with short-term clinical outcomes. Awareness of formulation-specific profiles may help clinicians interpret laboratory findings appropriately during IVIG therapy.
Key message
Question: Hyponatremia in Kawasaki disease is associated with inflammation and disease severity. Intravenous immunoglobulin (IVIG) formulations feature various sodium contents. What is the clinical impact of such variations?
Finding: IVIG sodium content was associated with sodium, potassium, and protein level changes.
Meaning: Coronary outcomes were similar but electrolyte changes differed: high-sodium IVIG caused hypokalemia, whereas low-sodium IVIG caused hyponatremia. IVIG preparation requires consideration when interpreting laboratory values.

Graphical abstract. IVIG, intravenous immunoglobulin.
Introduction
Kawasaki disease, an acute febrile vasculitis in childhood, is the leading cause of acquired heart disease among children in developed countries [1]. Intravenous immunoglobulin (IVIG) at a dose of 2 g/kg remains the standard first-line therapy that effectively reduces systemic inflammation and the risk of coronary artery abnormalities [1]. However, metabolic and electrolyte alterations, such as hyponatremia, frequently occur during the acute phase of Kawasaki disease and have been associated with systemic inflammation, non-osmotic vasopressin release, and capillary leakage [2]. Previous studies suggested that hyponatremia may be correlated with either disease severity or IVIG resistance [2], but these investigations did not consider sodium contents of IVIG products.
In Japan, various IVIG preparations with different sodium (Na) contents have been clinically utilized [3], yet their impact has not been well characterized. Several studies have evaluated serum Na changes after IVIG administration using high-Na or low-Na formulations [4-6]. However, available evidence is limited, and the impact of formulation-related differences on electrolyte profiles or clinical outcomes still remains unclear. This study aimed to compare electrolyte changes and clinical outcomes in patients with acute Kawasaki disease receiving IVIG preparations with different Na contents.
Methods
This retrospective cohort study was conducted between January 2010 and December 2020 at Showa Medical University Northern Yokohama Hospital and included patients diagnosed with Kawasaki disease. The disease was diagnosed following the guidelines issued by the Japan Kawasaki Disease Research Committee. Coronary artery lesions (CALs) were defined according to the 6th revised edition using a z score threshold of ≥2.5.7) Patients with both complete and incomplete (≤4 principal clinical findings) Kawasaki disease were included. The medical records of all patients who received initial IVIG therapy during their first episode of Kawasaki disease were reviewed. Patients with recurrent Kawasaki disease, those who defervesced without IVIG, and those who were transferred before initial treatment were excluded. Moreover, patients who received electrolyte correction therapy immediately after IVIG initiation or concurrent fluid replacement during IVIG infusion were excluded. Patients requiring a change in the IVIG product due to allergic reactions or those receiving adjunctive immunosuppressive therapy, such as cyclosporine or corticosteroids, during the initial course were also excluded. Furthermore, patients with missing serum electrolyte or protein data before or after IVIG administration were excluded from the analysis.
The choice of IVIG preparation was not standardized and was determined at the discretion of the attending physicians. During the study period, only 5% IVIG formulations were administered, which differed in their manufacturing processes and Na concentrations. Venilon-I (KM Biologics Co., Ltd., Japan) is a sulfonated, lyophilized preparation containing approximately 154 mEq/L of Na. Glovenin-I (Takeda Pharmaceutical Company Ltd., Japan) is a polyethylene glycol (PEG)-treated, lyophilized preparation with the same Na concentration (≈154 mEq/L). Venoglobulin IH (Japan Blood Products Organization, Japan) is a PEG-treated liquid formulation with a markedly lower Na concentration (≈0.1 mEq/L). Based on these characteristics, patients treated with Glovenin-I or Venilon-I were classified into the high-Na group, whereas those treated with Venoglobulin IH were classified into the low-Na group. These classifications were made according to the guidelines for medical treatment of acute Kawasaki disease (2020 revised version) [3]. IVIG was administered at a total dose of 2 g/kg infused continuously over approximately 24 hours. Infusion was initiated at 0.01 mL/kg/min for the first hour and increased to 0.03 mL/kg/min if no adverse reactions occurred. This protocol was standardized across the institution. Given that the infusion required around 24 hours to complete, post-IVIG sampling was generally performed 36–48 hours after the start of infusion. Laboratory data were obtained within 24 hours before and approximately 24 hours after IVIG administration.
Demographic and clinical data, including age, sex, and day of illness at diagnosis, were collected from the medical records. Laboratory parameters included serum Na, potassium (K), total protein (TP), and immunoglobulin G (IgG). Changes in serum concentrations of electrolytes were calculated as ΔNa=(Na after IVIG)−(Na before IVIG) and ΔK=(K after IVIG)−(K before IVIG). Hyponatremia was defined as serum Na≤130 mEq/L, a threshold commonly used to indicate clinically significant hyponatremia [8].
Hypokalemia was defined as serum K≤3.5 mEq/L, the standard cutoff widely used in pediatric electrolyte studies [9]. The Gunma score was calculated to estimate the risk of IVIG resistance [10]. Clinical outcomes included the requirement for additional IVIG and the development of CALs.
Continuous variables were expressed as means±standard deviations or medians with interquartile ranges, whereas categorical variables were expressed as counts and percentages. Comparisons between the 2 groups were performed using the t test or the Mann-Whitney U test for continuous variables and the chi-square or Fishers exact test for categorical variables. A P value of <0.05 was considered statistically significant. Statistical analyses were performed using JMP ver. 17.0 (SAS Institute Inc., USA).
This study was approved by the institutional review board of Showa Medical University Northern Yokohama Hospital (approval No. 22-186-B). Owing to the retrospective design of this study, the need for informed consent was waived. Instead, information regarding the study was disclosed on the hospital website to ensure participants had the opportunity to decline participation (opt-out approach).
Results
The cohort was derived from 948 patients diagnosed with first-episode Kawasaki disease during the study period. After applying the exclusion criteria, a total of 744 patients were included in the final analysis (Fig. 1).
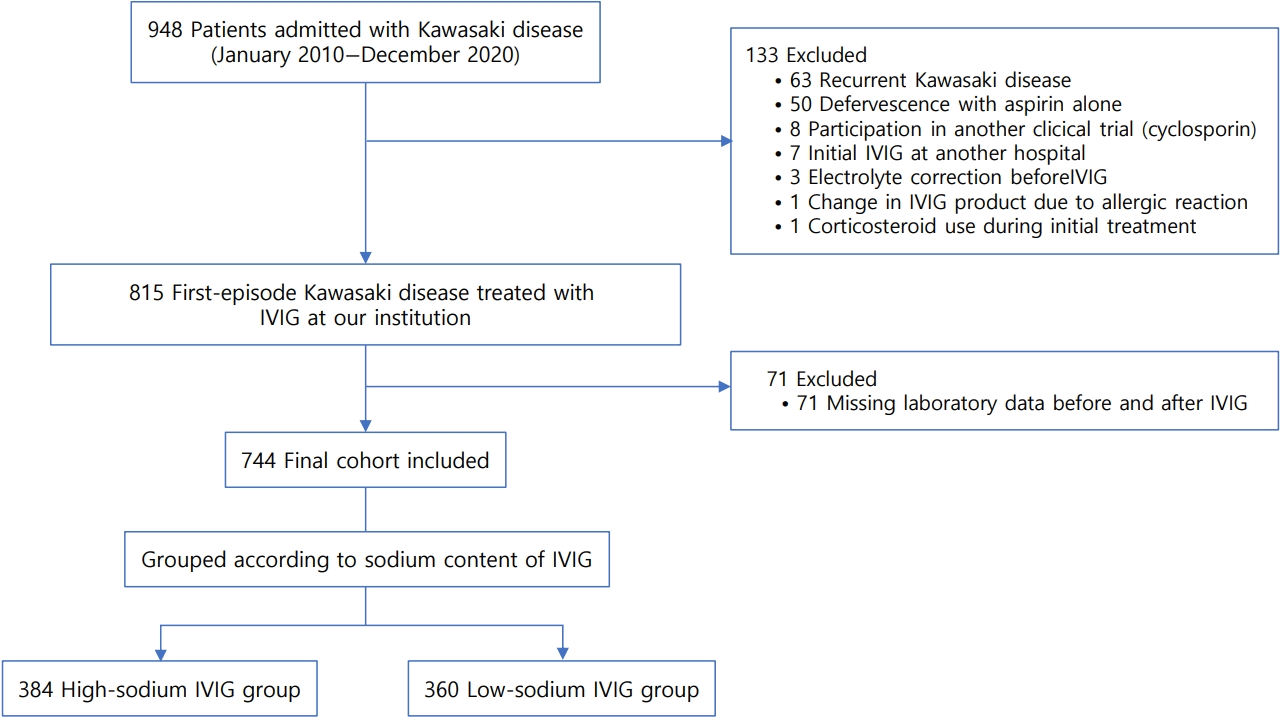
Flow diagram of patient selection process. The diagram illustrates patients with Kawasaki disease admitted between January 2010 and December 2020 (including the exclusion details). The final cohort included 744 patients categorized into high- and low-sodium IVIG groups based on the sodium content of each preparation. IVIG, intravenous immunoglobulin.
Among the 744 patients, 384 (52%) received high-Na IVIG preparations (Glovenin, n=177; Venilon, n=207), whereas 360 (48%) received the low-Na preparation (Venoglobulin), creating 2 groups of nearly equal size. The proportion of administered IVIG preparations varied across the study period (Fig. 2). The low-Na IVIG preparation was predominantly used from 2010 to 2016, whereas high-Na IVIG preparations were used more and more from 2017 onward. In 2020, Venoglobulin was temporarily unavailable due to a manufacturing and supply suspension; therefore, only high-Na preparations were administered.

Annual trends and overall proportions of IVIG preparations. (A) Annual number of patients treated with each IVIG preparation (2010–2020). (B) Overall proportions of IVIG preparations used. IVIG, intravenous immunoglobulin.
Baseline characteristics were generally similar between the 2 groups (Table 1). No significant differences in sex, age at onset, family history, percentage of incomplete Kawasaki disease, or day of illness at diagnosis were observed between the groups. The proportion of patients with a Gunma score ≥5 was significantly higher in the high-Na group than in the low-Na group (37.2% vs. 28.9%, P<0.05).
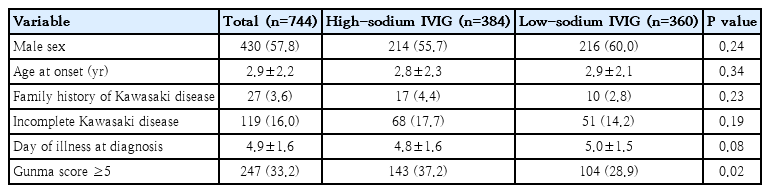
Baseline characteristics of study participants
Changes in serum electrolytes are shown in Table 2. Both groups showed an increase in Na concentration after IVIG administration. Before IVIG administration, the high-Na group had a slightly lower Na concentration than did the low-Na group (133.8±3.0 mEq/L vs. 134.4±2.9 mEq/L, P<0.05); however, after IVIG administration, the inverse was observed (136.6±2.3 mEq/L vs. 136.1±2.6 mEq/L, P<0.05). The increase in serum Na (ΔNa) was significantly greater in the high-Na group than in the low-Na group (2.9±3.2 mEq/L vs. 1.7±2.7 mEq/L, P<0.05). Serum K decreased in both groups, with a greater decrease in the high-Na group than in the low-Na group (ΔK: -0.13±0.50 mEq/L vs. -0.03±0.49 mEq/L, P<0.05).
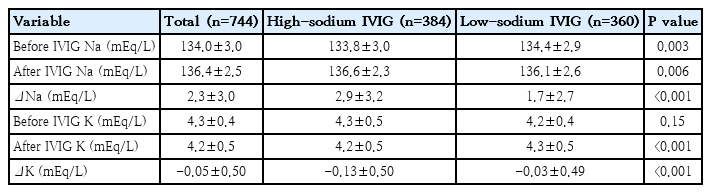
Changes in serum sodium and potassium levels
Incidences of electrolyte abnormalities are summarized in Table 3. After IVIG, hyponatremia (≤130 mEq/L) occurred more frequently in the low-Na group than in the high-Na group (4.4% vs. 0.3%, P<0.05), whereas after IVIG, hypokalemia (≤3.5 mEq/L) was more common in the high-Na group than in the low-Na group (9.9% vs. 5.5%, P<0.05).
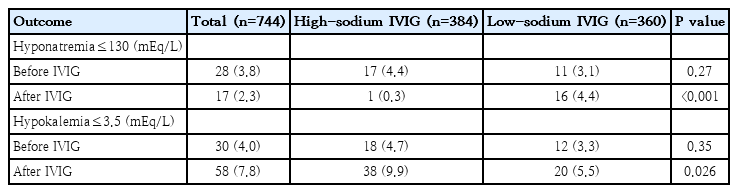
Incidence of electrolyte abnormalities
Changes in serum protein and IgG levels are presented in Table 4. After IVIG, serum TP, IgG, and albumin concentrations were significantly higher in the low-Na group than in the high-Na group. The increase in serum IgG was lower in the high-Na group than in the low-Na group (2,180±370 mg/dL vs. 2,424±390 mg/dL, P<0.05).
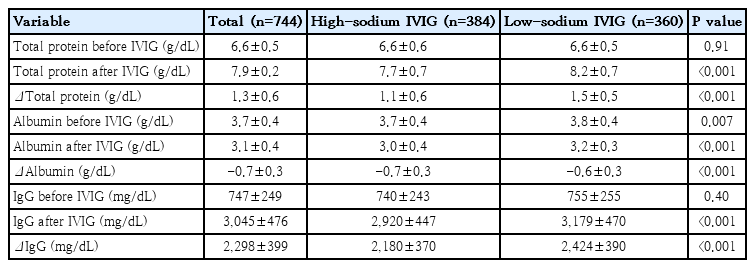
Serum protein, albumin, and IgG level changes
Clinical outcomes did not significantly differ between the 2 groups. Specifically, the proportion of patients requiring additional IVIG (23% vs. 22%, P=0.63), and those with CALs at discharge (1.3% vs. 1.1%, P=0.81) remained similar. Furthermore, no symptomatic electrolyte-related complications, including arrhythmias or seizures, were observed after IVIG administration in either group.
Discussion
This study demonstrated that the Na content of IVIG preparations was associated with distinct patterns of electrolyte and protein concentration changes during the acute phase of Kawasaki disease. In particular, high-Na IVIG preparations induced a greater increase in serum Na and were associated with a higher incidence of posttreatment hypokalemia, whereas the low-Na IVIG preparation was associated with a higher incidence of posttreatment hyponatremia and greater increases in serum TP and IgG levels. Despite these biochemical differabnorences, clinical outcomes, including the need for additional IVIG, and the development of CALs, did not differ significantly between the 2 groups.
Hyponatremia is a well-recognized finding in acute Kawasaki disease and has been attributed to systemic inflammation, nonosmotic vasopressin release, and capillary leakage [2]. Previous studies have suggested that hyponatremia might be correlated with disease severity and IVIG resistance [2,10]. However, those studies did not note variability in electrolyte composition among IVIG preparations, which might influence serum Na dynamics during treatment.
Several retrospective studies have examined the influence of IVIG Na content on electrolyte changes in Kawasaki disease; however, each study provided only a partial view on preparation-related effects. Kaneko et al. [4], who conducted a small retrospective single-center study comparing high-Na IVIG (n=22) with low-Na IVIG (n=23), reported a greater increase in serum Na among recipients of high-Na preparations. Similarly, another single-center retrospective study by Tokuda et al. [6] found a larger increase in serum Na with high-Na IVIG preparations than with low-Na preparations; however, their study had a weak point of pronounced imbalance in group sizes (low-Na [n= 314] vs. high-Na [n=23]), which substantially limited the comparison between groups and restricted interpretation of preparation-related effects.
In contrast to those single-center retrospective studies, Suzuki et al. [5] analyzed 35,586 children with Kawasaki disease using the Japanese Diagnosis Procedure Combination/Per-Diem Payment System (DPC/PDPS) administrative database. Their large-scale investigation found no association between IVIG Na content and clinical outcomes; however, the absence of laboratory data precluded the evaluation of electrolyte changes. Furthermore, given that the DPC/PDPS database lacked in detailed clinical information, including illness severity, fluid balance, and timing of laboratory sampling, the study had inherently limited ability to control potential confounding factors. Thus, although those studies highlighted the potential importance of difference in preparations, none of them had fully addressed electrolyte dynamics or provided a balanced comparison between IVIG preparations.
Unlike those earlier studies, the present study included nearly the same number of patients in each IVIG preparation group, which enabled a more balanced assessment of Na and K dynamics together with clinical outcomes within a single cohort.
The greater reduction in serum K levels observed in the high-Na group may be attributed to increased Na and water delivery to peripheral tissues and consequent extracellular volume expansion [9]. Conversely, the higher frequency of posttreatment hyponatremia in the low-Na group was consistent with the limited Na supplementation during the ongoing inflammatory vasopressin response and capillary leakage in acute Kawasaki disease. Higher IgG levels were observed in the low-Na group after IVIG, which might be attributed to reduced dilutional effect rather than a pharmacokinetic difference between preparations. These protein concentration changes (i.e., greater increases in TP and IgG and a smaller decline in albumin in the low-Na group than in the high-Na group) are consistent with a weaker dilutional effect, whereas high-Na preparations likely promote intravascular volume retention and more pronounced hemodilution.
Despite these biochemical differences, both groups demonstrated comparable short-term clinical outcomes. In the present study, patients with severe electrolyte abnormalities requiring immediate correction or concomitant fluid therapy at the time of IVIG initiation were excluded. Accordingly, no symptomatic complications such as arrhythmias or seizures were observed following IVIG administration. These findings, therefore, primarily reflect mild, nonclinically significant electrolyte disturbances. Differences in the incidence of electrolyte abnormalities based on predefined clinical thresholds indicate that IVIG sodium content may influence clinically relevant biochemical responses. However, these changes were not associated with differences in coronary artery abnormalities or IVIG resistance.
This study has several limitations. As a retrospective single-center study, the selection of the IVIG preparation was left to the discretion of the treating physicians and was influenced by the availability of IVIG preparations, particularly in 2020. Dietary intake, fluid balance, and urinary electrolyte excretion were not systematically assessed, which might limit the accurate evaluation of the findings. Furthermore, the distribution of Gunma scores differed between the groups, suggesting potential differences in baseline disease severity. IVIG preparations differ in multiple formulation characteristics besides sodium content, which may contribute to the observed biochemical changes. Although the study period spanned a decade, diagnostic and therapeutic guidelines for Kawasaki disease in Japan remained largely consistent, as major guideline revisions were not introduced until late 2020 [3]. Nevertheless, the potential impact of temporal changes in clinical practice could not be entirely excluded.
However, several strengths should also be noted. First, the high- and low-Na IVIG groups were nearly equal in size, allowing a well-balanced comparison with reduced allocation bias, which prior studies failed to achieve. Second, all patients were treated under a uniform institutional protocol for IVIG administration and timing of tests, thereby minimizing practice-related variability. Third, unlike earlier reports that focused primarily on serum Na alone, this investigation evaluated both Na and K dynamics, providing a more complete understanding of electrolyte responses to IVIG therapy. To the best of our knowledge, this study is the first to compare IVIG preparations with balanced group sizes under a unified protocol, while simultaneously evaluating Na and K dynamics, thereby providing more reliable insights into preparation-specific effects on electrolytes.
In conclusion, the Na content of IVIG preparations was associated with distinct patterns of electrolyte changes in patients with acute Kawasaki disease. High-Na IVIG was associated with greater increases in serum Na and a higher incidence of hypokalemia, whereas low-Na IVIG was associated with greater increases in protein and IgG concentrations and a higher incidence of posttreatment hyponatremia. These biochemical differences did not translate into differences in short-term clinical outcomes. Nonetheless, awareness of preparation-specific electrolyte changes may assist in the interpretation of laboratory changes during IVIG therapy.
Notes
Funding
This study received no specific grant from any funding agency in the public, commercial, or not-for-profit sectors.
Acknowledgments
The authors declare that generative artificial intelligence (AI) and AI-assisted technologies were used in the preparation of this manuscript for tasks such as language refinement and grammar correction. After using these tools, the authors reviewed and edited the content as necessary and take full responsibility for the accuracy and integrity of the manuscript.
Author contribution
Conceptualization: YW, TK, HI; Data curation: YW, NY, TH, CO, SE, MY; Formal analysis: YW; Methodology: YW; Project administration: YW, HI; Visualization: YW; Writing - original draft: YW; Writing - review & editing: NY, TH, CO, SE, MY, TK, HI