Blood culture contamination in hospitalized pediatric patients: a single institution experience
Article information
Abstract
Purpose
Blood culture is the most important tool for detecting bacteremia in children with fever. However, blood culture contamination rates range from 0.6% to 6.0% in adults; rates for young children have been considered higher than these, although data are limited, especially in Korea. This study determined the contamination rate and risk factors in pediatric patients visiting the emergency room (ER) or being admitted to the ward.
Methods
We conducted a retrospective chart review of blood cultures obtained from children who visited Yonsei Severance Hospital, Korea between 2006 and 2010. Positive blood cultures were labeled as true bacteremia or contamination according to Centers for Disease Control and Prevention/National Healthcare Safety Network definitions for laboratory-confirmed bloodstream infection, after exclusion of cultures drawn from preexisting central lines only.
Results
Among 40,542 blood cultures, 610 were positive, of which 479 were contaminations and 131 were true bacteremia (overall contamination rate, 1.18%). The contamination rate in the ER was significantly higher than in the ward (1.32% vs. 0.66%, P<0.001). The rate was higher in younger children (2.07%, 0.94%, and 0.61% in children aged <1 year, 1-6 years, and >6 years, respectively).
Conclusion
Overall, contamination rates were higher in younger children than in older children, given the difficulty of performing blood sampling in younger children. The contamination rates from the ER were higher than those from the ward, not accounted for only by overcrowding and lack of experience among personnel collecting samples. Further study to investigate other factors affecting contamination should be required.
Introduction
Fever is a primary complaint in up to 20% of children visiting the emergency room (ER), and bacteremia is an important cause of fever in 1.5%-2.3% of these children1). Blood culture is the most sensitive method for the detection of bacteremia and fungemia. However, false-positive blood culture results occur when a contaminant organism that is not present in the patient's bloodstream is grown in a blood culture specimen, and present clinical and financial consequences for clinicians, patients, families, and hospitals2). Contamination may occur even when precise techniques for sample collection and processing are used. It is challenging to differentiate a true bloodstream infection from contamination. Clinicians may use clues and indicators when interpreting positive blood culture results, such as the species of organism detected, number of positive culture sets, time to growth, the patient's clinical manifestations and laboratory abnormalities (including leucopenia/leukocytosis and elevated inflammatory markers), and the presence of an indwelling central catheter3,4).
In general, target rates for contamination are set at a maximum of 2% to 3% in adults; however, reported rates vary widely between institutions, from 0.6% to over 6%2,3). In febrile children, especially those younger than 3 years, blood cultures are predominantly obtained because of concerns over the risk of occult bacteremia, and hence culture contamination seems to be more frequently1). However, recent studies have shown that the risk of occult bacteremia has declined significantly since the introduction of influenza and pneumococcal vaccinations, and therefore the positive predictive values of blood cultures are lower than they were3).
Few studies of contamination rates in blood cultures of pediatric populations have been reported, and studies are especially rare for children in Korea. Given the high risk of occult bacteremia in children and the increasing rates of blood collection for culture, it is important to determine the current state of blood culture contamination in children. This study was performed to determine the blood culture contamination rate and to identify risk factors associated with contamination in children visiting the ER or being admitted to a ward.
Materials and methods
1. Study site and period
The study took place at the Severance Children's Hospital, Yonsei University College of Medicine, in Seoul, South Korea. This institution is a tertiary-care center and teaching hospital, and has a pediatric referral center. Electronic medical records were retrospectively reviewed for blood culture results obtained from patients aged ≤18 years over a 5-year period from January 1, 2006 through December 31, 2010.
2. Blood sample collection
Blood samples were drawn by resident pediatric physicians or dedicated phlebotomists. Skin was disinfected for 20 to 30 seconds, and allowed to dry before blood cultures were taken. Until 2009, sterile cotton balls soaked with povidone iodine (Betadine, Mundipharma, Seoul, Korea) or 2% chlorhexidine gluconate/70% isopropyl alcohol solution (Hexitanol, Seonkwang Medical, Cheonahn, Korea) were used. The way of skin disinfection was changed gradually in 2009 and 2010; with introduction of 70% isopropyl alcohol swabs or wipe (isopropyl alcohol swab, Q and Q, Yeongi, Korea). Samples were subsequently inoculated into blood culture bottles; the same types of bottles have been used since 2006 at the Severance Children's Hospital. Blood specimens were collected into bacterial culture media (BacT/ALERT FA and FN, BioMérieus, Durham, NC, USA) and incubated at 37℃ for 5 days. In positive blood cultures, microorganisms were identified by automated detection methods in the clinical microbiology laboratory.
3. Classification of blood culture
In the current study, blood culture isolates obtained only from preexisting central venous catheters were excluded, owing to the difficulty in differentiating between colonization, contamination, and true bloodstream infection, as those have high possibility of colonization, when positive for any organism. The remaining blood culture results were divided into true bacteremia and contamination, on the basis of the Centers for Disease Control and Prevention (CDC)/National Healthcare Safety Network definition for laboratory-confirmed bloodstream infection, in combination with the clinical manifestations, such as fever, leukocytosis or leukopenia, and elevated acute-phase reactants. The CDC definition of laboratory confirmed bloodstream infection (not central line related) is either 1 positive blood culture with a recognized pathogen from a venipuncture, or (for skin organisms) more than 2 blood cultures drawn on separate occasions positive for the same organism plus clinical symptoms, such as fever (>38℃), chills, or hypotension if older than 1 year, and fever (>38℃ core), hypothermia (<36℃ core), apnea, or bradycardia if less than or equal to 1 year; if possible, cultures should be obtained before starting antimicrobial therapy. The term "recognized pathogen" does not include organisms considered common commensals. A few of the recognized pathogens are Staphylococcus aureus, Enterococcus spp., Escherichia coli, Pseudomonas spp., Klebsiella spp., Candida spp., etc. There is a complete list of common commensal organism. "Two or more blood cultures drawn on separate occasions" means that blood from at least two blood draws were collected within two calendar days of each other5). According to the College of American Pathologists, the definition of contamination is a positive blood culture with the presence of one or more of the following organisms in only one of a series of blood culture specimens: coagulase-negative Staphylococcus, Micrococcus, alpha-hemolytic (viridans) streptococci, Propionibacterium acnes, Corynebacterium sp. or Bacillus spp6,7,8,9). The contamination rate was defined as the percentage of contaminated culture isolates in total blood culture isolates collected in each group.
4. Data collection and study design
Retrospective chart audits were conducted on all blood cultures obtained from patients aged 0 to 18 years upon arrival at the pediatric ER or at the time of admission to the pediatric general ward or neonatal unit. Patients with indwelling central venous catheters at the time of blood culture collection were excluded.
Firstly, contamination rates in different hospital locations (ER, ward, or neonatal unit) were compared, according to patient age, clinical manifestations, the degree of crowdedness, and the practitioner who drew the blood. The study by Pavlovsky et al.10) showed that young age is correlated with increased blood culture contamination rates, independent of the experience of the collector and therefore we compared the contamination rates between 3 age groups, as follows: group 1 (age less than 1 year), group 2 (age between 1 and 6 years), and group 3 (age between 7 and 18 years). Throughout the study period, all blood samples were taken by trained phlebotomists in wards and by nurses in the neonatal unit. However, in the ER, blood samples were obtained by first-year pediatric residents until February 2007, and only by residents for children aged less than 1 year and by nurses for children of other ages from March 2007 to February 2008. Subsequently, all samples were obtained by nurses. Hence, 5 groups were categorized according to time period, as follows: group A, January 1, 2006 to February 28, 2007; group B, March 1, 2007 to February 29, 2008; group C, March 1, 2008 to February 28, 2009; group D, March 1, 2009 to February 28, 2010; and group E, March 1, 2010 to December 31, 2010. Finally, the contamination rates were compared by hospital location between each age and year group.
5. Statistical analysis
Data analyses were performed with IBM SPSS ver. 19.0 (IBM Co., Armonk, NY, USA). P values <0.05 were considered statistically significant. Continuous variables were expressed as the mean±standard deviation and compared by the Student t test. Categorical variables were expressed as the numbers and percentages, and were compared by the χ2 or Fisher exact test. For trend analysis of stratified categorical variables, Cochran-Mantel-Haenszel test (χ2 for trend) was used. The correlation between 2 continuous variables was analyzed by the Pearson correlation.
Results
1. Patient characteristics
From a total of 59,490 blood samples taken for culture during the study period (January 2006 to December 2010), 40,542 blood culture isolates were eligible for the present study. Further, 722 isolates (representing 1.78% of the total blood cultures collected) were positive for bacterial growth, and 112 positive blood cultures that were drawn only via preexisting central venous catheters were excluded, because of difficulty in the interpretation of results. The remaining 610 positive blood cultures were from samples drawn from a peripheral intravenous line or from both a peripheral intravenous line and a central venous catheter, and were classified as 479 cases of contamination (78.5% of total positive blood cultures) and 131 cases of true bacteremia (21.5% of total positive blood cultures). Their distribution by location and study flow are shown in Fig. 1.

Study flow diagram.
The mean age of patients who had blood samples taken for culture was 3.1 years, and the mean age of patients who had contamination was 1.9 years. In the contamination group, there was no statistically significant difference in mean age between those whose blood samples were taken in the ER and those whose samples were taken in the ward. The mean age of patients with true bacteremia was 3.7 years; this was older than the mean age of patients in the contamination group. In the ER, patients with true bacteremia were significantly older than those with contamination. Generally, the gender ratio of those with contamination was similar to that of those with true bacteremia. There was no statistically significant difference in gender ratio in either the contamination group or the true bacteremia group between those whose samples were taken in the ER and those whose samples were taken in the ward (Table 1). The contamination rate was 1.18% for the male and female subjects (276 of 23,250 cultures in male subjects and 203 of 17,292 cultures in female subjects). The contamination rates according to location for the male and female subjects were similar: rates were 1.30% in male subjects and 1.34% in female subjects in the ER, 0.74% in male subjects and 0.56% in female subjects in the ward, and 0.92% in both male and female subjects in the neonatal unit.
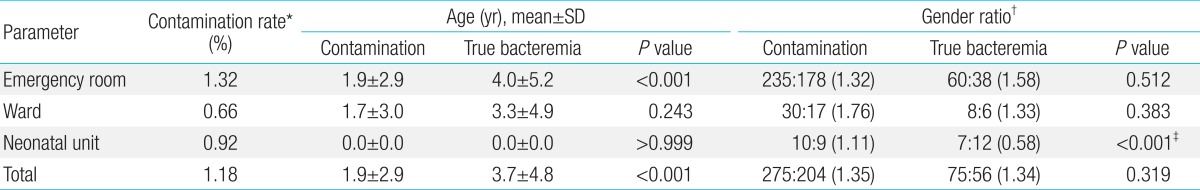
Demographic data of children whose blood cultures were obtained
2. Blood culture contamination rates
The overall contamination rate was 1.18% (479 of 40,542 cultures). The contamination rate was 1.32% (413 of 31,401 cultures) in the ER, 0.66% (47 of 7,080 cultures) in the ward and 0.92% (19 of 2,061 cultures) in the neonatal unit (which included the neonatal intensive care unit and the newborn nursery) (Table 1). The contamination rates differed significantly by location (P<0.05).
The contamination rates in the different age groups were 2.07% (221 of 10,663 cultures) in group 1 (age less than 1 year), 0.94% (220 of 23,487 cultures) in group 2 (age between 1 and 6 years), and 0.61% (38 of 6,392 cultures) in group 3 (age between 7 and 18 years). Contamination rates differed significantly according to age group (P<0.001). In both the ER and ward, the contamination rates in group 1 (<1 year) were significantly higher than those in the other two older age groups (both P<0.001 and P for trend <0.001) (Table 2).
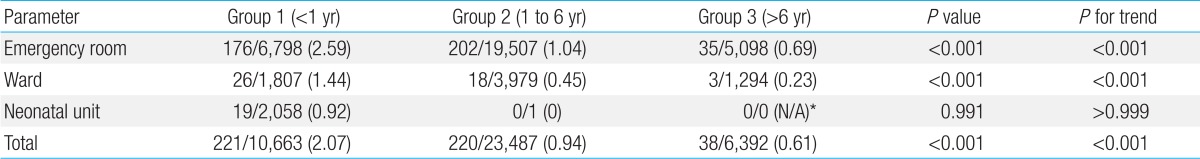
Contamination rates in different age groups
The contamination rates in the different year groups, for all 3 locations, were 1.23% (100 of 8,153 cultures) in group A (January 1, 2006 to February 28, 2007), 1.02% (77 of 7,533 cultures) in group B (March 1, 2007 to February 29, 2008), 1.29% (116 of 8,973 cultures) in group C (March 1, 2008 to February 28, 2009), 1.14% (99 of 8669 cultures) in group D (March 1, 2009 to February 28, 2010), and 1.18% (87 of 7,209 cultures) in group E (March 1, 2010 to December 31, 2010). These differences were not statistically significant (P=0.319). In the ER, the lowest contamination rate was observed in group B at 1.08% (62 of 5,767 cultures); this was significantly lower than the rates in 2 other year groups (1.27%, 81 of 6,354 cultures in group A and 1.55%, 105 of 6,785 cultures in group C) (P=0.047). However, if analyzed differently with three year groups (i.e., January 2006 to February 2007, March 2007 to February 2008, and March 2008 to December 2010) on the basis of change in the performers of blood culture, there was no significant difference in contamination rates among them (P for trend=0.243, not shown in the table). There were no statistically significant differences in contamination rates between groups in the ward and the neonatal unit. In the neonatal unit, there were statistically significant differences in contamination rates between groups B and C, groups C and D, and groups D and E. However, because of a small number of patients, data from the neonatal unit had low statistical power, which limited the specificity of the analysis compared to the ER and ward (Table 3).
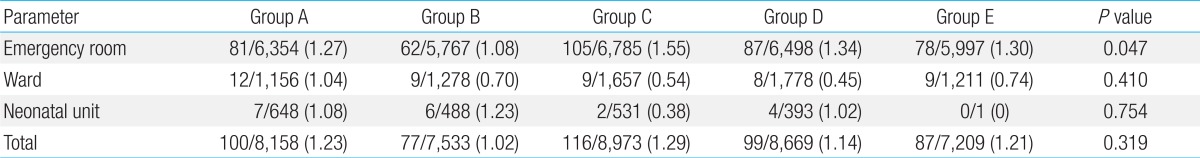
Yearly distribution of contamination
The monthly contamination rate is shown in Table 4; statistically significant differences in contamination rates were observed between months (P for trend=0.004). The highest contamination rates were seen in August (1.86%, 56 of 3,010 isolates) and November (1.59%, 59 of 3,702 isolates), and the lowest rate was seen in February (0.64%, 17 of 2,658 isolates). In the ER, the contaminations rates were highest in August (2.2%, 48 of 2,180 isolates) and July (1.90%, 46 of 2,420 isolates), and lowest in February (0.64%, 13 of 2,789); there was significant difference in contamination rates between month (P for trend=0.003). In the ward, the contamination rates were highest in June (1.23%, 10 of 655 isolates) and January (1.19%, 5 of 421 isolates), and lowest in April (0.17%, 1 of 579). There was no statistical significant difference in contamination rates among months in both ward and neonatal unit (P for trend=0.587 and 0.137, respectively) (Table 4). Comparing total number of blood culture sets and contamination rates by month, there seems no definite association between them, which may mean the crowdedness is less likely to be related to contamination (Fig. 2).
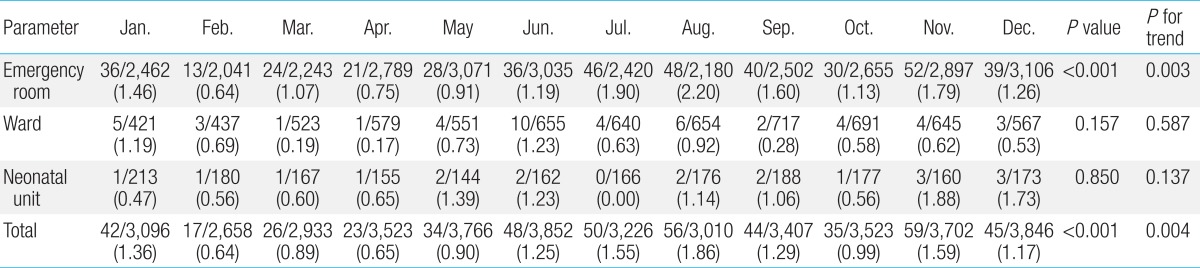
Monthly distribution of contamination

Monthly distribution of contamination. Y-axis on the left is total number of blood culture isolates in each month. Y-axis on the right is contamination rate (%) which is the percentage of contaminated isolates in total blood cultures.
3. Microorganisms of contamination or true bacteremia
The most frequently isolated microorganisms in the contamination group were Staphylococcus epidermidis (37%), coagulasenegative staphylococci (CoNS) (21%), Micrococcus spp. (12%), Bacillus spp. (8%), Diphtheroids (5%), Streptococcus sanguis (3%), Streptococcus oralis (3%), and Streptococcus salivarius (2%). When S. epidermidis was included among CoNS, these pathogens accounted for 58% of all contaminants. The most common microorganisms in true bacteremia were S. aureus (23%), E. coli (12%), Streptococcus pneumonia (11%), Klebsiella pneumonia ss. Pneumonia (6%), Group B streptococci (5%), Enterococcus faecium (5%), Nontyphoidal Salmonella serogroup c (4%), S. epidermidis (4%), Acinetobacter iwoffii (2%), Enterobacter aerogenes (2%), Enterobacter cloacae (2%), and Streptococcus intermedius (2%). S. epidermidis and CoNS were the organisms most commonly grown in blood cultures, but only 2.8% of S. contaepidermidis (5 of 184 isolates) and 1% of CoNS (1 of 101 isolates) represented true bacteremia. Similar to previous reports, we found very few Micrococcus spp., Bacillus spp., and Diphtheroids represented among cases of true bloodstream infection. Most S. aureus, E. coli, S. pneumonia, K. pneumoniae, enterococci, Enterobacter spp., and Acinetobacter spp. represented true bacteremia.
Discussion
Although current blood culture tests have high sensitivity, specificity is low due to contamination. Difficulty in discriminating between contamination and true bacteremia leads to increased duration of hospital stay, unnecessary additional laboratory tests, and inappropriate use of antibiotics; the latter may cause the emergence of multidrug resistant organisms, antibiotic-associated diarrhea, or other adverse outcomes8).
Two College of American Pathologists' studies have set blood culture contamination rates at 2.5% and 2.93%, respectively9). The American Society of Microbiologists recommends a target rate of 3% for blood culture contamination in adults11,12). In the current study, 479 isolates were positive from among a total of 40,542 culture samples taken from a pediatric population in a single institution, and the contamination rate was 1.18%; this rate is lower than the adult standard of 3%, and much lower than expected.
Contamination may be caused by taking the sample from an inappropriate sample site, an interruption in skin antisepsis due to complex patient factors, poor compliance, the urgency with which intravascular access may be obtained, and inappropriate blood sampling technique. In the present study, the skin was disinfected using different antiseptics, but 70% isopropyl alcohol, mainly since 2009, which is proven to reduce blood culture contamination rates13). Due to problems with compliance, pain, the difficulty of venipuncture, and the desire to prevent needle-stick injury in pediatric patients, blood culture specimens are often obtained simultaneously with intravenous catheter insertion, rather than being obtained via separate venipuncture. The contamination rate of culture specimens drawn via venipuncture from a separate site has been shown to be significantly lower than the rate obtained via a newly inserted intravenous catheter in children with suspected bacteremia1,14,15). However, other studies have shown no significant difference in contamination rates between catheter- and venipuncture-drawn blood cultures. In this study, comparison analysis of contamination rates of those two groups was not conducted, which is limitation of the current study.
Younger pediatric patients are more likely to receive medical attention and be admitted to a hospital. Our study results are in line with those of previous studies10): the contamination rate in the younger age group (group 1, age less than 1 year) was significantly higher than the rates in the 2 older age groups. The youngest age group also had a higher contamination rate in the ER as well as in the ward. The contamination rate in the neonatal unit was lower than the overall rate, and although the mean age was youngest, sampling was easier than that in age group 1, excluding the neonatal unit. Patient compliance as well as age affects contamination rate.
It is difficult to prevent contamination in the ER because of the rapid turnover of patients, problems with overcrowding, inadequate inpatient capacity, and a lack of ongoing training16). The contamination rate has been reported to be around 9% to 11% in pediatric ERs17). Similarly, the contamination rate in the ER in our study was significantly higher than that in the ward or neonatal unit. Regardless of age, the contamination rates in the ER in each group were higher than those in the ward or neonatal unit. In the monthly assessment, based on trend analysis, there was no obvious tendency towards higher contamination rates in months when more patients are seen and overcrowding is greatest. Factors other than overcrowding play a role in blood culture contamination and need to be investigated.
Because of changes in the personnel who collected blood samples in the ER during the study period, contamination rates were assessed according to 5 different year groups. In the ward, there were no statistically significant differences in contamination rates between the different year groups, since there was no change in the personnel who collected blood samples. Accurate analysis was not possible for the neonatal unit because of low statistical power. In the ER, the contamination rate decreased in March 2007 (when nurses began to draw blood culture samples). Thereafter, the contamination rate increased when all cultures started to be collected by nurses (March 2008). The contamination rate subsequently did not decrease and was not less than the overall contamination rate of 1.18%. Insufficient training, in terms of duration and quality, could account for the fact that the contamination rate did not decrease further when all samples began to be taken by nurses. Training of nurses would not be as enough as in well-trained phlebotomy team performing blood culture in ward in our institution. Hall et al.18) have reported that fewer years of experience of the individual performing the procedure are correlated with a higher contamination rate. Harris et al.19) showed that when blood samples are taken by highly skilled and well trained neonatal nurses, blood culture contamination rates can be lower than when the samples are taken by phlebotomists, possibly because their skills are more homogenous and individual variances are limited. In our study, the contamination rate in the neonatal unit (0.92%) was lower than the overall contamination rate of 1.18%, although the statistical power was low owing to a small population size. Therefore, the quality and the duration of training are important factors to consider for decreasing contamination rates. After implementing an educational intervention in skin preparation, blood volume, and culture procedures, blood culture contamination rates were reduced significantly in Robert's study in 201120). Youssef et al.21) observed each individual's blood sampling technique and provided real-time feedback; they found that the intervention reduced the rates of contamination. Consistent training, appropriate feedback, and postfeedback observations appear to be helpful in reducing rates of contamination.
Schifman et al.8) recommended blood culture collection by a dedicated phlebotomy team, as it was the most effective method for reducing culture contamination in their study. Subsequent studies have shown similar success with specialized phlebotomy teams22). In our study, contamination rates in the ward were lower than those in the ER, both overall and in each age and year group. This result could be due to the fact that trained phlebotomists collected blood culture samples in the ward throughout the study period.
In one study, blood culture contamination rates were reduced when a single protocol for blood sample drawing was followed by all collectors of blood cultures (nurses, phlebotomists, and resident physicians); the protocol included rules for skin antisepsis, sterile technique, contact time, number of culture bottles (minimum 2 sets of cultures were recommended), needle change, sample collection (such as the appropriate filling of culture bottles), and the order of inoculation from aerobic to anaerobic bottles23). If a single hospital protocol for blood culture sampling is established and followed by all collectors in all units of the hospital (ER, ward, neonatal unit), contamination rates would be reduced.
In conclusion, a younger patient age and insufficient duration for training or quality of blood sample collectors were associated with blood culture contamination in our study. Overcrowding has been considered as an important factor affecting contamination, especially in the ER, however there was no certain association between overcrowding and contamination in the ER, in the current study. To decrease contamination rates, appropriate training of personnel who take blood samples and hospital protocols for sample drawing should be provided. Further study to investigate other factors affecting contamination should be required.
Acknowledgments
We would like to thank the staff at the Severance Children's Hospital, Yonsei University College of Medicine, for their assistance and effort.
Notes
No potential conflict of interest relevant to this article was reported.