The relationships of body mass index, waist-to-height ratio, and body fat percentage with blood pressure and its hemodynamic determinants in Korean adolescents: a school-based study
Article information
Abstract
Purpose
Obesity is an important risk factor for hypertension in adolescents. We investigated the relationship of obesity-related indices (body mass index [BMI], waist-to-height ratio [WHR], and body fat percentage [%BF]) with blood pressure and the hemodynamic determinants of blood pressure in Korean adolescents.
Methods
In 2008, 565 adolescents, aged 12-16 years, were examined. The %BF of the participants was measured by bioelectrical impedance analysis. Echocardiography and brachial artery pulse tracing were used to estimate the stroke volume (SV), cardiac output (CO), total vascular resistance (TVR), and total arterial compliance (TAC).
Results
We noted that BMI, WHR, and %BF were positively correlated with systolic blood pressure (SBP) and diastolic blood pressure (DBP). The positive correlation between BMI and blood pressure (SBP and DBP) persisted after adjustment for WHR and %BF. However, after adjustment for BMI, the positive associations between blood pressure (SBP and DBP) and WHR as well as %BF, were not noted. With regard to the hemodynamic factors, BMI, but not WHR and %BF, was an independent positive factor correlated with SV and CO. TVR had an independent negative association with BMI; however, it was not associated with WHR or %BF. Moreover, we noted that BMI, WHR, and %BF did not affect TAC.
Conclusion
In Korean adolescents, BMI had an independent positive correlation with SBP and DBP, possibly because of its effects on SV, CO, and TVR. WHR and %BF are believed to indirectly affect SBP and DBP through changes in BMI.
Introduction
The increase in the prevalence of cardiovascular disease (CVD) is a global health concern because CVD has become an important cause of morbidity and mortality worldwide1). CVD usually has a long, asymptomatic course that progress until irreversible health problems occur. There is growing interest in the prevention of CVD, and CVD can be prevented by controlling the CVD risk factors at an early stage2).
Obesity and hypertension are important risk factors for CVD3). Previous studies reported that obesity is closely associated with elevated blood pressure (BP) in children and adolescents, as well as in adults4,5). Persistent childhood hypertension increases the risk for hypertension, CVD, and early death in adulthood6). Studies that enrolled obese adolescents showed that weight loss could improve hypertension and other CVD risk factors, including dyslipidemia and insulin resistance7,8). Therefore, the screening and management of obesity and hypertension in young people are important early steps for the prevention of CVD9).
Body mass index (BMI), waist circumference (WC)-related indices, and body fat percentage (%BF) are commonly used indices for the assessment of obesity. Numerous community-based studies have reported positive relationships between these obesity-related indices and BP, both in adults and children4,10-16). However, information regarding the independent contribution of these obesity indices to BP is scarce.
The present study analyzed the individual correlations of obesity-related indices including BMI, waist-to-height ratio (WHR), and %BF with BP in Korean adolescents, using various adjustment models. In addition, we examined the associations between obesity-related indices (BMI, WHR, and %BF) and hemodynamic determinants of BP, including blood flow parameters (stroke volume [SV] and cardiac output [CO]) and vascular impedance parameters (total arterial compliance [TAC] and total vascular resistance [TVR]) in an effort to better understand how BMI, WHR, and %BF affect BP.
Materials and methods
1. Subjects
In 2008, a school-based cross-sectional study was conducted in Seoul, Korea. The study enrolled 565 adolescents (336 boys and 229 girls) aged 12-16 years from a selected school. Written informed consent was obtained from all participants and their guardians. This study was approved by the Institutional Review Board of Ewha Womans University School of Medicine and conducted in accordance with the Declaration of Helsinki.
2. Anthropometry and BP
Body weight was measured using calibrated, electronic scales with participants wearing only underwear. Height was measured with a stadiometer and for this, participants stood with their heels, buttocks, shoulders, and head touching a vertical bar. WC was measured at the level of the iliac crest when participants were standing upright and had minimal respiration. BMI was calculated as weight (kg)/height (m2), and %BF was estimated by bioelectric impedance analysis (BIA; InBody 720, Biospace Co., Seoul, Korea) using the equation of the BIA software. The gender- and age-specific percentile cutoffs for BMI, WC, and %BF were determined using Korea Centers for Disease Control and Prevention reference data17). We defined the 85th percentile for BMI as the cutoff for "high BMI," the 90th percentile for WC as the cutoff for "high WC," and the 90th percentile for %BF as the cutoff for "high %BF."
Two trained individuals conducted BP measurements. For these measurements, participants were asked to lie down in a supine position, and after 10 minutes of quiet rest, an automatic oscillometric method was used to obtain both systolic and diastolic blood pressures (SBP and DBP; Dinamap Procare-200, GE Healthcare, Milwaukee, WI, USA). The gender-, age-, and height-specific percentile cutoffs for BP were determined by Korea Centers for Disease Control and Prevention reference tables18). The 90th percentile for SBP and DBP were defined as "high SBP" and "high DBP," respectively.
3. Biochemical parameters
Fasting blood samples were obtained from the antecubital vein after an overnight fast of at least 8 hours. We measured fasting plasma concentrations of glucose, C-reactive protein (CRP), total cholesterol, low-density lipoprotein-cholesterol, triglycerides, and high-density lipoprotein-cholesterol.
4. Hemodynamic factors
Echocardiographic studies were performed using phased-array echocardiographs with M-mode, 2D, as well as pulsed and colorflow Doppler capacities (Acuson Sequoia-C 512; Siemens AG, Medical Solutions, Forchheim, Germany). Echocardiography images were obtained with participants lying in the left partial decubitus position. The diameter of the aortic annulus was measured in the parasternal long-axis view. Doppler transaortic flow was assessed at the center of the aortic annulus in the apical long-axis or five-chamber view. In each case, a representative value was obtained from the average of 3 measurements. Heart rate (HR) was measured with electrocardiographic monitoring during echocardiographic evaluation.
SV was calculated as the aortic annular cross-sectional area × the aortic time-velocity integral.
CO was calculated as SV×HR.
The brachial artery pulse tracing and mean arterial pressure (MAP) were obtained automatically using a volume-plethysmographic apparatus (PWV/ABI, Colin Co., Komaki, Japan). The participants were examined while in the supine position after a rest of at least 5 minutes and with electro-cardiogram electrodes placed on both wrists and cuffs, wrapped around the brachia. The sample time was 10 seconds, and automatic gain analysis and quality adjustment were performed; the pressure waveforms and MAP for the brachial artery were also recorded. This test and the echocardiographic measurements were performed at the same time.
Total peripheral resistance (TPR) was calculated as MAP × 60/CO.
TAC was estimated by analyzing the brachial artery pressure waveform and using the area method based on Windkessel's two-element model19). The equation is expressed as: TAC=Ad/(TPR × [Pes-Pd]) where Ad is the area under the diastolic portion of the brachial artery pressure wave, Pes is the end systolic pressure, and Pd is the diastolic pressure.
5. Statistical analysis
Data are presented as mean±standard deviation. The partial correlations between obesity-related indices (BMI, WHR, and %BF), and BP (SBP and DBP) and its hemodynamic determinants (SV, CO, TPR, and TAC) were analyzed. Multivariate logistic regression analysis was used to estimate the adjusted odds ratios with 95% confidence intervals between high BP (high SBP and high DBP) and the status of obesity-related indices (high BMI, high WHR, and high %BF). We used various sets of adjustments, both in partial correlation analysis and multivariate logistic analysis: M1 represented the adjustment for age and height; M2 indicated the adjustment for lipid panel, glucose, and CRP in addition to M1; M3 denoted the adjustment for WHR and %BF in addition to M2; and M4 was the adjustment for BMI in addition to M2. Two-tailed P values <0.05 were considered statistically significant.
Results
1. Characteristics of subjects
The characteristics of the subjects are presented in Table 1. A total of 565 adolescents, aged 12-16 years were studied (336 boys and 229 girls). Height, weight, BMI, WC, and WHR were higher in boys than in girls, while total body fat and %BF were higher in girls than in boys. SBP and DBP of boys were higher than those of girls. The mean SBP was 116.57 mmHg and 109.21 mmHg for boys and girls, respectively (P =0.049). The mean DBP of boys and girls were 71.87 mmHg and 70.83 mmHg, respectively (P =0.044). Triglyceride levels were higher in boys than in girls (P <0.001). There were no statistically differences for the total cholesterol, high-density cholesterol-cholesterol, high-density cholesterol-cholesterol, glucose, and CRP levels between boys and girls. SV and CO were higher in boys than in girls, while TAC was higher in girls than in boys (P=0.003, P=0.086, and P=0.002 for differences between SV, CO, and TAC, respectively). There was no significant difference in TVR between boys and girls.
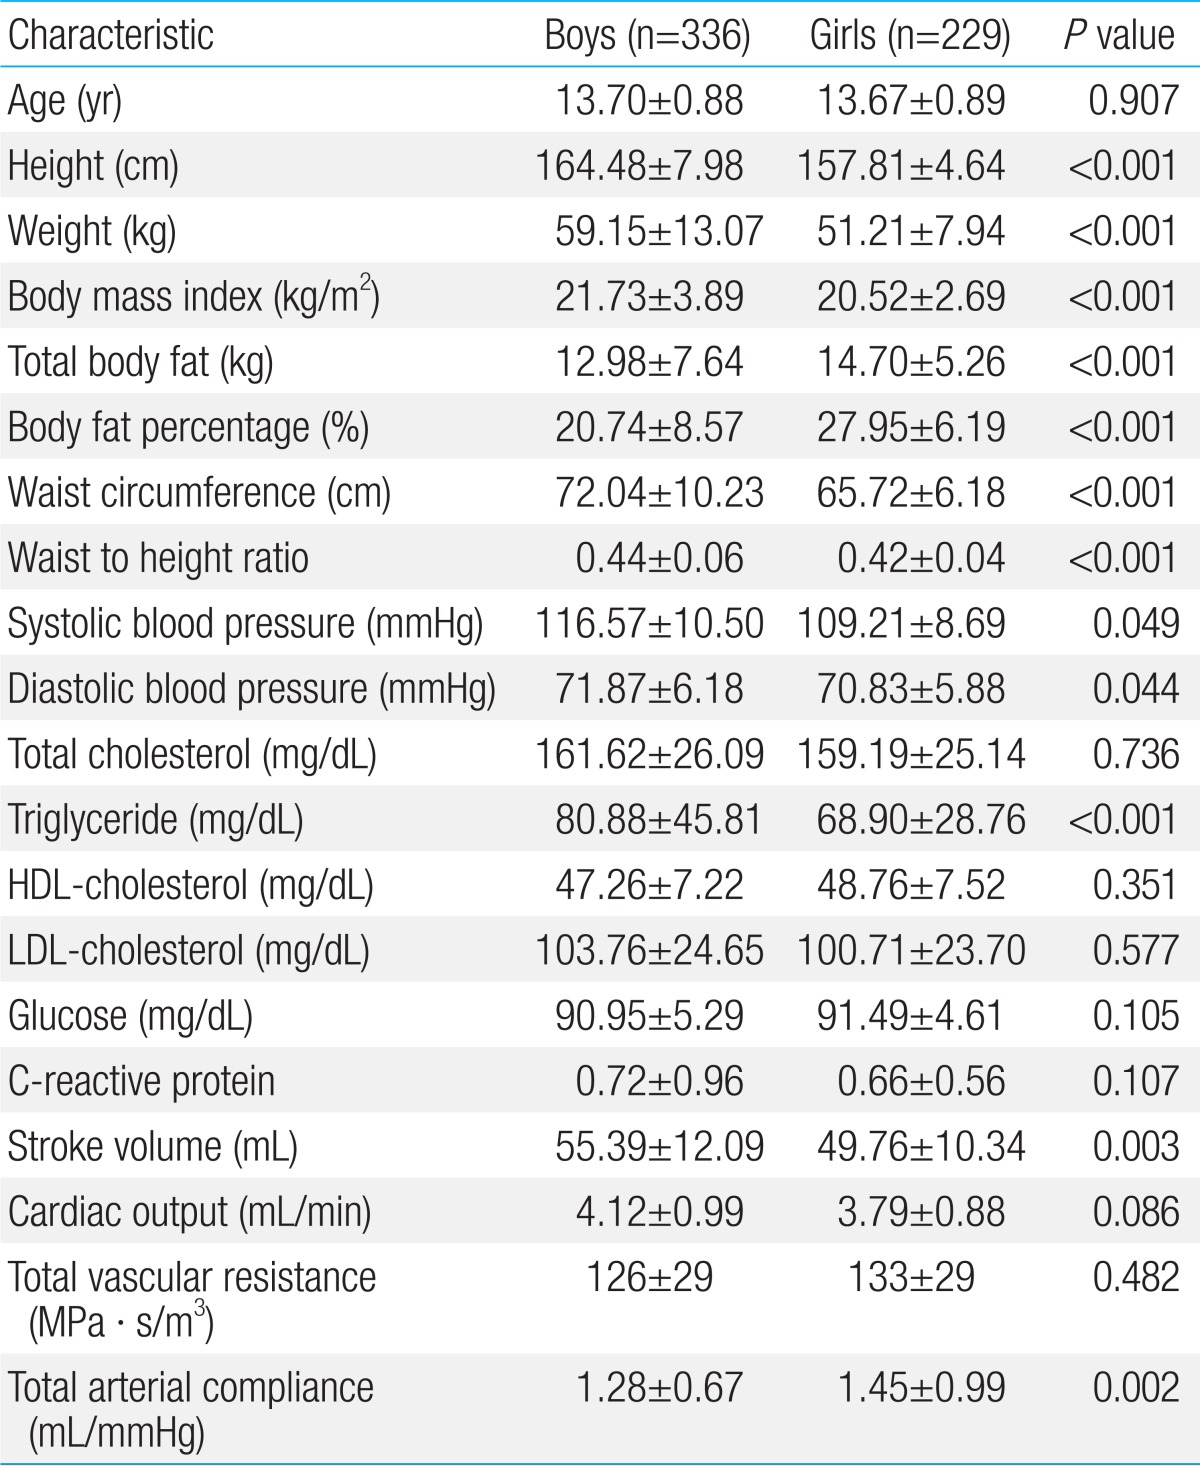
Characteristics of the study participants
2. Correlations of obesity-related indices with SBP and DBP
Table 2 presents the multivariate correlation between obesity-related indices (BMI, WHR, and %BF) and BP (SBP and DBP) in boys and girls. When adjusted for age and height (M1), BMI was closely associated with SBP and DBP in both genders. After additional adjustment for lipid panel, glucose, and CRP levels (M2), BMI was still positively correlated with SBP and DBP in both genders. With additional adjustment for WHR and %BF (M3), BMI maintained these positive correlations with SBP and DBP.
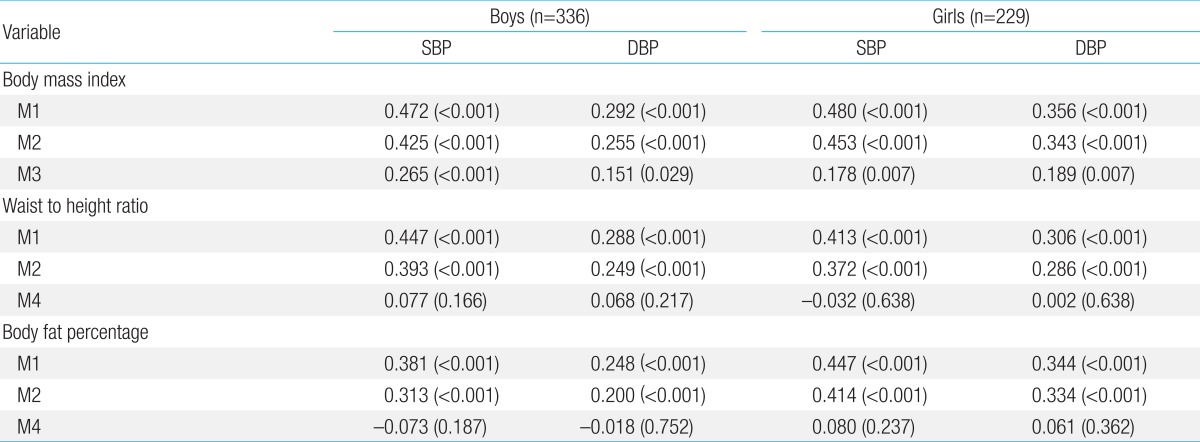
Correlation of obesity-related indices with blood pressure
After adjustment for age and height (M1), WHR was positively correlated with SBP and DBP in both genders. After further adjustment for lipid panel, glucose level, and CRP level (M2), the positive correlations between WHR and SBP and DBP persisted. However, after additional adjustment for BMI (M4), the associations between WHR and SBP as well as DBP were lost in both boys and girls.
After adjustment for age and height (M1), %BF showed positive correlations with SBP and DBP in both genders. After additional adjustment for lipid panel, glucose level, and CRP level (M2), %BF was still positively correlated with SBP and DBP in both genders. However, after further adjustment for BMI (M3), the associations of %BF with SBP and DBP were lost in both boys and girls.
Taken together, BMI had an independent positive correlation with SBP and DBP, whereas WHR and %BF seemed to be indirectly related to SBP and DBP, probably through affecting BMI.
3. Odds ratios of various high obesity indices with high SBP and DBP
Table 3 shows the odds ratios between high obesity-related indices (high BMI, high WHR, and high %BF) and high BP (high SBP and high DBP). After adjustment for age and height (M1), high BMI in boys and girls was significantly associated with high odds of high SBP and high DBP. After further adjustment for lipid panel, glucose, and CRP (M2), the odds of high SBP and high DBP, related to high BMI, remained high. Similarly, after additional adjustment for WHR and %BF (M3), the associations between high BMI and high SBP as well as high DBP remained.

Odds ratios (ORs) between high obesity-related indices and high blood pressure
High WHR significantly increased the incidence of high SBP and high DBP in both genders in the age and height adjusted model (M1). After further adjustment for lipid panel, glucose, and CRP (M2), the associations between high WHR and high SBP as well a high DBP remained in both genders. However, when BMI was included (M4) the correlation between high WHR and high SBP as well as high DBP was lost in both boys and girls.
In the age- and height-adjusted model (M1), a high %BF considerably increased the prevalence of high SBP and high DBP in both boys and girls. After additional adjustment for lipid panel, glucose level, and CRP level (M2), the odds ratios between a high %BF and high SBP and high DBP remained high, with only a small attenuation in both boys and girls. In contrast, when BMI was included in the model (M4), these significant associations between a high %BF and high SBP as well as high DBP were lost.
Consistent with the results reported in Table 2, among obesity-related indices in boys and girls, high BMI was an independent determinant of high SBP and high DBP, whereas high WHR and high %BF were not.
4. Correlations of obesity-related indices with SV and CO
To understand how obesity-related indices affect BP, we analyzed the correlations between obesity-related indices and hemodynamic determinant factors for BP, including SV, CO, TVR, and TAC.
The data in Table 4 show the correlations between obesity-related indices and blood flow factors, including SV and CO. In both boys and girls, BMI was positively correlated with SV and CO after adjustment for age and height (M1). After additional adjustment for lipid panel, glucose level, and CRP level (M2), BMI showed positive associations with SV and CO in both genders. With additional adjustment for WHR and %BF (M3), BMI still showed positive correlations with SV and CO in both genders.
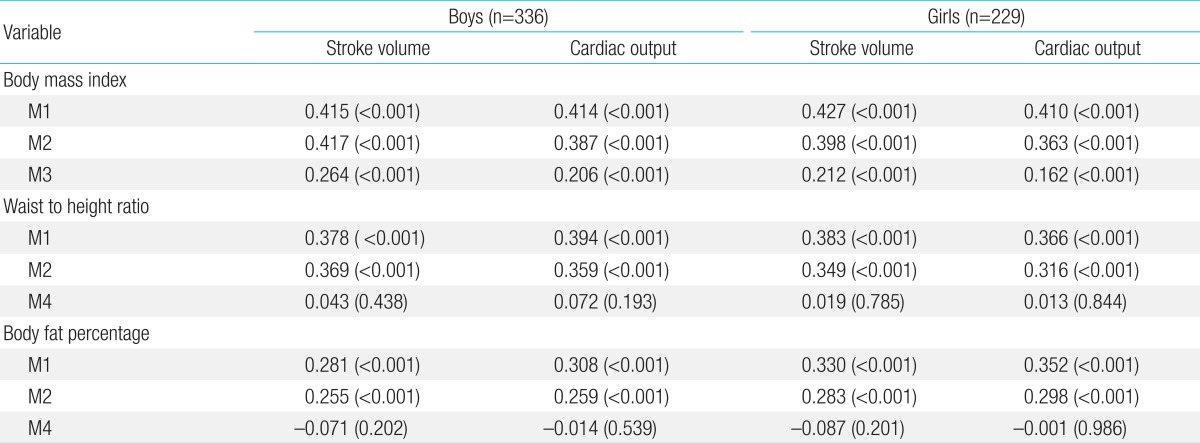
Correlation of obesity-related indices with stroke volume and cardiac output
WHR was significantly and positively correlated with SV and CO in the age- and height-adjusted model (M1). With further adjustment for lipid panel, glucose level, and CRP level (M2), the close associations between WHR and SV as well as CO persisted. However, additional adjustment for BMI (M4) eliminated the associations between WHR and these hemodynamic factors.
Body fat percentage was closely correlated with SV and CO, after controlling for age and height (M1). Additional adjustment with lipid panel, glucose level, and CRP level (M2) did not significantly attenuate these associations. In contrast, after further adjustment for BMI (M4), %BF was no longer correlated with SV and CO.
Accordingly, BMI, but not WHR or %BF, was an independent correlating factor for SV and CO in both genders.
5. Correlations of obesity-related indices with TVR and TAC
Table 5 demonstrates the correlations between obesity related indices and vascular impedance factors, including TVR and TAC. In both boys and girls BMI, WHR and %BF were negatively correlated with TVR in the age- and height-adjusted model (M1) as well as in the lipid panel-, glucose level-, and CRP level-adjusted model (M2).
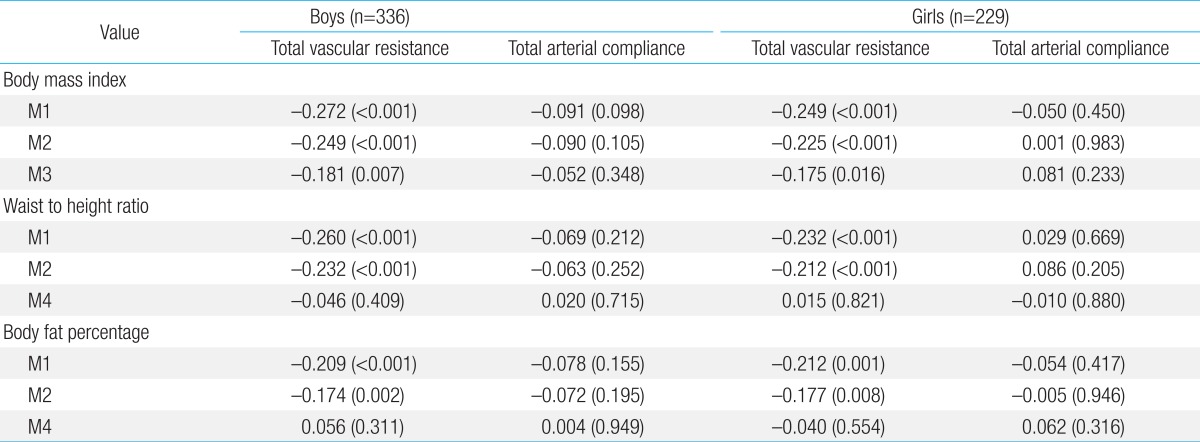
Correlation of obesity-related indices with total vascular resistance and total arterial compliance
After further adjustment for WHR and %BF (M3), the negative association between BMI and TVR persisted in both genders. However, in both boys and girls, after adjustment for BMI, WHR and %BF were no longer associated with TVR (M4). Thereafter, TVR had an independent negative association with BMI, but not with WHR or %BF.
There was no significant correlation between TAC and obesity-related indices in any of the adjusted models in either boys or girls.
Discussion
Knowledge of risk factors associated with the development of hypertension is important for intervention programs that aim to reduce the prevalence of CVD. As CVD is usually preceded by a relatively long asymptomatic disease course, understanding the risk factors for CVD in adolescents may be of particular importance. In this study, we investigated the associations between obesity-related indices and hemodynamic determinants of BP in Korean adolescents.
The main findings of this study were as follows: 1) BMI, WHR, and %BF were positively correlated with BP, whereas only BMI, but not WHR or %BF, was an independent relating factor for BP. 2) Regarding hemodynamic determinants for BP, BMI was independently associated with blood flow parameters (SV and CO) and TVR, whereas WHR and %BF were not associated. 3) There was no significant association between obesity-related indices and TAC. To the best of our knowledge, this is the first study to show fundamental relationships between obesity-related indices and BP and its hemodynamic determinants in Korean adolescents.
1. Factors correlated with BP
In previous studies, positive correlations between obesity related indices and BP were observed in younger age groups. Freedman et al.20), reported that levels of BMI were positively associated with levels of SBP and DBP in 11,478 children and adolescents (aged 5-17 years) enrolled in the Bogalusa Heart Study (Bogalusa, LA, USA). Hu et al.21) reported that an increase in BMI, WC, and WHR was associated with high BP in 1,145 Chinese children and adolescents aged 7-17 years of age. In addition, it was reported that %BF correlated with BP in children14,15).
In studies examining adults, positive correlations between obesity related indices and BP were also observed. Feng et al.22), reported that BMI was positively associated with hypertension in 8,940 Chinese adults (age 20-74 years). Park et al.23), reported that an increase in WHR was associated with high BP in Korean adults (2,327 men, 3,102 women) aged 20 years or older. Yamashita et al.24), reported that %BF could be more effective in detecting individuals with early stage CVD (diabetes mellitus, hypertension, and dyslipidemia) risk accumulation than BMI in 10,774 middle-aged Japanese men.
Consistent with the results of previous studies, the present study shows that BMI, %BF, and WHR were positively correlated with BP. When adjusted for lipid panel, glucose level, and CRP level (which are known as metabolic risk factors), these associations persisted. However, when we adjusted for BMI, WHR, and %BF, to identify independent effects of individual obesity indices on BP, only BMI was correlated with BP. This result indicates that when BMI does not change, WHR or %BF does not influence BP. %BF and WHR are indices for general and central adiposity, respectively. BMI is an index related to body mass, which is the sum of fat mass and fat-free mass. To explain our findings, we hypothesize that in adolescents, fat-free mass and fat mass have similar effects on BP; consequently, general adiposity or central adiposity does not affect BP when BMI is unchanged.
2. Factors correlated with SV and CO
BP is determined by blood flow and vascular impedance. To understand how obesity-related indices are correlated with BP, it is necessary to analyze the association between obesity-related indices and hemodynamic factors.
A previous study reported an association between obesity and increases in SV and CO, which are blood flow parameters25). Clark et al.26), reported that BMI and WC were closely associated with SV and CO in 105 African American college students aged 18-27 years.
Consistent with the results of previous studies, the present study showed that BMI, %BF, and WHR were positively associated with blood flow parameters (SV and CO), even after adjustment for age, height, lipid panel, glucose level, and CRP level. However, after controlling for BMI, %BF, and WHR, these associations were lost. Only the association between BMI and SV as well as CO persisted after adjustment for the other indices (%BF and WHR).
As discussed before, BMI is related to the amount of fat-free mass, as well as fat mass. Fat-free mass consists of organ cell mass and nonfatty tissues, including tendons, ligaments, and bone, which are metabolically active tissues. Given that CO is closely related to metabolism, fat-free mass is also an important determinant of required CO, and therefore, the SV at a specific HR. Therefore, both fat mass and fat-free mass can be strongly associated with blood flow. This explains why, after adjustment for BMI, neither %BF nor WHR was not associated with SV or CO, in either boys or girls.
3. Factors correlated with TPR and TAC
Vascular impedance is a major determinant of BP. It has been suggested that the main cause of hypertension in obesity is likely a combination of factors that elevate systemic vascular resistance27,28). In contrast to this theory, Rocchini et al.29), demonstrated that overweight children have an increased CO and SV, but not elevated systemic vascular resistance. Daniels et al.15), showed that obese children and adolescents have a decreased TVR. They showed that both an increase in fat-free mass and fat mass are associated with a decrease in TVR in children and adolescents (aged 6-17 years). The result from Daniels' study showed that at a given BMI, the ratio of fat mass does not affect TPR, because both fat-free mass and fat mass decrease TPR.
In the present study, only BMI showed an independent negative correlation with TPR, whereas WHR and %BF were not correlated with TPR. This result is consistent with the theory proposed in Daniels' study. We hypothesized that an increased tissue mass and increased blood flow could be associated with increased vasculature, resulting in a decreased TPR. However, this decrease in TPR does not seem to be sufficient for maintaining BP, probably due to neurohumoral effects or insufficient vasculature increase.
Yilmazer et al.30), reported that in Turkish children and adolescents, arterial compliance was negatively correlated with BMI and WC. In contrast, Dangardt et al.31), reported that in obese girls in Sweden, arterial compliance was increased. In the present study, there was no significant association between obesity-related indices and TAC in Korean adolescents.
A limitation of the present study was the absence of measurements related to neurohumoral activity, including sympathetic nervous system and renin-angiotensin-aldosterone system activity, which are important determinants of BP. In addition, we did not estimate the Tanner stage or levels of sex hormones, which could provide additional information on the effects of puberty on BP, and we did not monitor eating behavior and physical activity, which may well also be important factors that influence BP.
The present study provides important insight into the fundamental relationships between obesity-related indices and BP, and our findings could contribute to the establishment of education and prevention programs for obesity-related hypertension in Korean adolescents.
Acknowledgments
This work was supported by research funds from the Korean Heart Foundation (2007) and Inje University College of Medicine.
Notes
No potential conflict of interest relevant to this article was reported.