Global relationship between parent and child obesity: a systematic review and meta-analysis
Article information

Abstract
Background
The growing prevalence of overweight and/or obese children is an important public health problem in both developed and developing countries. Although the association of obesity between parents and their children is well known, its underlying mechanisms are not well established.
Purpose
This meta-analysis examined parent-child (PC) relationships in obesity and identified factors such as world region and country income level that may influence this relationship.
Methods
We identified all related studies published between January 1, 2015 and May 31, 2020 by conducting a literature search using the MeSH terms “obesity,” “overweight,” “body mass index,” “parent,” “child,” “associate,” and “relate” in the PubMed database in English.
Results
The meta-analysis of 23 studies that reported an odds ratio (OR) for parent and child obesity associations found a significant association between parents and children who were overweight or obese (pooled OR, 1.97; 95% confidence interval, 1.85–2.10). A meta-regression analysis was used to examine the sources of interstudy heterogeneity. The association between parent and child obesity was higher in Asia than in Europe and the Middle East and higher in high-income countries than in middle-or low-income countries. In addition, a higher association between parent and child obesity was found when both parents were obese than when only the father or mother was obese. This study from multiple countries indicates a significant PC relationship in weight status that varies according to PC pair type, parent and child weight statuses, world region, and country income level.
Conclusion
These results demonstrate that the risk of childhood obesity is greatly influenced by parental weight status and indicate that parents could play an important role in preventing child obesity.
Key message
Question: Are parent and child obesity correlated worldwide?
Finding: Overweight and obese status of parents and children were significantly associated worldwide. The association between parent and child obesity was stronger in Asia than in Europe and the Middle East, and in high-income than in middle- and low-income countries.
Meaning: Childhood obesity is highly influenced by parental weight status, indicating that parents could play an important role in its prevention.
Graphical abstract.
Introduction
Childhood obesity (OB) is a growing global health issue. Worldwide, the age-standardized prevalence of OB in adults (18 years and older) has increased 1.5 times since the year 2000, and the crude prevalence in children aged 5 to19 years more than doubled (from 2.9% to 6.8%) by 2016 [1]. The percentage of overweight (OW) children younger than 5 years was estimated to be around 5.6% or 38.3 million in 2019, compared to about 2.9% or 30.3 million in 2000 [1,2]. The prevalence of OW and obese conditions continues to increase in adults and children. In 2016, 39% of adults aged 18 years and over (39% of men and 40% of women) were OW, and about 13% (11% of men and 15% of women) were obese [3].
OB is a multifactorial chronic disease influenced by biological, behavioral, and environmental factors [4]. Childhood-onset OB frequently leads to adult OB and is associated with increased risk of lifestyle-related diseases including diabetes, hypertension, dyslipidemia, and cardiovascular disease, which in turn are associated with a higher chance of premature mortality and disability [5]. OB can affect a child’s immediate health, educational attainment, mental health, and quality of life.
Many studies have described the association between a parent’s OW or obese status and that of their child, but the underlying mechanisms are not well established [6].
It is important to understand the causes and consequences of childhood OB. This paper studied parent-child (PC) OB relationships according to type of PC pair, parent and child weight status, and level of economy in the country. This paper serves as a systematic review that more specifically addresses childhood OB by presenting an overview of the global epidemiology, consequences, and etiopathogenesis relating to parental OB.
Methods
1. Search strategy
Using the MeSH terms obesity, overweight, body mass index (BMI), parent, child, associate, and relate, we searched the PubMed database in English from 1 January 2015 to 31 May 2020 as follows: ((obesity[Title]) OR (overweight[Title])) OR (body mass index[Title])) OR (BMI[Title])) AND (child*[Title])) AND (parent*[Title/Abstract])) AND ((associate*[Title/Abstract]) OR (relate*[Title/Abstract])) AND ("2015/01/01"[Date - Publication] : "2020/05/31"[Date - Publication]). The initial search included 837 articles. We reviewed titles and abstracts and excluded 752 articles that either did not describe parent and child OB relationships, had a total sample size <200, or were review papers. The full text of 85 articles was reviewed, and 23 papers were selected for the final analysis based on the inclusion criteria described below. Fig. 1 shows a flow diagram of the literature search.
Flow diagram of the literature search.
2. Inclusion criteria
Articles were included if they met all of the following conditions: (1) both parents’ and children’s weight statuses were categorized based on BMI; (2) children were between 2–18 years old; (3) total sample size ≥200; (4) results were described as the parent and child OB correlation (odds ratio, OR); and (5) child weight and height were directly measured. The following data were included: authors and publication year, study design, study country, number of participants, age, BMI-based parent and child weight status, and key findings on the parent and child correlation in OB.
3. Exclusion criteria
Articles were excluded if they met any of the following conditions: (1) the parents’ or child’s weight status was not based on BMI; (2) participants were > 18 or <2 years old; (3) total sample size <200; (4) results for the OB relationship were not described using OR; and (5) parent- or self-reported child weight and height were used.
4. Data extraction
Data were extracted and summarized into a standardized data extraction form base on PRISMA (Preferred Reporting Items for Systematic reviews and Meta-Analyses) guidelines [7]. Data extracted included first author, publication year, study design, study title, study country, world bank ranking, sample size, PC pair, parent and child weight status, and main results. In total, 102 data points of PC associations in OW and/or OB were collected from the 23 studies. All studies reported ORs, and the meta-analysis was performed on the reported ORs. We included ORs for mutually exclusive specific categories of a PC pair (e.g., father-boy [FB], mother-girl [MG]) as well as general PC pairs.
5. Definitions of OW and obese
The weight statuses of participants were classified as obese, OW, or normal weight, for which BMI cutoffs were used to define weight status across children and adults and throughout articles from different countries. OB is most often defined by the BMI, a mathematical formula of weight-to-height index. BMI (kg/m2) is calculated as weight (kg) divided by height squared (m2). In pediatric age groups, OB is diagnosed when BMI is higher than the 95th percentile per age and sex, and BMI over the 85th but less than the 95th percentile for age and sex is considered OW [8]. Because a child's body composition varies with age and sex, a child's weight status is determined using age- and sex-specific percentiles for BMI, different from those used for adults [9]. The International Obesity Task Force (IOTF) has developed an international standard growth chart that allows prevalence to be compared globally [10]. However, many countries use their own country-specific growth charts. Most of the articles classified weight status according to the World Health Organization (WHO) BMI cutoff criteria, with the weight statuses of adults classified as follows: normal weight (BMI<25 kg/m2), OW (BMI 25–29.9 kg/m2), and obese (BMI ≥30 kg/m2) [11].
6. Types of PC pairs and weight status combinations
A total of 9 PC pairs were classified into 3 categories: (1) PC included PC, parent-boy, and parent-girl; (2) father-child (FC) included FC, FB, and father-girl; (3) mother-child (MC) included MC, mother-boy, and MG.
Ten types of PC weight status combinations were used as following: OW-OW, OB-OB, OW and OB (OWOB)-OWOB, OWOB-OB, OWOB-OW, OB-OW, OW-OB, BMI-OB, BMI-OW, and BMI-OWOB.
The most commonly reported combinations of PC weight status (parental weight status–child’s weight status) were OW-OW, OB-OB, and OWOB-OB, representing about 54.9 % of the total data points. Of the 23 studies with parents, 6 used information from one parent only.
7. Quality assessment and risk of bias
The risk of bias for each included study was assessed using the RoBANS (Risk of Bias Assessment Tool for Non-randomized Studies) [12]. Selection, performance, detection, attrition, and reporting biases were assessed and classified as low, high, and unclear risk of bias. The results of the risk of bias assessment are shown in Fig. 2. There was a high risk of performance biases because the data were obtained through self-reported questionnaire.

Risk of bias. (A) Risk of bias graph: review authors’ judgements about each risk of bias item presented as percentages across all included studies. (B) Risk of bias summary: review authors’ judgements about each risk of bias item for each included study.
8. Statistical analysis
In all studies, 9 PC pairs and 10 PC weight status combinations were used.
We performed a meta-analysis according to the reported 102 ORs from 23 studies. Studies combined in a meta-analysis have differences in design, so we used a random-effects model to account for differences in the underlying study effects, which include a heterogeneity variance parameter. We fitted meta-regression models with random effects and calculated pooled estimates with confidence intervals of effect size for the PC OB correlation. There was significant heterogeneity for the effect size in the PC OB relation (Cochrane Q=2295.87, degrees of freedom [df]101, P<0.001; I2=95.6%). The meta-regression analysis was used to determine which factors explained the heterogeneity. We considered child age, type of PC pair, parent and child weight status, world region, and country income level as covariates. Other than the child’s age, all other factors were important predictors of the PC association for OB. The differences in pooled OR estimates in the PC OB relationship by PC pair are shown in separate forest plots. All analyses were performed using Stata Release 14.0. Statistical significance was set at P<0.05.
9. Country income level
The countries included in the 23 studies were classified into 3 categories according to level of national income, measured by gross national income per capita (GNI) using the World Bank Atlas method. For the current 2021 fiscal year, low-income economies are defined as those with a GNI per capita of $1,035 or less in 2019; lower middle-income economies are those with a GNI per capita between $1,036 and $4,045; upper middle-income economies are those with a GNI per capita between $4,046 and $12,535; and high-income economies are those with a GNI per capita of $12,536 or more [13]. Of the 24 countries included in the 23 studies, Korea, Spain, USA, Hong Kong (China), Germany, Italy, Australia, Canada, Finland, Portugal, UK, and Japan were classified as high-income countries; China (except Hong Kong), Brazil, Thailand, Turkey, Palestine, Argentina, Iran, Cameroon, Indonesia, Colombia, India, and South Africa were classified as middle-income countries; and Kenya was classified as a low-income country.
Results
1. General characteristics
The characteristics and findings of the 23 studies are shown in Table 1 [14-36]. Most studies were cross-sectional (n=21), with sample sizes of the PC pairs varying from 486 to 42,431 [15,32]. Most of the studies included school-aged children (n=20), though 3 focused on preschool children under the age of 5. For income status, 9 studies were conducted in high-income countries, 13 studies were conducted in middle-income countries, and one study included 12 countries from low-income to high-income countries. Most studies used the WHO definition for parental weight status. In pediatric cases, the IOTF definition or WHO definition was used for child weight status. PC pairs and weight status combinations depend on study purpose, but OW or OWOB was more often used as the weight status for parents and children than was OB (number of data points for parents, OWOB=32, OW=32, BMI=21, and OB=17; for children, OW=45, OB=40, and OWOB=17). The OR of reported PC OB associations ranged from 0.98 to 24.3.

General characteristics of included studies
Table 2 shows PC OB associations. Most of the 23 studies showed a positive association in OB (87.3%). Of all the PC pairs, 10 FC pairs (26.3%) and 3 MC pairs (6.5%) showed no significant association between parent and child OB.
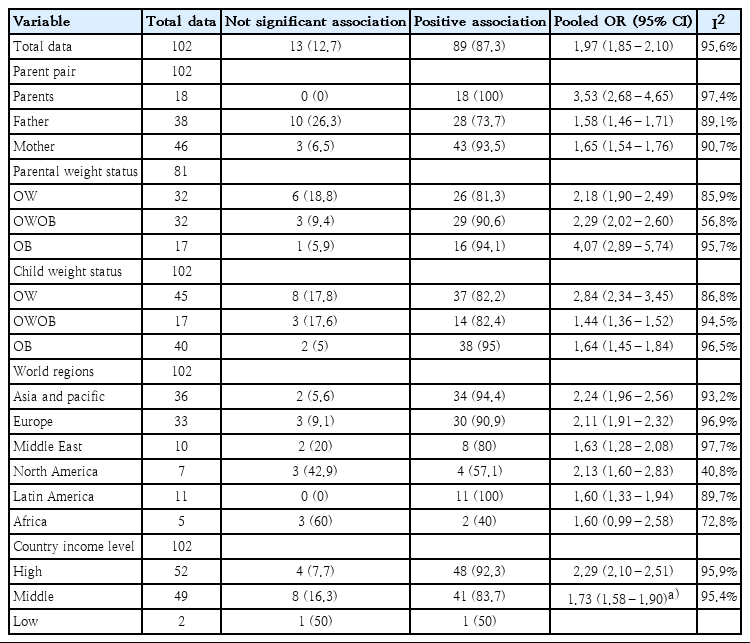
Association between and pooled estimates of parental and child obesity by parent-child pair type, weight status, world region, and country income level
Most of the world regions showed a positive association between parent and child OB, but there was no significant association between parent and child OB in 3 data points from North America (42.9%) and in 3 data points from Africa (60%). According to country income level, 4 data points from high-income countries (7.7%) and 9 data points from middle- or low-income countries (17.6%) showed no significant association between parent and child OB.
2. Meta-analysis of parent and child association in OB
A meta-analysis based on data points from 23 studies found that parent and child OW or obese statuses were significantly associated (pooled OR, 1.97; 95% CI, 1.85–2.10) (Table 2). However, there was considerable heterogeneity (Q=2295.87, df=101, P<0.001).
Table 3 shows a meta-regression model predicting the parent and child OB association by child age, PC pair, parent and child weight status, world region, and country income level. The final meta-regression model was as follows:

Results of meta-regression: factors related with the parent-child association in obesity based on reported odds ratio of 23 studies
log(OR of parent and child association in OB) = 1.75 + 0.06 × child age – 0.92 × FC pair – 0.92 × MC pair + 0.55 × parental OB + 0.35 × parental OWOB + 0.22 × child OB – 0.06 × child OWOB – 0.83 × Europe – 0.73 × North America – 0.38 × Latin America – 1.45 × Middle East – 0.39 × Africa + 0.43 × country income level.
This study showed that type of PC pair, parent and child weight statuses, world region, and country’s income level were important predictors of the PC OB associations.
This study found that the association between the child's weight status and that of both parents was stronger than that of either the father or mother alone (father β±standard error [SE]: -0.94±0.14, P<0.001; mother β±SE: -0.93±0.14, P<0.001).
This study also showed that OW status was associated more weakly with PC OB than with OB or OWOB (OB: β±SE: 0.55±0.12, P<0.001; OWOB β±SE: 0.29±0.12, P=0.022).
According to world region, Asia had a higher PC OB relation than did Europe or the Middle East (Europe β±SE: -0.26±0.11, P=0.026; Middle East β±SE: -0.95±0.17, P<0.001). Furthermore, this study showed that high-income countries (β±SE: 0.36±0.12, P=0.004) had a stronger PC OB relationship than middle- or low-income countries.
Pooled OR varied according to PC pair by country income, weight status, and world region as follows: (1) PC pairs by country income-pooled OR: 8.74 (95% CI, 5.54–13.78) at PC pairs in high-income regions, 2.08 (95% CI, 1.67–2.59) at PC pairs in middle- and low-income regions, 1.44 (95% CI, 1.31–1.58) at FC pairs in high-income regions, 1.69 (95% CI, 1.44–1.99) at FC pairs in middle- and low-income regions, 1.19 (95% CI, 1.72–2.11) at MC pairs in high-income regions, and 1.47 (95% CI, 1.34–1.61) at MC pairs in middle- and low-income regions (Figs. 3–5), (2) parental weight status–pooled OR: 4.07 (95% CI, 2.89–5.74) in OB, 2.18 (95% CI, 1.90–2.49) in OW, and 2.29 (95% CI, 2.02–2.60) in OWOB; (3) child’s weight status–pooled OR: 1.64 (95% CI, 1.45–1.84) in OB, 2.84 (95% CI, 2.34–3.45) in OW, and 1.44 (95% CI, 1.36–1.52) in OWOB; (4) world region–pooled OR: 2.24 (95% CI, 1.96–2.56) in Asia and Pacific, 2.11 (95% CI, 1.91–2.32) in Europe, 2.13 (95% CI, 1.60–2.83) in North America, 1.60 (95% CI, 1.33–1.94) in Latin America, 1.63 (95% CI, 1.28–2.08) in the Middle East, and 1.60 (95% CI, 0.99–2.58) in Africa; (5) country income level–pooled OR: 2.29 (95% CI, 2.10–2.51) in high-income and 1.73 (95% CI, 1.58–1.90) in middle- and low-income countries. The results are shown in Table 2.
Meta-analysis results of reported odds ratio (OR) of the correlation between parent and child obesity in 23 studies for parent-child pairs. Pooled estimation with 18 data points from 23 studies. Multiple OR for same studies reflect OR for different subgroups (middle- and low-income country OR: 2.08 [95% CI, 1.66–2.59]; test for heterogeneity: Cochrane Q=229.44 [df=10], P<0.001; vs. high-income country OR: 8.74 [95% CI, 5.54–13.78]; test for heterogeneity: Cochrane Q=58.74 [df=6], P<0.001). CI, confidence interval; df, degrees of freedom.

Meta-analysis results of reported odds ratio (OR) of the correlation between parent and child obesity in 23 studies for the father-child pair. Pooled estimation with 38 data points from 23 studies. Multiple OR for same studies reflect OR for different subgroups (middle- and low-income country OR: 1.69 [95% CI, 1.44–1.99]; test for heterogeneity: Cochrane Q=212.63 [df=18], P<0.001 vs. high-income country OR: 1.47 [95% CI, 1.34–1.62]; test for heterogeneity: Cochrane Q=128.10 [df=18], P<0.001). CI, confidence interval; df, degrees of freedom.
Meta-analysis results of reported odds ratio (OR) of the correlation between parent and child obesity in 23 studies for the mother-child pair. Pooled estimation with 46 data points from 23 studies. Multiple OR for same studies reflect OR for different subgroups (middle- and low-income country OR: 1.47 [95% CI, 1.34–1.61]; test for heterogeneity: Cochrane Q=165.63 [df=19], P<0.001 vs. high-income country OR: 1.90 [95% CI, 1.72–2.10]; test for heterogeneity: Cochrane Q=313.66 [df=25], P<0.001). CI, confidence interval; df, degrees of freedom.
The Asia and Pacific region had stronger PC OB relationships compared to other regions. According to country income level, high-income countries were much more likely to report higher parent and child OB relationships than were middle- or low-income countries.
3. Publication bias
A funnel plot was used to assess publication bias in the studies evaluating relation between parent and child OB. The funnel plot showed asymmetry, and Egger's test showed significant publication bias (intercept = -0.23; 95% CI, -0.34 to -0.12, z = -3.94, P<0.0001) (Supplementary materials). Therefore, we cannot exclude potential publication bias. Trim and fill methods are used to correct for publication bias in meta-analysis [37]. Using a trim and fill method, 47 prediction studies with results lower than the mean were excluded from analyses. Had these missing predictive studies been included in the meta-analysis, the pooled OR would have decreased to 1.30 (95% CI, 1.13–1.51). But, the corrected effect estimates (pooled OR, 1.30; 95% CI, 1.13–1.51) did not differ in direction, size, or statistical significance of the effect estimates before correction (pooled OR, 1.97; 95% CI, 1.85–2.10).
Discussion
The risk of OB can pass from one generation to the next as a result of biological and/or environmental factors. Parents and children share about 50% of their genes, and these genetic factors likely explain some of the observed intergenerational association. In addition, parents and children share a common environment that can correlate with BMI and OB status, such as eating the same meals and engaging in similar physical activities [6]. This meta-analysis demonstrated a significant PC OB relationship (pooled OR, 1.97; 95% CI, 1.85–2.10). Children with OW or obese parents were 1.97 times more likely to be OW or obese than children with healthy-weight parents. Studies performed in many countries have demonstrated many possible reasons for the body weight relationship between parents and their children. Epigenetic mechanisms such as DNA methylation demonstrate how inherited OB-related genes interact with environmental factors, which can lead to development of childhood OB [38]. Epigenetic changes can affect OB-related hormones such as such as leptin, insulin, and ghrelin and are dynamically regulated by nutritional and metabolic status [39]. Leptin plays a role in reducing food intake and decreasing body weight [40], whereas decreased insulin receptors cause increases in food intake, adiposity, and peripheral insulin resistance [41], and ghrelin promotes appetite, suppresses energy expenditure, and causes weight gain [42]. Furthermore, family lifestyles are an important risk factor for child OB, and dietary behavior of the parents is likely to determine a child's dietary patterns [43].
Meta-regression analysis showed that PC OB association varied by parent and child pair (PC, FC, or MC), country income level, parent and child weight statuses (obese, OW, OWOB), and world region. The study showed that the OB relationship is stronger between PC pairs than between FC or MC pairs, meaning that children are more likely to be obese if both parents are OW or obese compared to children with only one parent (mother or father) who is OW or obese. These findings are consistent with a previous meta-analysis study and might be explained by a double genetic burden from having 2 OW or obese parents or as a result of a common family environment that is more likely to promote unhealthy weight gain in the family [44]. This study did not reveal any significant differences in OB between FC and MC pairs, but previous studies showed that maternal OW and OB status influenced childhood OB more than paternal OW and OB status [45,46]. Previous studies have shown that maternal OB is a more potent determinant of postpartum infant BMI growth and an indicator of OB risk, whereas paternal effects may appear later, possibly between 3 and 4 years of age [45]. In early childhood, eating habits may be predominantly shaped by the mother, which could be a factor in the differences previously shown between maternal and paternal OB. This meta-analysis did not include infants or children under 2 years of age, however, which may explain why no differences were observed between maternal and paternal OB.
According to country income level, our study showed that high-income countries were much more likely to report strong parent and child OB relationships than were middle- or low-income countries. These “OB-causing” changes (such as economic growth, industrialization, mechanized transport, urbanization, and increased availability of abundant, inexpensive, and often undernourished foods) have been taking place in high-income countries since the beginning of the 20th century and are accelerating currently in low- and middle-income countries [47]. As multiple generations are exposed to high-risk environments, it is possible that intergenerational similarities in dietary habits and activity patterns are higher in high-income countries, while rapid generational transitions in diet and activity patterns persist in middle-income countries [44]. In high-income countries, the risk of childhood OB is greatest among lower socioeconomic groups [48]. Considering not only country income level but also family income, the United States (US) and Europe (high-income countries) could directly link wealth to OB by the middle of the 20th century [47]. It was previously found that the richer was an individual, the more likely they were to be OW. Perhaps due to the abundance of inexpensive and highly available food as well as social changes, this association has been reversed in the present. Wealth in the US now tends to be inversely correlated with OB, and those are at or below the poverty line have the highest rates of OB [49].
This study showed that Asia had higher PC OB relationships compared to Europe or the Middle East. A previous study showed that the overall prevalence of OW, including obese, school children in European countries was estimated at 20.5%, where 15.6% were OW and 4.9% were obese [50]. The prevalence of OW and/or obese status was 24.5% in Eastern Asia countries and 11.9% in the Western Asia regions, where the overall prevalence of OB and OW status were 5.8% and 11.2% in Asian children and 8.6% and 14.6% in adolescents, respectively [51]. Unlike the western societies that are promoting “individualism,” the Asian society is “collectivistic” in that it promotes interdependence and co-operation, with families at the center of this social structure [52]. Thus, Asian families tend to be more involved in care of one another and more involved in each other’s lives. In Asian regions, the higher association between parental and child OB can be explained by the high OB rate in Asia coupled with the collectivistic family culture.
There are some limitations to this study. First, different cutoff points (IOTF, Centers for Disease Control and Prevention, WHO, and country reference) were used to compared OB status in this meta-analysis, so it is difficult to directly compare across studies. Second, this study did not investigate the effects of family socioeconomic status, because published studies either did not include socioeconomic status factors or analyzed different socioeconomic status variables. Third, most of the included studies (21 of 23) were cross-sectional. Forth, the funnel plot presented an asymmetry, so publication bias cannot be fully excluded. In this study, asymmetry funnel plot with the scatter diagram is asymmetrical at the left lower bottom. This asymmetry indicates that smaller studies with negative findings are not published or not identified by the authors.
Further study should use longitudinal data to examine the parent and child relationships in OB and the related risk factors, including those related to family socioeconomic status such as family income, parental education level, and residential area.
The risk of childhood OB is greatly influenced by parental weight status. Most of the included studies reported a positive association between parent and child OB, and this relationship varied depended on type of PC pair, parent and child weight statuses, world region, and national income level. Children with OW or obese parents are more likely to be OW or obese than those with parents of normal weight. Pediatric OB is a complex disorder due to environmental, biopsychosocial, genetic, and epigenetic factors. Further study is needed to uncover the biological and social factors of the PC OB relationship.
Supplementary materials
Supplementary material: Supplementary material can be found via https://doi.org/10.3345/cep.2020.01620.
Notes
Conflicts of interest
No potential conflict of interest relevant to this article was reported.