Article Contents
| Clin Exp Pediatr > Volume 65(1); 2022 |
|
Abstract
Background
Purpose
Methods
Results
Supplementary materials
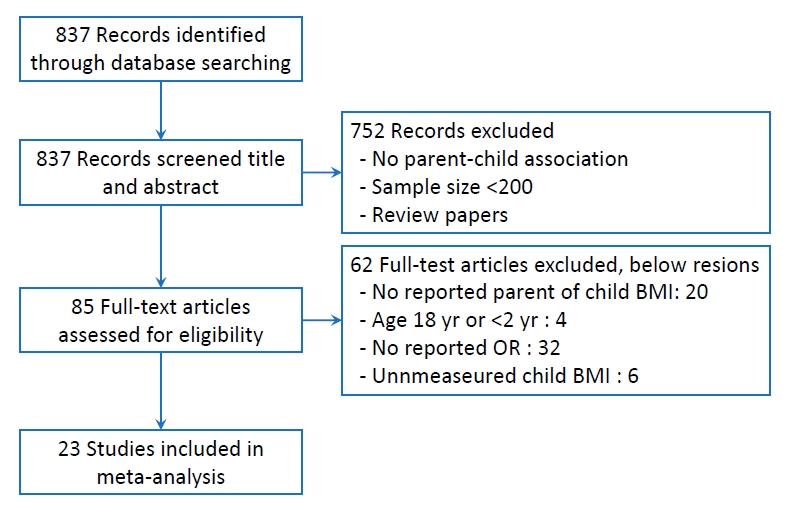
Fig. 2.
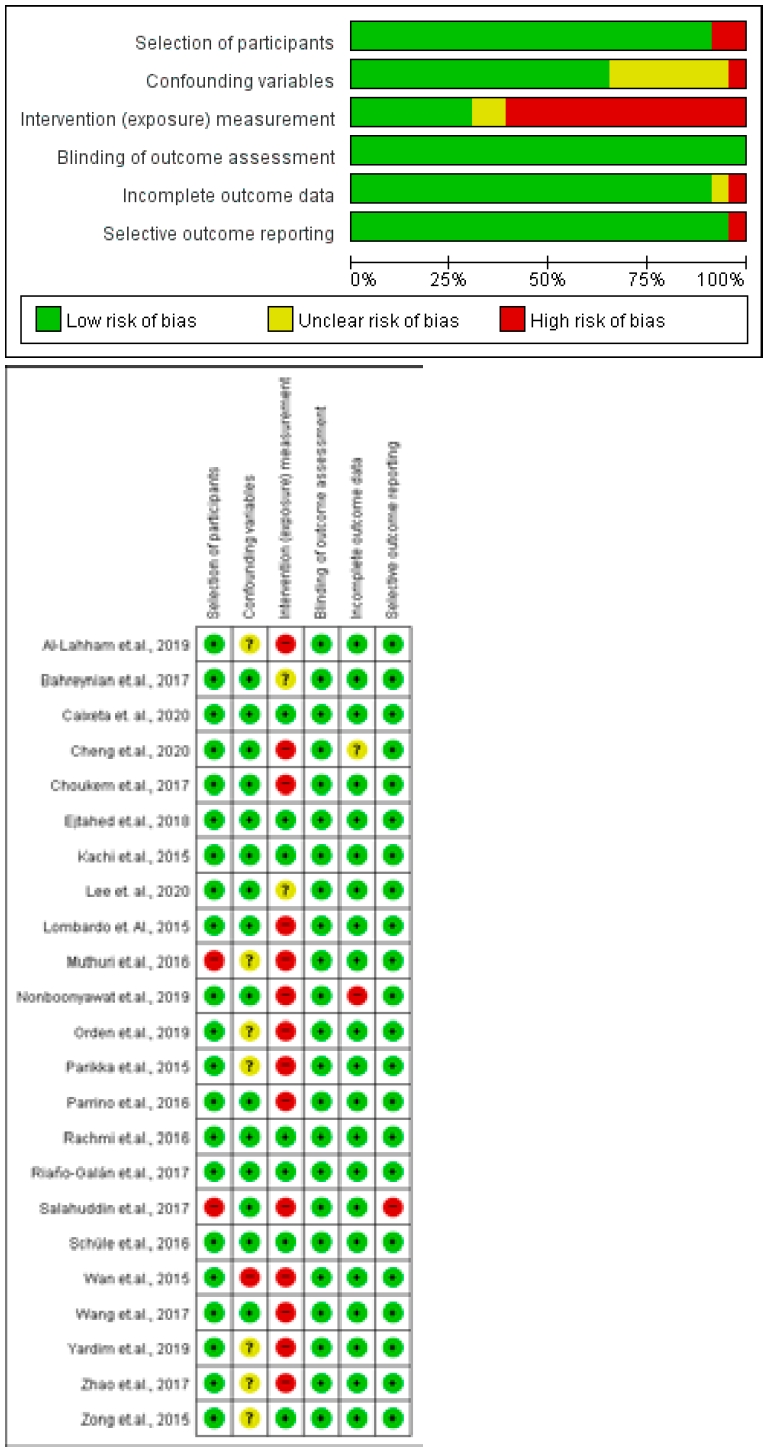
Fig. 3.
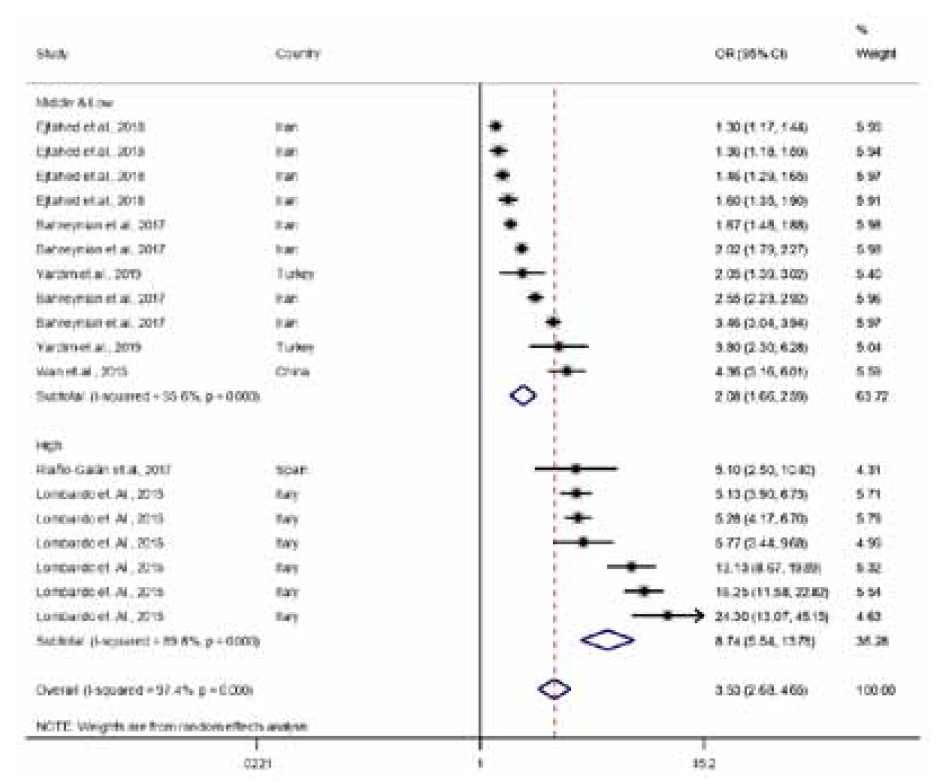
Fig. 4.

Fig. 5.
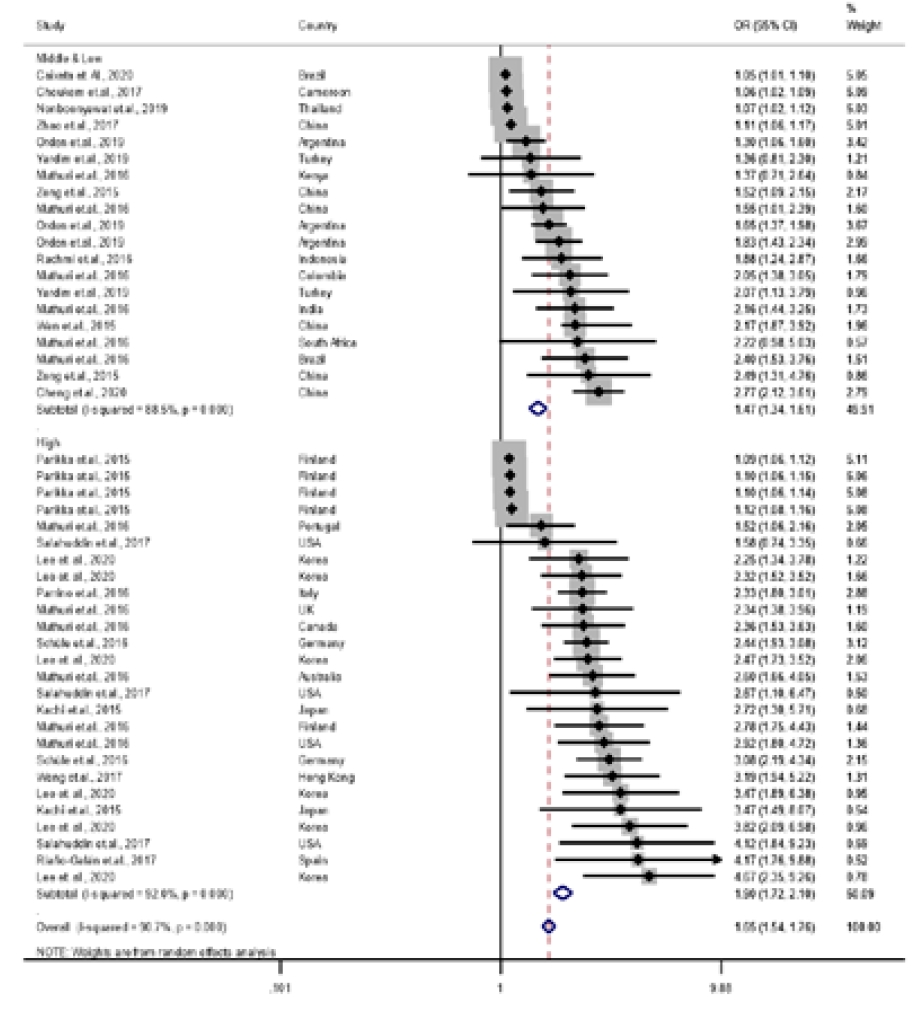
Table 1.
| Study | Study design | Title | World region/country | World bank ranking | Sample size | Child age (yr) | Weight related outcomes of parenta) | Weight related outcomes of childrenb) | Main results PC relationship in obesity: OR (95% CI) |
|---|---|---|---|---|---|---|---|---|---|
| Cheng et al., [14] 2020 | Cross-sectional | The associations of specific | Beijing, | Upper | 2,201 | 10±0.41 | OWOB | OB | F (OWOB) C: 2.09 (1.63–2.69) |
| school-and individual-level characteristics with obesity among primary school children | China | middle income | IOTF | M (OWOB) C: 2.77 (2.12–3.61) | |||||
| Caixeta and Amato [15] 2020 | Cross-sectional | Factors associated with overweight and abdominal obesity in Brazilian schoolaged children: a comprehensive approach | Brazil | Upper middle income | 486 | 6–8 | BMI | OWOB | MC: 1.05 (1.01–1.10) |
| CDC | |||||||||
| reference | |||||||||
| Lee et. al., [16] 2020 | Cross-sectional | Variability in sociodemographic factors and obesity in Korean children: a crosssectional analysis of Korea National Health and Nutrition Examination survey data (2007–2015) | Korea | High income | 14,482 | 2–18 | OW, OB | OB | M (OW) C (2–6 yr): 2.25 (1.34–3.78) |
| Korean growth chart | M (OB) C (2–6 yr): 4.67 (2.35–9.26) | ||||||||
| F (OW) C (2–6 yr): 2.59 (1.70–3.97) | |||||||||
| F (OB) C (2–6 yr): 6.07 (2.86–12.91) | |||||||||
| M (OW) C (7–12 yr): 2.47 (1.73–3.52) | |||||||||
| M (OB) C (7–12 yr): 3.47 (1.89–6.38) | |||||||||
| F (OW) C (7–12 yr): 2.47 (1.76–3.47) | |||||||||
| F (OB) C (7–12 yr): 2.25 (1.02–4.98) | |||||||||
| M (OW) C (13–18 yr): 2.32 (1.52–3.52) | |||||||||
| M (OB) C (13–18 yr): 3.82 (2.09–6.98) | |||||||||
| F (OW) C (13–18 yr): 2.07 (1.45–2.98) | |||||||||
| F (OB) C (13–18 yr): 5.30 (2.78–10.12) | |||||||||
| Nonboonyawat et al., [17] 2019 | Cross-sectional | Prevalence and associates of obesity and overweight among school-age children in rural community | Thailand | Upper middle income | 1,749 | 6–18 | BMI | OWOB | MC: 1.07 (1.02–1.12) |
| WHO reference | FC: 0.98 (0.93–1.03) | ||||||||
| Yardim et al., [18] 2019 | Cross-sectional | Prevalence of childhood obesity and related parental factors | Ankara, Turkey | Upper middle income | 2,066 | 9–11 | OWOB | OW, OB | FC (OW): 1.44 (0.97–2.15) |
| FC (OB): 1.94 (1.18–3.18) | |||||||||
| MC (OW): 1.36 (0.81–2.30) | |||||||||
| MC (OB): 2.07 (1.13–3.79) | |||||||||
| PC (OW): 2.05 (1.39–3.02) | |||||||||
| PC (OB): 3.80 (2.3–6.28) | |||||||||
| Al-Lahham et al., [19] 2019 | Cross-sectional | Prevalence of underweight, overweight and obesity among school-age children and the associated risk factors: a cross sectional study | Palestine | Lower middle income | 1,320 | 6–12 | BMI | OW, OB | FC (OW): 1.0 (0.92–1.08) |
| CDC reference | FC (OB): 1.09 (0.98–1.22) | ||||||||
| Orden et al., [20] | Cross-sectional | Short sleep and low milk intake are associated with obesity in a community of school aged children | Argentina | Upper middle income | 1,366 | 6–12 | BMI | OWOB, OW, OB | FC (OWOB): 1.52 (1.24–1.68) |
| IOTF | IOTF | MC (OWOB): 1.65 (1.37–1.98) | |||||||
| FC (OW): 1.34 (1.04–1.68) | |||||||||
| MC (OW): 1.30 (1.06–1.60) | |||||||||
| FC (OB): 1.48 (1.11–1.99) | |||||||||
| MC (OB): 1.83 (1.43–2.34) | |||||||||
| Ejtahed et al., [21] 2018 | Cross-sectional | Association of parental obesity with cardiometabolic risk factors in their children: The CASPIAN-V study | Iran | Upper middle income | 14,400 | 7–18 | OW, OB | OW, OB | P (OW) C (OW): 1.30 (1.17–1.44) |
| Iran reference | P (OB) C (OW): 1.46 (1.29–1.65) | ||||||||
| P (OW) C (OB): 1.36 (1.18–1.59) | |||||||||
| P (OB) C (OB): 1.60 (1.35–1.90) | |||||||||
| Choukem et al., [22] 2017 | Cross-sectional | Overweight and obesity in children aged 3-13 years in urban Cameroon: a cross-sectional study of prevalence and association with socioeconomic status | Cameroon | Lower middle income | 1,343 | 3–13 | BMI | overweight/obesity (OWOB) | MC: 1.06 (1.02–1.09) |
| WHO reference | |||||||||
| Riaño-Galán et al., [23] 2017 | Population-based birth cohort study | Proatherogenic lipid profile in early childhood: association with weight status at 4 years and parental obesity | Spain | High income | 582 | 4 | OWOB | OWOB | FC: 3.73 (1.90–7.34) |
| IOFT | MC: 4.17 (1.76–9.88) | ||||||||
| PC: 5.10 (2.5–10.40) | |||||||||
| Zhao et al., [24] | Cross-sectional | Fast food consumption and its associations with obesity and hypertension among children | Beijing, Shanghai, Nanjing, and Xian, China | Upper middle income | 1,626 | 7–16 | BMI | OB | MC: 1.11 (1.06–1.17) |
| Chinese schoolage BMI reference | |||||||||
| Salahuddin et al., [25] 2017 | Cross-sectional | Predictors of severe obesity in low-income, predominantly Hispanic/Latino children: the Texas childhood obesity research demonstration study | Texas, USA | High income | 517 | 2–12 | severe obesity (BMI>35 kg/m2) | severe obesity (BMI≥120% of 95th percentile) | MC (2–5 yr): 2.67 (1.10–6.47) |
| CDC reference | MC (6–8 yr): 1.58 (0.74–3.35) | ||||||||
| MC (7–12 yr): 4.12 (1.84–9.23) | |||||||||
| Wang et al., [26] 2017 | Cross-sectional | Prevalence of overweight in Hong Kong Chinese children: Its associations with family, early-life development and behaviors-related factors | Hong Kong, China | High income | 894 | 9–12 | OWOB (BMI≥25 kg/m2) | OW | FC: 1.72 (1.18–2.52) |
| IOTF | MC: 3.19 (1.94–5.22) | ||||||||
| Bahreynian et al., [27] 2017 | Cross-sectional | Association between obesity and parental weight status in children and adolescents | Iran | Upper middle income | 23,043 | 6–18 | OW, OB | OB | P (OW) B: 1.67 (1.48–1.88) |
| WHO reference | P (OB) B: 2.55 (2.23–2.92) | ||||||||
| P (OW) G: 2.02 (1.79–2.27) | |||||||||
| P (OB) G: 3.46 (3.04–3.94) | |||||||||
| Schüle et al., [28] 2016 | Cross-sectional | Neighborhood socioeconomic context, individual socioeco-nomic position, and over-weight in young children: a multilevel study in a large German city | Germany | High income | 3,499 | 5–7 | OW, OB | OW | M (OW) C: 2.44 (1.93–3.08) |
| IOTF | M (OB) C: 3.08 (2.19–4.34) | ||||||||
| Parrino et al., [29] 2016 | Cross-sectional | Influence of early-life and pa-rental factors on childhood overweight and obesity | Sicily, Italy | High income | 1,521 | 9–14 | OWOB | OWOB | MC: 2.33 (1.80–3.01) |
| IOTF | FC: 1.68 (1.30–2.17) | ||||||||
| Rachmi et al., [30] 2016 | Cross-sectional | Stunting, underweight and overweight in children aged 2.0–4.9 years in Indonesia: Prevalence trends and asso-ciated risk factors | Indonesia | Upper middle income | 4,101 | 2–4.9 | OWOB | OWOB | MC: 1.88 (1.24–2.87) |
| WHO reference | FC: 1.49 (0.09–2.38) | ||||||||
| Muthuri et al., [31] 2016 | Cross-sectional | Relationships between pa-rental education and over-weight with childhood over-weight and physical activity in 9–11-year-old children: results from a 12-country study | 12-country study | 4,752 | 9–11 | OW | OW | ||
| WHO reference | |||||||||
| Australia | High income | FC (Australia): 1.36 (0.84–2.20) | |||||||
| MC (Australia): 2.60 (1.66–4.05) | |||||||||
| Brazil | Upper middle income | FC (Brazil): 2.01 (1.20–3.34) | |||||||
| MC (Brazil): 2.40 (1.53–3.76) | |||||||||
| Canada | High income | FC (Canada): 1.35 (0.87–2.10) | |||||||
| MC (Canada): 2.36 (1.53–3.63) | |||||||||
| China | Upper middle income | FC (China): 3.17 (2.13–4.70) | |||||||
| MC (China): 1.55 (1.01–2.39) | |||||||||
| Colombia | Upper middle income | FC (Colombia): 2.20 (1.46–3.31) | |||||||
| MC (Colombia): 2.05 (1.38–3.05) | |||||||||
| Finland | High income | FC (Finland): 1.65 (1.01–2.69) | |||||||
| MC (Finland): 2.78 (1.75–4.43) | |||||||||
| India | Lower middle income | FC (India): 2.43 (1.60–3.69) | |||||||
| MC (India): 2.16 (1.44–3.25) | |||||||||
| Kenya | lower income | FC (Kenyra): 3.53 (1.73–7.20) | |||||||
| MC (Kenyra): 1.37 (0.71–2.64) | |||||||||
| Portugal | High income | FC (Portugal): 1.45 (1.01–2.08) | |||||||
| MC (Portugal): 1.52 (1.06–2.16) | |||||||||
| South Africa | Upper middle income | FC (South Africa): 1.23 (0.50–2.73) | |||||||
| MC (South Africa): 2.22 (0.98–5.03) | |||||||||
| UK | High income | FC (UK): 1.54 (0.87–2.73) | |||||||
| MC (UK): 2.34 (1.38–3.96) | |||||||||
| USA | High income | FC (USA): 1.65 (0.87–2.73) | |||||||
| MC (USA): 2.92 (1.80–4.72) | |||||||||
| Lombardo et al., [32] 2015 | Cross-sectional | Severe obesity prevalence in 8-to 9-year-old Italian children: a large population-based study | Italy | High income | 42,431 | 8–9 | OW, OB | Severe obese | P (OW) C: 5.28 (4.17–6.70) |
| WHO reference (BMI>3 SD) | P (OB) C: 16.25 (11.58–22.82) | ||||||||
| P (OW) B: 5.13 (3.90–6.73) | |||||||||
| P (OB) B: 13.13 (8.67–19.89) | |||||||||
| P (OW) G: 5.77 (3.44–9.68) | |||||||||
| P (OB) G: 24.3 (13.07–45.15) | |||||||||
| Parikka et al., [33] 2015 | Cross-sectional | Associations between parental BMI, socioeconomic factors, family structure and overweight in Finnish children: a path model approach | Finland | High income | 2,573 | 3–8 | BMI | OW | MB (3–8 yr): 1.12 (1.08–1.16) |
| IOTF | MG (3–8 yr): 1.09 (1.06–1.12) | ||||||||
| FB (3–8 yr): 1.14 (1.10–1.2) | |||||||||
| FG (3–8 yr): 1.11 (1.06–1.15) | |||||||||
| 1,836 | 11–16 | MB (11–16 yr): 1.10 (1.06–1.15) | |||||||
| MG (11–16 yr): 1.10 (1.06–1.14) | |||||||||
| FB (11–16 yr): 1.13 (1.08–1.19) | |||||||||
| FG (11–16 yr): 1.08 (1.03–1.13) | |||||||||
| Kachi et al., [34] 2015 | Cross-sectional | Socioeconomic status and overweight: A population-based cross-sectional study of Japanese children and adolescents | Japan | High income | 397 | 6–11 | OWOB (BMI≥25 kg/m2) | OW | MC (6–11 yr): 2.72 (1.30–5.71) |
| 397 | 12–18 | IOTF | MC (12–18 yr): 3.47 (1.49–8.07) | ||||||
| Zong et al., [35] 2015 | Population-based, 1:1 matched case-control design | Family-related risk factors of obesity among preschool children | China | Upper middle income | 1,844 | 3–4 | OWOB (BMI≥24 kg/m2) | OB | FC (1996): 2.33 (1.28–4.23) |
| IOTF | MC (1996): 2.49 (1.31–4.76) | ||||||||
| 3298 | FC (2006): 2.12 (1.63–2.76) | ||||||||
| MC (2006): 1.52 (1.09–2.15) | |||||||||
| Wan et al., [36] 2015 | Cross-sectional | Is parental body weight related with their children's overweight and obesity in Gao Hang Town, Shanghai | Shanghai, China | Upper middle income | 2,025 | 7–13 | OWOB (BMI≥24 kg/m2) | OWOB | FC: 2.26 (1.78–2.86) |
| Chinese adult BMI reference | Chinese school-age BMI reference | MC: 2.17 (1.87–3.92) | |||||||
| PC: 4.36 (3.16–6.01) |
OR, odds ratio; CI, confidence interval; OWOB, overweight and obese; IOTF, International Obesity Task Force; F, father; M, mother; C, child; BMI, body mass index; FB, father-boy; FC, father-child; FG, father-girl; MB, mother-boy; MC, mother-child; MG, mother-girl; PC, parent-child; OW, overweight; OB, obesity; CDC, Centers for Disease Control and Prevention; WHO, World Health Organization; SD, standard deviation.
Table 2.
| Variable | Total data | Not significant association | Positive association | Pooled OR (95% CI) | I2 |
|---|---|---|---|---|---|
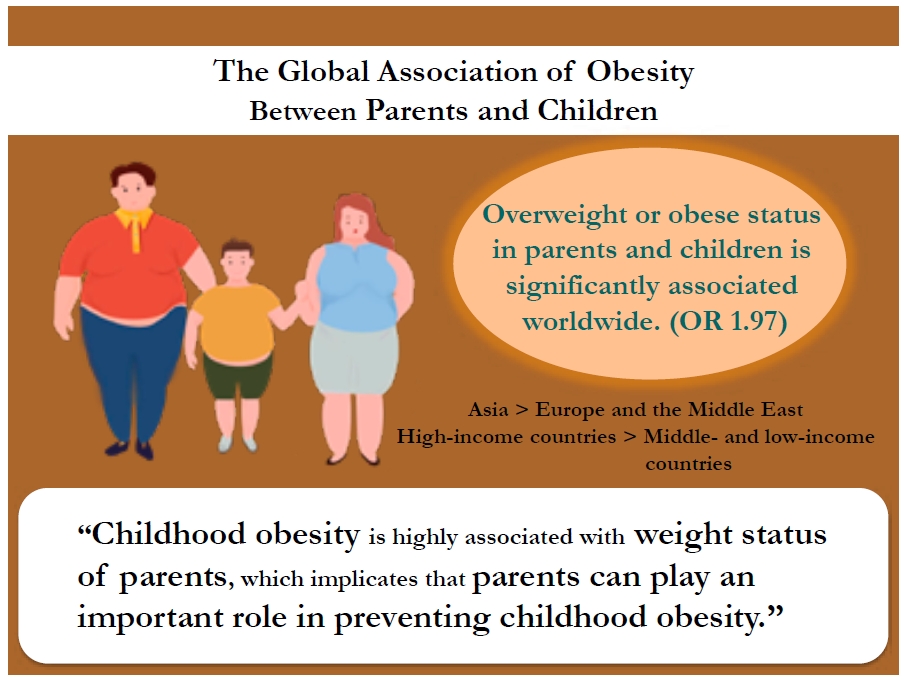
| Total data | 102 | 13 (12.7) | 89 (87.3) | 1.97 (1.85–2.10) | 95.6% |
| Parent pair | 102 | ||||
| Parents | 18 | 0 (0) | 18 (100) | 3.53 (2.68–4.65) | 97.4% |
| Father | 38 | 10 (26.3) | 28 (73.7) | 1.58 (1.46–1.71) | 89.1% |
| Mother | 46 | 3 (6.5) | 43 (93.5) | 1.65 (1.54–1.76) | 90.7% |
| Parental weight status | 81 | ||||
| OW | 32 | 6 (18.8) | 26 (81.3) | 2.18 (1.90–2.49) | 85.9% |
| OWOB | 32 | 3 (9.4) | 29 (90.6) | 2.29 (2.02–2.60) | 56.8% |
| OB | 17 | 1 (5.9) | 16 (94.1) | 4.07 (2.89–5.74) | 95.7% |
| Child weight status | 102 | ||||
| OW | 45 | 8 (17.8) | 37 (82.2) | 2.84 (2.34–3.45) | 86.8% |
| OWOB | 17 | 3 (17.6) | 14 (82.4) | 1.44 (1.36–1.52) | 94.5% |
| OB | 40 | 2 (5) | 38 (95) | 1.64 (1.45–1.84) | 96.5% |
| World regions | 102 | ||||
| Asia and pacific | 36 | 2 (5.6) | 34 (94.4) | 2.24 (1.96–2.56) | 93.2% |
| Europe | 33 | 3 (9.1) | 30 (90.9) | 2.11 (1.91–2.32) | 96.9% |
| Middle East | 10 | 2 (20) | 8 (80) | 1.63 (1.28–2.08) | 97.7% |
| North America | 7 | 3 (42.9) | 4 (57.1) | 2.13 (1.60–2.83) | 40.8% |
| Latin America | 11 | 0 (0) | 11 (100) | 1.60 (1.33–1.94) | 89.7% |
| Africa | 5 | 3 (60) | 2 (40) | 1.60 (0.99–2.58) | 72.8% |
| Country income level | 102 | ||||
| High | 52 | 4 (7.7) | 48 (92.3) | 2.29 (2.10–2.51) | 95.9% |
| Middle | 49 | 8 (16.3) | 41 (83.7) | 1.73 (1.58–1.90)a) | 95.4% |
| Low | 2 | 1 (50) | 1 (50) |
Table 3.
SE, standard error; OWOB, overweight and obese. The outcome variable used in the meta-regression model was the odds ratio. A Stata Metareg command was used with the dummy variables of type of parent-child pair, parental and child weight status, country region, and categorical variables of child age and country income level. Boldface indicates a statistically significant difference with P<0.05.


 PDF Links
 PubReader
 ePub Link
 PubMed
 Download Citation


