Total energy expenditure measured by doubly labeled water method in children and adolescents: a systematic review
Article information
Abstract
Total energy expenditure (TEE) is essential for understanding the growth, development, and physical activity of children and adolescents. This study aimed to summarize the existing evidence on TEE measured using the doubly labeled water (DLW) technique in children and adolescents aged 1–18 years. Furthermore, this review compared TEE between obese and normal-weight participants. This systematic review used the PubMed, ScienceDirect, Web of Science, and EBSCO databases. These studies were limited to those published in English between January 2000 and December 2021. Articles presenting objectively measured data on the TEE of children and adolescents aged 1–18 years measured using the DLW method were included. Physical activity level (PAL; TEE/basal metabolic rate [BMR]) and BMR data were also obtained. The search strategy identified 2,351 articles, of which 63 (n=4,283 children and adolescents; 45.4% male) met the selection criteria. The participants in the 10 studies were overweight or obese (n=413). In our study, TEE increased in male and female participants aged 1–18 years. PAL increased with age in males (y=0.0272x+1.3887, r2=0.511) and females (y=0.0199x+1.401, r2=0.335), and the slope of PAL with age did not differ between males and females. The TEE of obese and overweight participants was higher than that of normal-weight participants, but the slope of TEE did not differ between normal-weight (y=132.99x+702.24, r2=0.877) and obese individuals (y=136.18x+1,037.9, r2=0.842). In conclusion, this review provides convincing evidence that daily TEE progressively increases with growth in males and females aged 1–18 years.
Key message
This systematic review summarizes convincing evidence that total energy expenditure (TEE) measured using the doubly labeled water technique increased with age from 1 to 18 years, while fat-free mass (FFM) increased with growth. TEE and in normal-weight participants, while physical activity level did not differ from that of normal-weight participants.
Introduction
From growth and development to physical activity, essential parts of our lives require energy. Total energy expenditure (TEE) is central to understanding human nutritional requirements and physical activity. The human body maintains homeostasis by balancing its energy intake and expenditure. The first law of thermodynamics indicates that weight gain is due to an energy imbalance that occurs when the energy intake is higher than the TEE [1]. Energy imbalances can lead to obesity in children. Childhood overweight and obesity is a global issue affecting approximately 42 million children aged <5 years [2]. Obesity is associated with an increased risk of metabolic syndrome, cardiovascular disease, and type 2 diabetes [3]. Low physical activity during youth is related to obesity, cardiovascular diseases, and diabetes, whereas increased physical activity can reduce the risks associated with these diseases [4-6]. The World Health Organization (WHO) reported that more than 80% of adolescents globally do not meet the current recommendations of at least one hour of physical activity daily [7,8]. Children in Korea have low physical activity levels (PALs, TEE/basal metabolic rate [BMR]), a physical activity index. In a previous study, the PAL value of normal-weight Korean boys aged 9–11 years was 1.61 [9]. The PAL values of Korean children [10,11] were slightly lower than those of Swedish children aged 11–13 years, whose PAL values were approximately 1.77 [12]. Examining PAL and TEE is essential to understanding their relationship with health, including the adverse effects of childhood obesity.
The doubly labeled water (DLW) method is the gold standard for estimating TEE under free living conditions with minimum constraints since it reflects the energy requirement for maintaining energy balance [13-16]. However, isotopes are expensive and most studies to date included a small number of participants. Approximately 20 years ago, Butte [15] reviewed TEE and PAL measured using DLW in children and adolescents aged 0–18 years before 2000. However, they did not distinguish between obese and normal-weight children. A recent review examined the TEE of individuals aged 8 days to 95 years and analyzed the relationship between fat-free mass (FFM) and TEE [16]. However, previous reviews did not distinguish between obesity and normal-weight individuals and did not compare the differences between Eastern and Western countries. To the best of our knowledge, no systematic review has examined TEE measured using the DLW method in adolescents and children under 18 years of age, including those who are overweight and obese, since 2000. This systematic review analyzed combined data from 63 studies to construct a reference line for TEE and PAL as a function of age and sex from 2000 to 2021. Overweight and obese participants were classified and reviewed separately.
To analyze the TEE data, we evaluated the difference in TEE separately according to sex. Therefore, this systematic review aimed to summarize the existing evidence for TEE measured using the DLW method and PAL in children and adolescents aged 1–18 years separately between male and female participants. Furthermore, this review aimed to compare TEE and PAL in obese and normal-weight participants.
Methods
1. Inclusion criteria
The participants were children or adolescents aged 1–18 years who participated in studies that measured TEE using DLW as the gold standard method. To be included, studies had to fulfil all of the following criteria: (1) include children or adolescents (aged 1–18 years) of either sex; (2) be published in English; and (3) include objective measures of TEE using the DLW method. This review excluded participants taking medication or having diseases or disabilities (diabetes, Down syndrome, cerebral palsy, cystic fibrosis, sickle cell disease, heart disease, lymphoblastic leukemia, Prader-Willi syndrome, human immunodeficiency virus/acquired immune deficiency syndrome, sleep apnea syndrome, burns, neurologic impairment, and inflammatory bowel disease). Articles in which the participants were athletes or indigenous people were excluded. No attempt was made to contact the authors regarding unpublished articles or results since our review focused on published articles. Studies were identified through online database searches and the reference lists of the articles. These studies were limited to those published in English between January 2000 and December 2021. This search was applied to 4 databases (PubMed, ScienceDirect, Web of Science, and EBSCO). Keywords included MeSH terms and text words. Searches included all meaningful combinations of the following terms: (1) DLW, (2) child (children, adolescents, youth, and preschool); and (3) TEE (total daily energy expenditure).
2. Study selection
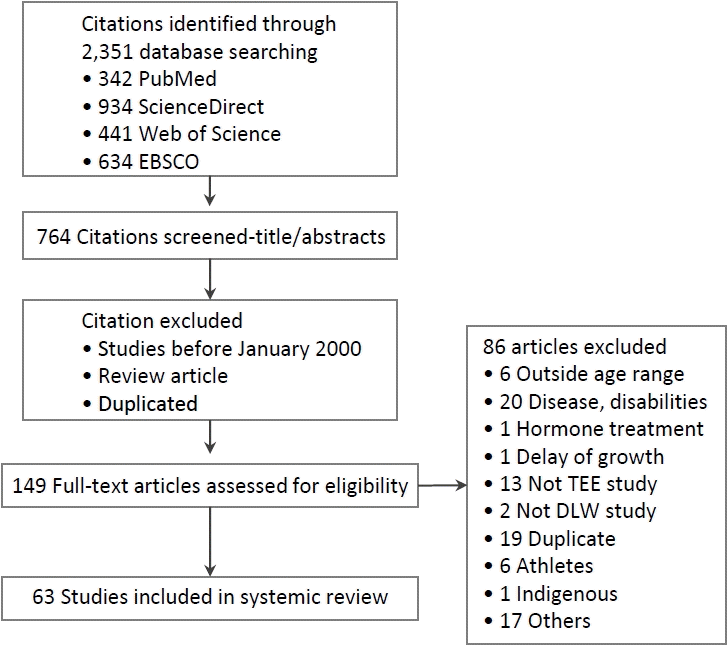
Two reviewers independently performed the eligibility assessments. First, the titles and abstracts of the articles identified from the database search were screened for suitability. The first screening level excluded articles that did not include children aged 1–18 years, did not assess infants younger than 12 months, and did not assess TEE using the DLW method in which the number of participants was unclear. Additionally, data on physical disability, disease, growth delay, and hormone therapy were excluded. A second-level screening was performed if eligibility could not be determined based on the title and abstract, and studies were read in full text to assess whether they fit the criteria. The screening and identification of studies included in this review are shown in Fig. 1.
3. Data extraction and conversions
The data were extracted independently by 2 authors. A second reviewer double-checked the extracted data, and discrepancies were resolved through discussion at consensus meetings. To avoid double-counting data from multiple reports of the same study, studies that reanalyzed previously published data and answered the same research questions were not included. Several studies that described secondary analyses or cohort studies of previously collected data were included because they answered new research questions. Articles were excluded when a difference was noted in the number of participants between the characteristics and the DLW data.
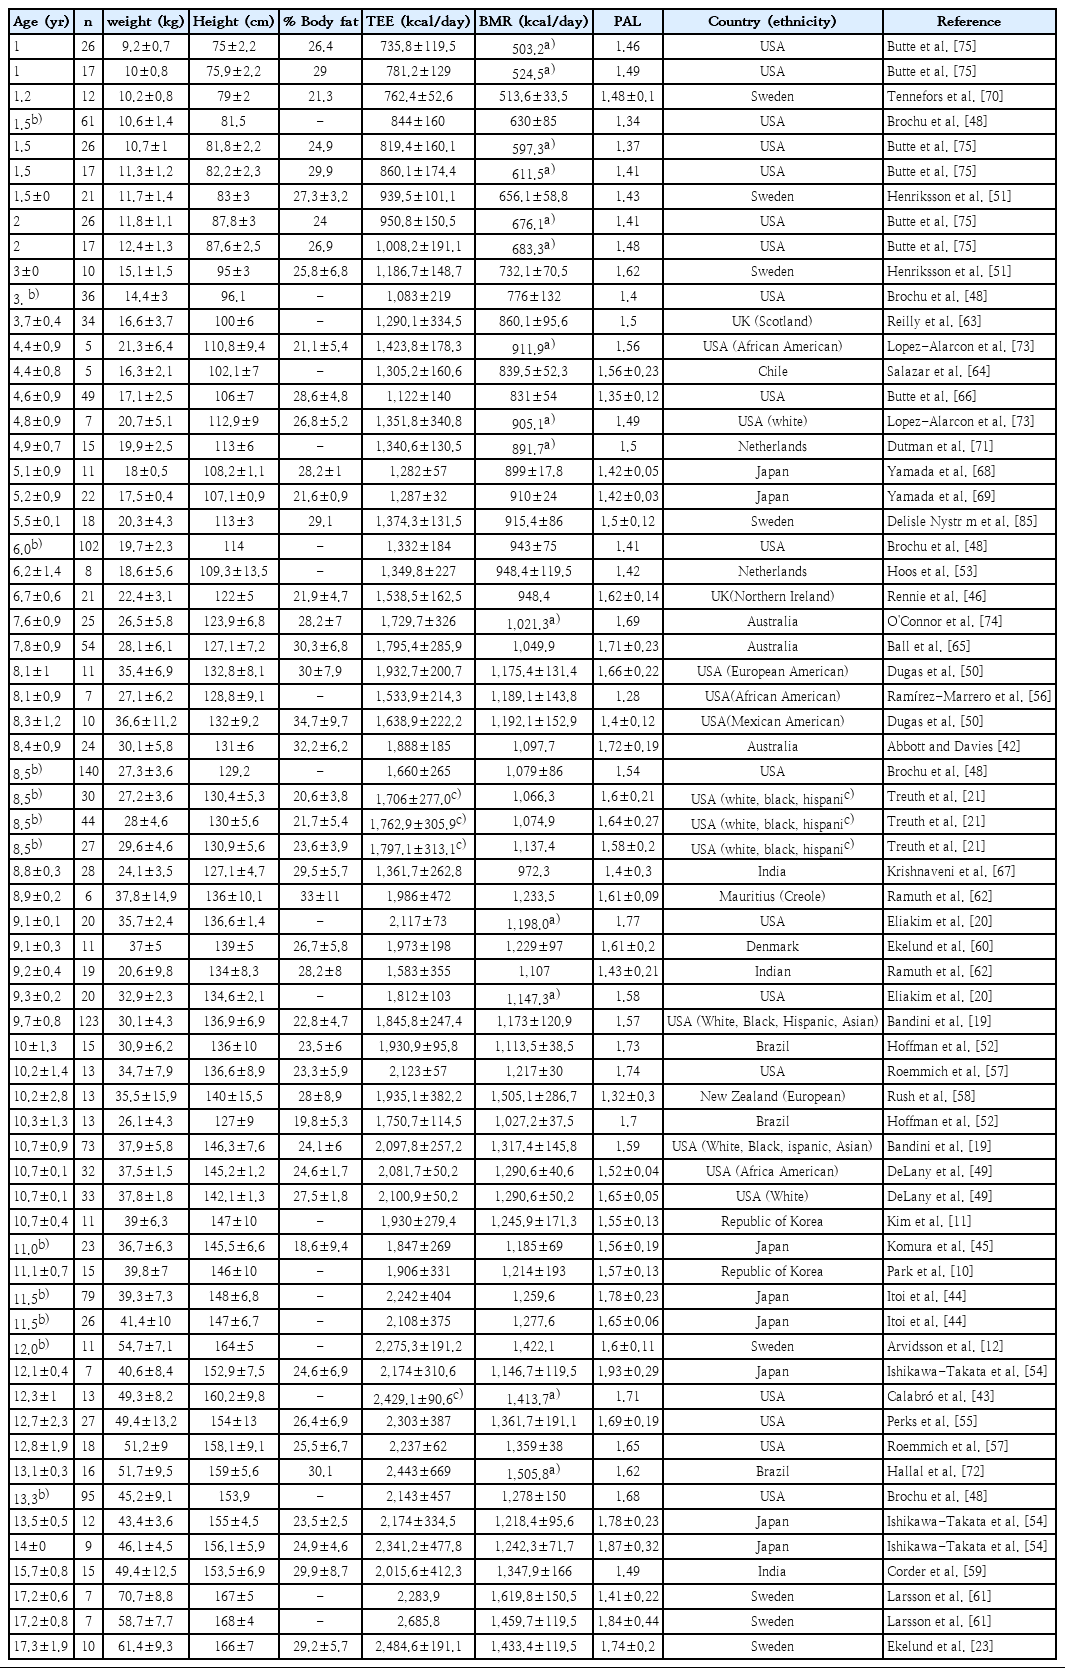
The characteristics of the extracted study data included year of publication, number of participants, location (country), patient characteristics (age, sex, weight, height, body mass index, %fat mass [FM], and race/ethnicity), TEE, BMR, resting metabolic rate (RMR), BMR measurement methods, PAL, and step counts. Measures of central tendency (mean or median) and dispersion (standard deviation, standard error of the mean, confidence interval, or range) of the data were tabulated according to pubertal categories defined in each study and separated by sex when possible. The TEE of the population group was estimated by multiplying the group mean BMR or RMR by the group mean PAL (TEE=BMR×PAL). If BMR or RMR was not directly measured, it was calculated using physical activity energy expenditure (PAEE) data (BMr=0.9 TEE-PAEE) or by dividing TEE by PAL. Conversely, if no PAL data were available, it was calculated by dividing BMR by TEE (PAL=TEE/BMR). If no data were available for PAL or BMR, BMR was calculated using the Schofield equation for height and weight [17]. If no %FM data were available, it was calculated as predicted mean FM (kg) or mean FFM. All data are expressed as kcal, and data published in kJ or MJ were converted to kcal.
Results
1. Study identification and selection
A total of 2,351 articles were identified in the initial database search (Fig. 1); of them, 1,587 were removed. The full texts of the remaining 149 articles were read to determine eligibility after the exclusion of duplicate articles, review articles, and articles published before 2000. Of the 149 articles, 86 were excluded because they did not meet the inclusion criteria. Thus, a total of 63 articles were included in the final analysis.
2. Study characteristics
We investigated the effects of age, sex, and FFM on TEE using a large (n=4,283 participants; 45.4% male) and diverse databases using DLW measurements for participants aged 1–18 years. Sex distribution showed a higher female representation (55.6%), with 58 studies examining both sexes, 2 including male participants only [9,18], and three including female participants only [19-21]. The participants in 10 studies were obese and overweight (10 studies; 413 participants) [9,22-30]. In 14 studies, data on DLW values and participants’ characteristics were not distinguished between men and women [26-28,31-41]. Eight studies suggested that obese or overweight participants were mixed with normal-weight participants [25,33,42-47]. As more than 40% of the female participants in the 2 studies were overweight, they were excluded from the analysis, and only male participants were summarized [46,47].
TEE was measured in all studies using the DLW method (Tables 1–4). In 27 studies, BMR was measured using indirect calorimetry via gas analysis [9-11,19,21,23-27,31-33,37,40,41,48-58]. Sixteen studies used the Schofield equation [18,22,30,35,36,39,42,46,59-66], 2 used the Food and Agriculture Organization/WHO/United Nations University equation [12,67], 2 used the Molnar equation [28,34], 2 used the Japanese equation [68,69], 1 used the Wells equation [70], 1 used the Kaneko equation [47], and 1 used the Dietz equation [29]. Three studies measured children’s sleeping metabolic rate [41,51,70]. In 9 studies, the researcher calculated BMR using the Schofield equation [20,38,43,47,71-75].
3. Summary of outcomes
1) TEE and BMR of normal-weight participants
In all 63 studies, TEE was measured using the DLW method. BMR was measured using indirect calorimetry and equations; if the data contained no BMR information, it was calculated using the Schofield equation for height and weight. We found that TEE increased with age in both male and female participants (Fig. 2A). The TEE in male participants was slightly higher than that in female participants. The regression equations to predict daily TEE from age were as follows: males (TEE=0.4074 age2+139.8 age+707.53, r=0.954, r2;=0.910, standard error of the estimate [SEE]=211.195) and females (TEE=-1.7207 age2+144.61 age+651.82, r=0.951, r2=0.904, SEE=163.258).
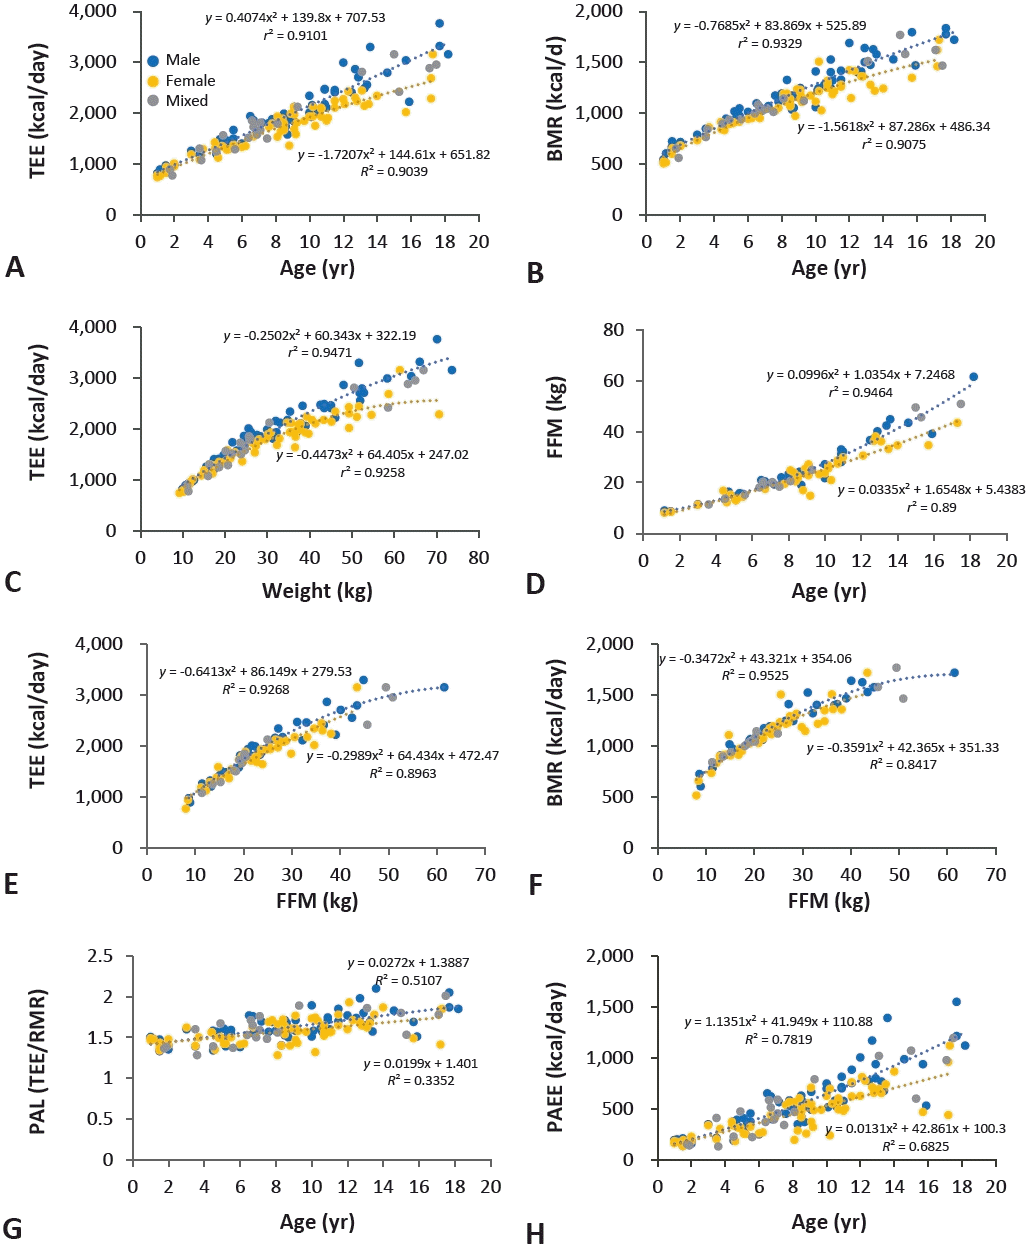
Comparison of TEE, BMR, PAL, and FFM in normal-weight males and females aged 1–18 years. (A) TEE increased with age over 1–18 years. The TEE of males was slightly higher than that of females. (B) BMR increased with age over 1–18 years. (C) TEE increased with weight. (D) FFM increased in childhood and puberty. There was no sex-based difference in FFM in childhood. The FFM increased more during puberty in males than in females. (E) TEE increases with FFM for both males and females. (F) BMR also increased with FFM for both sexes. (G) No sex-based difference in PAL was noted for participants aged 1–18 years. (H) The PAEE increased more for males than females. TEE, total energy expenditure; FFM, fat-free mass; BMR, basal metabolic rate; PAEE, physical activity energy expenditure; PAL, physical activity level.
The BMR also increased with age over 1–18 years (Fig. 2B). The regression equations to predict BMR from age was as follows: males (BMr=-0.7685 age2+83.869 age+525.89, r=0.966, r2=0.933, adjusted r2=0.931, SEE=86.601) and females (BMr=-1.5618 age2+87.286 age+486.34, r=0.953, r2=0.907, adjusted r2=0.905, SEE=84.957). In addition, TEE and BMR increased with weight gain (Fig. 2A, B). Regression equations for predicting daily TEE from weight were as follows: males (TEE=-0.2502 weight2+60.343 weight+322.19, r=0.973, r2=0.947, adjusted r2=0.945, SEE=162.042) and females (TEE=-0.1976 weight2+34.499 weight+316.7, r=0.962, r2=0.926, adjusted r2=0.923, SEE=143.409). FFM also increased with age in males (FFM=0.0996 age2+1.0354 age+7.2468; r2=0.9464) and females (FFM=0.0335 age2+1.6548 age+5.4383; r2=0.89) (Fig. 2D). The TEE and BMR also increased with FFM (Fig. 2E, F). TEE, BMR, and FFM had a slightly larger slope in males than in females (Fig. 2AA, B, D). The regression equations for predicting daily TEE from FFM were as follows: males (TEE=-0.6413 FFM2+86.149 FFM+279.53, r=0.963, r2=0.927, adjusted r2=0.922, SEE=159.857) and females (TEE=-0.2989 FFM2+64.434 FFM+472.47, r=0.947, r2=0.896, adjusted r2=0.891, SEE=148.541). Regression equations to predict daily BMR from FFM were as follows: males (BMr=-0.6413 FFM2+86.149 FFM+279.53, r=0.963, r2=0.927, adjusted r2=0.922, SEE=159.857) and females (BMR=-0.2989 FFM2+64.434 FFM+472.47, r=0.947, r2=0.896, adjusted r2=0.891, SEE=148.541).
2) PAL and physical activity-induced energy expenditure for normal-weight participants
The PAL index was calculated by dividing the TEE by the BMR. The PAEE was derived by subtracting the BMR and thermal effect of feeding (10% of the TEE) from the TEE. The quadratic regression analysis of PAL values for individuals aged 1–18 years is shown in Fig. 2G. PAL increased with age in males (r=0.0272x+1.3887, r2=0.511) and females (y=0.0199x+1.401, r2=0.335), and the slope of PAL with age did not differ between males and females in the linear regression analysis. The PAEE for growth had a slightly larger slope for males than for females (slope: male, 61.737; female, 43.079 when a linear equation was applied) (Fig. 2h).
3) TEE, BMR, and PAL for overweight or obese participants
Fig. 3 shows the quadratic regression analysis of TEE, BMR, physical activity, and FFM between normal-weight and overweight participants. The quadratic regression analysis of TEE and BMR values by age 1–18 years is shown in Fig. 3A and B. TEE (obesity: TEE=-2.4684 age2+190.87 age+769.19, r2=0.8476; normal: TEE=-0.3776 age2+139.63 age + 681.75, r2=0.8772) and BMR (obesity: TEE=-2.0591 age2+125.63 age+469.79, r2=0.7953; normal: TEE=-1.0795 age2+84.792 age+504.89, r2=0.9053) showed a greater increase in overweight participants than in normal-weight participants. TEE was higher in obese and overweight participants (y-intercept=1037.9, slope=136.18) than in normal-weight participants (y-intercept=703.29, slope =133.03) in a linear regression analysis. The BMR also tended to be higher in obese and overweight participants (y-intercept =693.97, slope=80.013) than in normal-weight participants (y-intercept=566.46, slope=65.932) in a linear regression analysis. PAEE (obesity: PAEE=-0.1625 age2+46.154 age+222.48, r2=0.3737; normal: PAEE=0.7397 age2+40.873 age +108.69, r2=0.7134) and PAL (obesity: PAL=0.0001 age2+0.0268 age+1.3832, r2=0.4246, normal; PAL=-0.0003 age2 +0.0149 age+1.5089, r2=0.0274) of the obese group did not differ from those of the normal-weight group (Fig. 3G, H). The relationship between age and FFM in overweight and obese participants is shown in Fig. 3D. FFM was higher in obese participants (FFM=0.0852 age2+1.9172 age+5.4253; r2=0.9599) than in normal-weight participants (FFM=0.0813 age2+1.143 age+6.8833; r2=0.9110). In normal-weight and overweight participants, TEE and BMR increased as FFM increased (Fig. 3E, F).
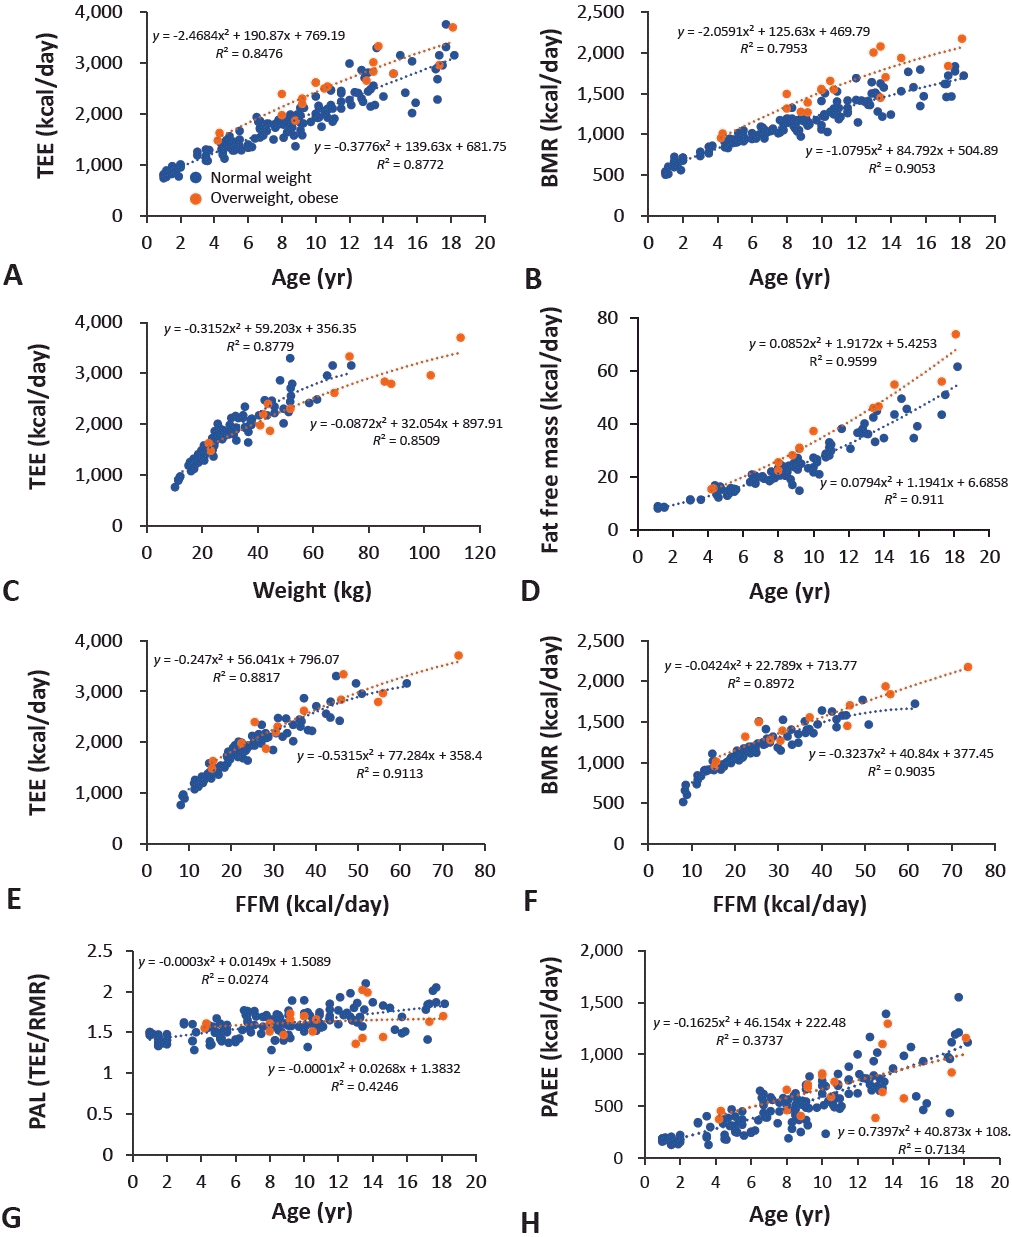
Comparison of TEE, BMR, PAL, and FFM between normal-weight and overweight participants aged 1–18 years. (A) TEE increased with age for both normal-weight and overweight participants. The TEE was higher for overweight than normal-weight participants. (B) BMR for both normal-weight and overweight participants increased over age 1–18 years. (C) TEE increased with weight. (D) FFM increased with growth. FFM increased more for overweight than normal-weight participants. (E) TEE increased with FFM for normal-weight and overweight participants. (F) BMR also increased with FFM for both groups. (G) No intergroup difference in PAL was noted. (H) No intergroup difference in PAEE was noted. TEE, total energy expenditure; BMR, basal metabolic rate; FFM, fat-free mass; PAL, physical activity level; PAEE, physical activity energy expenditure.
4) TEE, BMR, and PAL for Western and Eastern countries
Fig. 4 shows TEE, BMR, FFM, PAL, and PAEE according to the age of children from Eastern and Western countries. As a result, there was no difference in TEE, BMR, FFM, PAL, and PAEE between Eastern and Western countries for male or female patients.
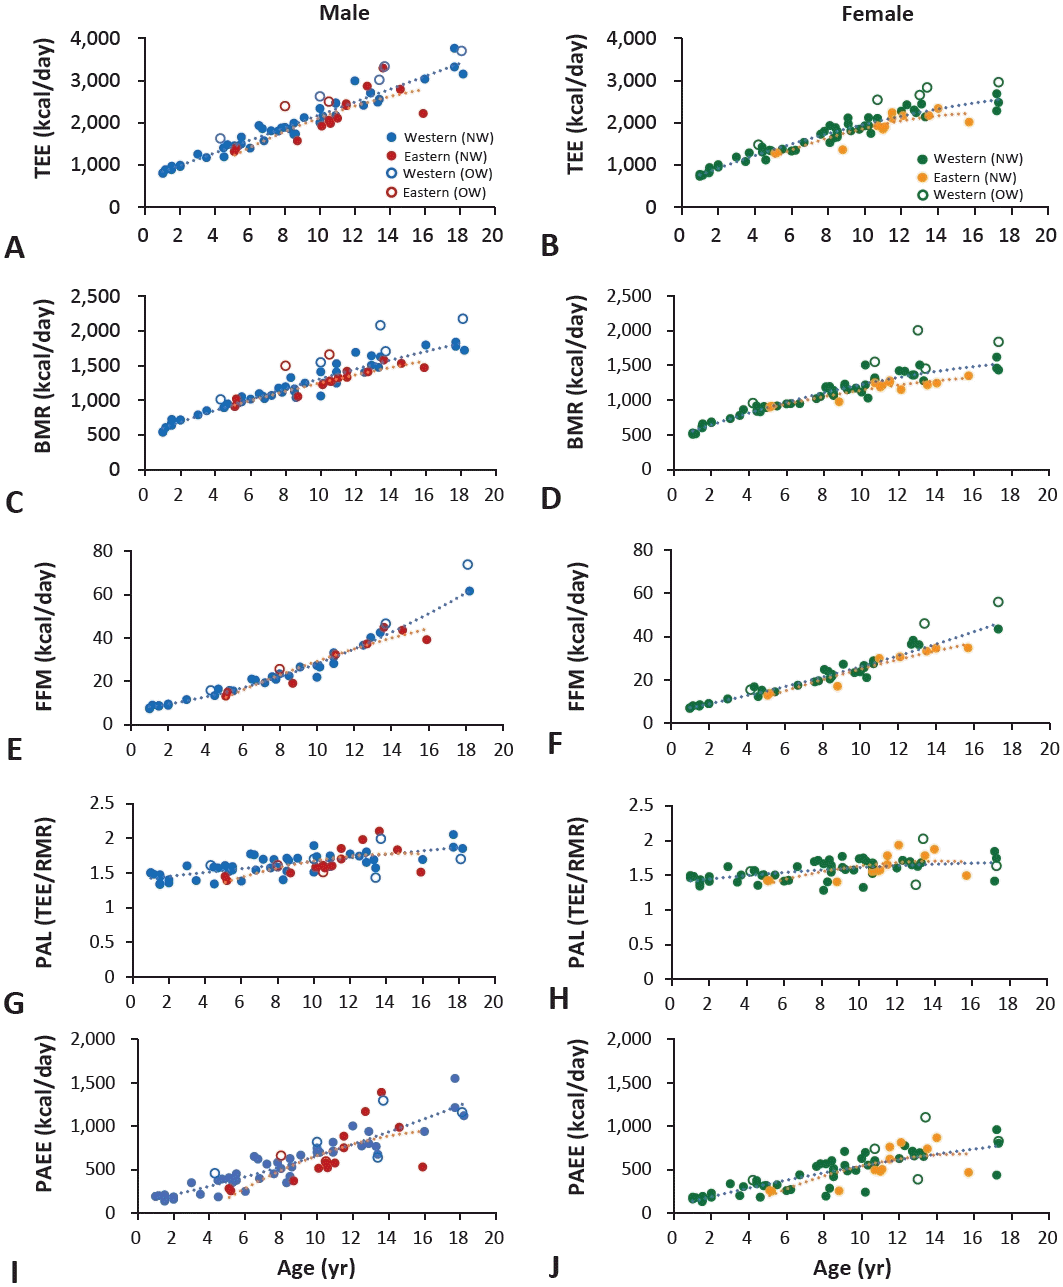
Comparison of TEE, BMR, FFM, PAL, and PAEE between Western and Eastern countries (normal-weight participants indicated by solid circles, overweight and obese participants indicated by open circles). Panels A, C, E, G, and I (left) show male data, while panels B, D, F, H, and J (right) show female data. (A, B) TEE, (C, D) BMR, and (E, F) FFM increased with age (1–18 years) for Western and Eastern countries. (G, H, I, J) No difference in PAL or PAEE was noted between male and female participants from Western versus Eastern countries. TEE, total energy expenditure; BMR, basal metabolic rate; FFM, fat-free mass; PAL, physical activity level; PAEE, physical activity energy expenditure; NW, normal weight; OW, overweight.
Discussion
This systematic review identified 63 studies that estimated TEE in children and adolescents by using the DLW technique. A total of 63 studies (n=4,283) individuals were identified between 2000 and 2021. To our knowledge, no systematic review to date examined the TEE of children and adolescents aged 1–18 years using DLW from 2000 to 2021. This systematic review aimed to summarize changes in TEE and PAL with age (1–18 years) separately in terms of sex and weight status.
We found that TEE has a high correlation with age 1–18 years for both sexes (Fig. 2A). Our results are consistent with those of a previous review showing that TEE increases linearly with age [15,16,76]. Moreover, the TEE increased with increasing weight (Fig. 2C). This result is consistent with those of previous reviews [77]. The analysis results indicated progressive increases in TEE with growth. Our review showed an increase in BMR with increasing age (Fig. 2B). The increase in BMR is a possible cause of the increase in TEE with growth. BMR is highly correlated with FFM (Fig. 2F). Thus, the major reason for the increase in TEE with growth was the increase in FFM with age. These results are consistent with those of a previous review [16]. Previous studies indicated important effects of FFM (standardized regression coefficient=0.723) and step count (β=0.296) on TEE in preschool children aged 4–6 years [68]. Komura et al. [45] also suggested that the TEE of Japanese children aged 10–12 years could be predicted using FFM (β=0.74) and step count (β=0.51). These findings support the relationship between FFM and TEE in children regardless of sex. Hence, previous studies and this systematic review indicated that FFM is a major determinant of TEE in children and adolescents.
In this study, with advancing growth, the TEE showed a slightly greater slope in males than in females. Previous reviews reported that TEE increased faster in males than in females [15,16]. This sex difference appeared to be due to FFM gain (Fig. 2D). In our analysis, the FFM of males increased with slightly larger slopes than those of females during puberty. The testosterone concentration increased the fastest during puberty. Higher testosterone levels in men may increase their physical activity and affect their muscle metabolism [76,78,79]. Our review also showed that the PAEE of males increased with a slightly larger slope than that of females. The increase in FFM, which is greater in males than females during puberty, may have affected the increase in BMR and PAEE as well as that in TEE.
According to the 2020 Dietary Reference Intakes for Koreans (K-DRI), the estimated energy requirement (EER) for low activity is as follows: ages 1–2, 1,000 kcal; ages 3–5, 1,400 kcal; ages 6–8, male, 1,700 kcal, and female, 1,500 kcal; ages 9–11, male, 2,100 kcal, and female, 1,800 kcal; ages 12–14, male, 2,500 kcal, and female, 2,000 kcal; and age 15–18, male, 2,700 kcal, and female, 2,000 kcal [80]. The EER of Korean children and adolescents presented in the K-DRI were similar to the TEE analyzed in this systematic review. The TEE study of Korean children and adolescents is insufficient, and the K-DRI refers to the EER equation of the Institute of Medicine and can be calculated according to PAL [81]. Further studies are needed on TEE considering the physical activity of children and adolescents in Korea.
Our review identified no difference in PAL between male and female participants, a result that was consistent with those of previous studies [11,45,65,68,69]. In a previous study, the PAL values of normal-weight Korean children aged 9–11 years were 1.58 and 1.55 for boys and girls, respectively [11]. Komura et al. [45] reported that the PAL of boys and girls aged 10–12 years was 1.6 and 1.56, respectively, with no significant difference. On the contrary, the PAEE of males also had slightly higher slopes than that of females with growth, although it showed a large scatter. Ramírez-Marrero et al. [56] indicated that the daily step counts of African American boys were significantly higher than those of girls aged 7–10 years (18,352.9 vs. 12,596.2, respectively). In studies examining the step counts of boys and girls, those of girls were significantly lower than those of boys [10,11,44,45].
In our analysis, the PAL and PAEE data showed large scatter (Fig. 2G, H). The large scatter in physical activity reflects differences in lifestyle, geographic habitat, and socioeconomic conditions [15]. Previous studies reported that children’s physical activity differed among climates. Duncan et al. [82] indicated that ambient temperature and rainfall substantially affect children’s daily step counts. Itoi et al. [44] indicated that PAL was significantly lower in rural children because of the difference in the physical activity patterns of children in rural and urban areas. Larsson et al. [61] compared the PAL of vegan and omnivorous adolescents; vegans (boys, 1.87; girls, 1.41) had a significantly lower PAL than omnivores (boys, 2.05; girls, 1.84) [61]. These findings support those of previous studies showing that physical activity is related to lifestyle and geographic habitat.
Our review showed that overweight and obese participants had higher age-specific TEE than normal-weight participants (Fig. 3A). These results are consistent with those of previous studies showing that TEE is greater in obese than normal-weight children [83,84]. The higher TEE of obese participants was probably due to the higher BMR (Fig. 3B). In contrast, no difference in PAEE was noted between obese and normal-weight participants in our review (Fig. 3H). FFM (Fig. 3D) and FM increased with growth on a larger slope in obese than in normal-weight participants. Moreover, no difference in PAL was noted because obese participants had high BMR and TEE values. In a previous study of overweight and normal-weight Korean children, no significant difference was noted in PAL (overweight, 1.51; normal-weight, 1.61) and PAEE [9]. Ekelund et al. [23] reported that the PAL and PAEE of obese Swedish adolescents did not differ from those of normal-weight adolescents. This review had some limitations. Few studies (n=10,413 participants) have measured TEE and PAL in obese and overweight children using DLW; thus, further studies are needed to measure TEE using the DLW method for the growth and development of obese and overweight individuals.
This review revealed no difference in TEE, BMR, PAL, and PAEE between Eastern and Western countries. However, there was a limitation in that it was difficult to directly compare Eastern and Western countries because there were only a few data points from Asian countries including Korea and Japan. In addition, TEE between races could not be classified and analyzed in this review. According to previous studies, children’s living environments, such as weather and climate, affect their physical activity; therefore, future studies should examine whether there is a difference in the TEE of children according to these geographic environments [68]. Finally, in this study, the relationship between physical activity and TEE could not be directly reviewed using wearable devices. In future studies, it will be necessary to review the relationship between physical activity using accelerometers or heart rate measurements and TEE using the DLW method. In conclusion, this systematic review provides convincing evidence that TEE increases with growth over age 1–18 years, as does FFM. TEE and FFM were higher in overweight and obese than in normal-weight participants, while PAL did not differ from that in normal-weight participants. Further research is required to measure the TEE of obese and overweight children.
Notes
Conflicts of interest
No potential conflict of interest relevant to this article was reported.
Funding
This study received no specific grant from any funding agency in the public, commercial, or not-for-profit sectors.

