Relationship between nonalcoholic fatty liver disease and hyperandrogenemia in adolescents with polycystic ovary syndrome
Article information

Abstract
Background
Nonalcoholic fatty liver disease (NAFLD) is common in adults with polycystic ovary syndrome (PCOS), and several studies on adults have investigated its influencing factors. However, factors associated with NAFLD in adolescents with PCOS remain unknown.
Purpose
This study aimed to investigate the presence of NAFLD in adolescents with PCOS using the noninvasive methods of vibration-controlled transient elastography (VCTE) and ultrasonography (USG), along with assessing NAFLD-related metabolic and hormonal risk factors.
Methods
This study included patients aged 12–18 years who were diagnosed with PCOS according to the Rotterdam criteria. The control group included young women with similar age and body mass index (BMI) z scores, who had menstruated regularly for more than 2 years. Patients with PCOS were divided into hyperandrogenemia and nonhyperandrogenemia groups based on serum androgen level. USG was performed on all patients to evaluate the presence of hepatic steatosis. Liver stiffness measurement (LSM) and controlled attenuation parameter (CAP) were assessed using VCTE (Fibroscan). Clinical, laboratory, and radiological data were compared between groups.
Results
This study included 124 adolescent girls aged 12–18 years (61 with PCOS, 63 controls). BMI z scores were similar between groups. Waist circumference and total cholesterol, triglyceride, and alanine aminotransferase levels were higher in the PCOS versus the control group. The presence of hepatic steatosis on USG was similar between groups. However, the rate of hepatic steatosis on USG was higher in patients with hyperandrogenic PCOS (P=0.01). LSM and CAP measurements were similar between groups.
Conclusion
No increase in prevalence of NAFLD was observed among adolescents with PCOS. However, hyperandrogenemia is a risk factor for NAFLD. Therefore, adolescents with PCOS and elevated androgen level should be screened for NAFLD.
Key message
Question: Is polycystic ovary syndrome (PCOS) a risk factor for nonalcoholic fatty liver disease (NAFLD) in adolescents?
Finding: The frequency of NAFLD did not increase in adolescents with PCOS. However, hyperandrogenemia was a risk factor for NAFLD.
Meaning: Adolescents with PCOS and hyperandrogenemia should be closely monitored for hepatic steatosis.
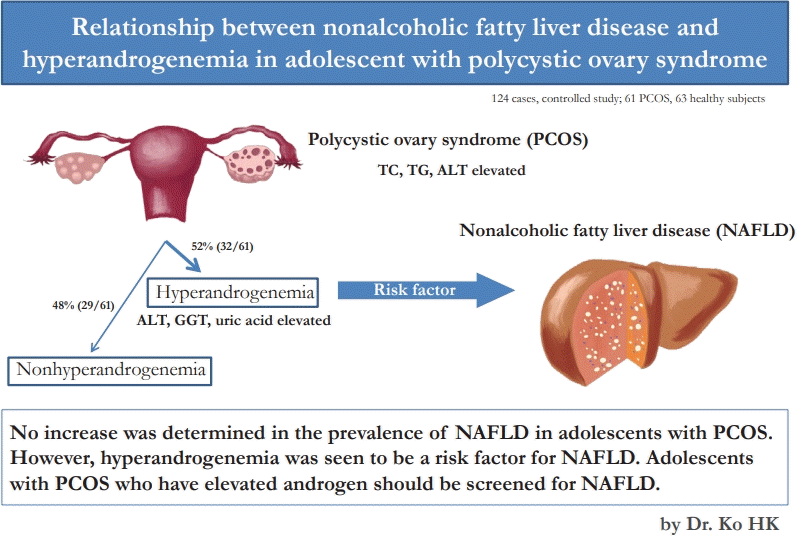
Graphical abstract. TC, total cholesterol; TG, triglyceride; ALT, alanine aminotransferase; GGT, gamma glutamyltransferase.
Introduction
Polycystic ovary syndrome (PCOS) is among the most common endocrinopathies among females of reproductive age [1]. Although the studies about PCOS prevalence in adolescents are limited, it was reported to vary between 3.4% and 22.6% [2]. It usually develops in adolescence and is mainly characterized by ovulatory dysfunction and hyperandrogenism. The clinical and biochemical characteristics are heterogeneous [3]. Obesity and insulin resistance are common among patients with PCOS. However, the presence of insulin resistance in lean patients with PCOS suggests that insulin resistance plays the main role in the pathogenesis of the disease independently from obesity [1].
Nonalcoholic fatty liver disease (NAFLD) is a wide spectrum of liver diseases between simple steatosis and end-stage liver disease developing from excess fat accumulation in the liver [4]. Obesity is the main risk factor for NAFLD development [5]. Insulin resistance was shown to play a role in the pathogenesis of NAFLD as in PCOS [6,7].
The relationship between PCOS and NAFLD was first described in 2005 when nonalcoholic steatohepatitis (NASH) was detected in the biopsy of a young patient with PCOS [8]. Thereafter, many studies were conducted to investigate the prevalence of NAFLD and the risk factors in patients with PCOS [9-13]. The prevalence of NAFLD was found to increase in females with PCOS compared to those without [11,14]. Many factors including insulin resistance, central obesity and hyperandrogenemia were shown to lead to a risk for NAFLD in females with PCOS [11-13]. However, despite all studies, the relationship between NAFLD and PCOS is still obscure [15,16].
Liver biopsy is the gold standard in the diagnosis of NAFLD. However, the invasive nature of the method restricts its feasibility except for selected cases [4]. Many guidelines recommend using alanine aminotransferase (ALT) and ultrasonography (USG) for NAFLD screening [4,17]. However, while USG has a high sensitivity for assessment of moderate and severe hepatic steatosis, its sensitivity decreases in mild hepatic steatosis; furthermore, the also results may vary according to the radiologists [18]. About 11%–30% of patients with biopsy-proven NASH were shown to have normal serum ALT levels [19,20]. Given all these results, novel noninvasive methods have been developed and introduced for the assessment of hepatic steatosis and fibrosis. Among the noninvasive elastography methods, the vibration-controlled transient elastography (VCTE, FibroScan, Echosens, Paris, France) is a reliable and applicable method for the assessment of hepatic steatosis with controlled attenuation parameter (CAP) and the assessment of hepatic fibrosis with liver stiffness measurement (LSM) [21,22]. In addition, a good correlation has been shown with histology in patients with various liver pathologies and thereby, the need for liver biopsy has decreased [23].
Many studies have shown that the prevalence of NAFLD has increased in both obese and nonobese patients with PCOS [24]. On the other hand, there are also studies that have not detected an increase in the prevalence of NAFLD in nonobese patients [25]. Still, many questions need clarification about the development of NAFLD in PCOS. In our study, it was aimed to evaluate the presence of NAFLD in adolescents with PCOS through noninvasive methods, VCTE and USG, and also to investigate the NAFLD-related metabolic and hormonal risk factors.
Methods
1. Ethical approval
The study protocol was approved by the Institutional Review Board of the University of Health Sciences Bursa Yuksek Ihtisas Training and Research Hospital (2011-KAEK-25 2021/02–21) by the tenets of the declaration of Helsinki. Written informed consent to participate in this study was obtained from the children and/or parents or legal guardians of the children after explaining the nature and purpose of the study.
2. Study population
This single-center, cross-sectional, comparative study was performed from February 2021 to January 2022 at the departments of pediatric endocrinology and pediatric gastroenterology of a tertiary center. The study population was selected from adolescent girls aged 12–18 years who had menstruation for at least 2 years. During this period, patients who came for any reason such as menstrual irregularity, acne, hirsutism and were diagnosed with PCOS according to the Rotterdam criteria were evaluated as the PCOS group. Adolescent girls with regular menstruation for at least 2 years, without signs of hyperandrogenism (hirsutismus, acne, cliteromegaly…), age and body mass index (BMI) z score similar to the PCOS group were included in the study as the control group. The exclusion criteria for both groups were reported as alcohol consumption of more than 20 g/day, history of known liver and endocrine disease and use of any medication.
1) Diagnosis of PCOS
The diagnosis of PCOS was made according to the Rotterdam criteria [26]. According to the Rotterdam criteria, patients with 2 of the 3 criteria were evaluated as PCOS. The Rotterdam criteria are presented respectively: oligo-anovulation, hyperandrogenism and polycystic ovaries (≥12 follicles measuring 2 to 9 mm in diameter and/or ovarian volume ≥10 mL in 1 or 2 ovaries). Exclusion criteria included hyperprolactinemia, Cushing syndrome, congenital adrenal hyperplasia, androgen-secreting tumors, thyroid dysfunction, and other diseases.
Irregular menstrual cycles defined according to years postmenarche: >90days for any one cycle (>1year postmenarche), cycles<21 or>45days (>1 to <3years postmenarche); cycles <21 or>35days (>3years postmenarche) and primary amenorrhea by age 15 or>3years postthelarche. Irregular menstrual cycles (<1year postmenarche) represent normal pubertal transition [27]. Because it was considered as normal pubertal changes, patients in the first year of postmenarche were not included in the study.
Suprapubic ovarian ultrasound scanning was performed on day 10 from the beginning of the last period using a 7.5-MHz vaginal probe transducer (General Electric LOGIQ 400MD, Milwaukee, WI, USA). Both ovaries were measured in the sagittal, transverse and coronal planes. Ovaries were classified as polycystic based on the presence of 12 or more follicles in each ovary measuring 2–8 mm in diameter, and/or increased ovarian volume (>10 mL) [26].
2) Diagnosis of hyperandrogenemia
The diagnosis of hyperandrogenism was made these criteria: hirsutism, severe acne and/or biochemical hyperandrogenaemia (using validated high-quality assays). The modified Ferriman-Gallwey scoring system was used for the diagnosis of hirsutism. In this system, 9 regions (upper lip, chin, chest, back, waist, upper abdomen, lower abdomen, arm and thigh) are evaluated in terms of hair growth and each region is scored from 0 to 4 according to the terminal hair growth rate, and the total score is calculated.Women with an FG score of 8 or higher are regarded as hirsute [28].
Dehydroepiandrosterone sulphate (DHEAS), Δ4-androstenedione, and 17 OH progesterone levels were measured to exclude other causes of hyperandrogenism (classical and nonclassical congenital adrenal hyperplasia, androgen-secreting tumors). PCOS patients with high serum total testosterone levels were considered hyperandrogenemic, and those with low serum total testosterone levels were considered non-hyperandrogenemic [29].
3. Study protocol
For all patients in the study, physical examination, anthropometric measurements and blood pressure measurements were performed. Measurements of the height, weight, waist circumference and the blood pressure were made by an experienced pediatric nurse. BMI standard deviation (SD), weight SD and height SD were calculated according to the age- and sex-specific reference values [30]. Aspartate aminotransferase (AST), ALT, alkaline phosphatase (ALP), gamma-glutamyltransferase, fasting glucose and insulin, uric acid, ferritin, triglyceride (TG), total cholesterol (TC), high-density lipoprotein cholesterol (HDL-C), and low-density lipoprotein cholesterol (LDL-C) were examined in both groups. Patients whose ALT level (upper limit: 22 U/L) was ≥2 above of the upper limit during 3 months, ALT >80 U/L during screening, those who had viral or autoimmune hepatitis, Wilson disease, alpha-1 antitrypsin deficiency, Celiac disease, or who were using drugs were excluded from the study [4]. The insulin resistance index was calculated as homeostatic model assessment-insulin resistance (HOMA-IR), which was calculated as fasting plasma glucose (mg/dL)×fasting serum insulin (µU/mL)/405 [31].
Blood samples that had previously been collected from participants at an early follicular phase (days 3–5) of menstruation were noted (luteinizing hormone, follicle-stimulating hormone, estradiol, total testosterone). The following hormonal parameters were evaluated for the differential diagnosis of hyperandrogenism findings: DHEAS and Δ4-androstenedione, and 17 OH progesterone.
USG, which is used as a NAFLD screening method, has an important place. It is a noninvasive and inexpensive method that can be applied in outpatient clinic. USG was performed for all patients to evaluate the presence of hepatic steatosis. Patients who were detected to have hepatic steatosis were accepted to have NAFLD. CAP and LSM measurements were made with FibroScan in patients and the control groups by an experienced gastroenterologist. Patients who were detected to have hepatic steatosis based on USG criteria were compared with regard to laboratory and FibroScan findings in both groups.
Both groups were compared with regard to anthropometric, biochemical and radiological data. The risk factors were investigated in patients with NAFLD. In addition, the effect of hyperandrogenemia on NAFLD was evaluated in the PCOS group.
4. Laboratory analysis
The serum fasting glucose, TC, TG, HDL-C, LDL-C, and insulin levels were tested after 12 hours of fasting. Biochemical parameters (AST, ALT, GGT, ALP, uric acid) were tested using the Abbott brand of kits with the spectrophotometric method in the Abbott ARCHITECT plus device (Abbott, Abbott Park, IL, USA). Serum ferritin was tested withthe Abbott ARCHITECT plus device with the CMIA chemiluminescent microparticle immunoassaymethod. Serum blood glucose and lipids were tested with the standard methods using the ‘Cobas 8000’ equipment. Insulin was measured with the standard method using the ‘Cobas 8000’ equipment (Roche Diagnostics International AG, Rotkreuz, Switzerland). total testosterone, DEHAS were measured with the electrochemiluminescence immunoassay on an autoanalyzer.
5. Abdominal USG
Abdominal USG was performed by radiologists who performed ultrasonographic examination only in pediatric patients, using the Hitachi hivision preirus device, within a maximum of 1 month after VCTE examination in all participants.
6. Vibration-controlled transient elastography
VCTE was performed by an experienced gastroenterologist (with hundreds of examinations performed) with FibroScan 502 Touch (Echosens, Paris, France). The operator was blinded to the clinical and laboratory findings of the patient and control groups. CAP measurement was madefor the evaluation of hepatic steatosis. LSM was carried out to evaluate fibrosis. Measurements were begun with a standard M probe. CAP measurement was continued with an XL and/or M probe with automatic probe selection according to the distance between the liver capsule and the skin, which varies depending on the weight of the device. The reliability of the VCTE measurement was based on reaching at least 10 valid measurements and an interquartile-range-to-median ratio of ≤0.3 [32]. CAP measurement values were given as dB/m and the LSM measurement value was given as kiloPascal (kPa).
7. Statistical analysis
All statistical analyses were performed using IBM SPSS Statistics ver. 21.0 (IBM Co., Armonk, NY, USA). For each continuous variable, the normality of the data was confirmed using the Kolmogorov–Smirnov test (P>0.05). The difference between the means was analyzed using the Student t test and the Mann-Whitney U test according to the distribution of the data. The chi-square test was utilized for comparison of the categorical variables. The Pearson correlation was used to examine the relationships among the measured variables. The receiver operating characteristic analysis was performed by MedCalc 16.8 (MedCalc, Ostend, Belgium). P values lower than 0.05 were considered significant.
Results
1. Demographic characteristics
A total of 124 individuals (61 patients with PCOS and 63 healthy adolescents) were included in the study. The patients and the control groups were similar with regard to age and BMI (P=0.34, P=0.09, respectively). Waist circumference was higher in the PCOS group (P=0.001). The anthropometric measurements and the clinical characteristics of the groups have been presented in Table 1. While 31 subjects (51%) were obese, 6 (10%) were overweight, and 24 (39%) were normal in PCOS group; of the controls, 25 (40%) were obese, 3 (5%) were overweight, and 35 (55%) were of normal weight (P=0.16).
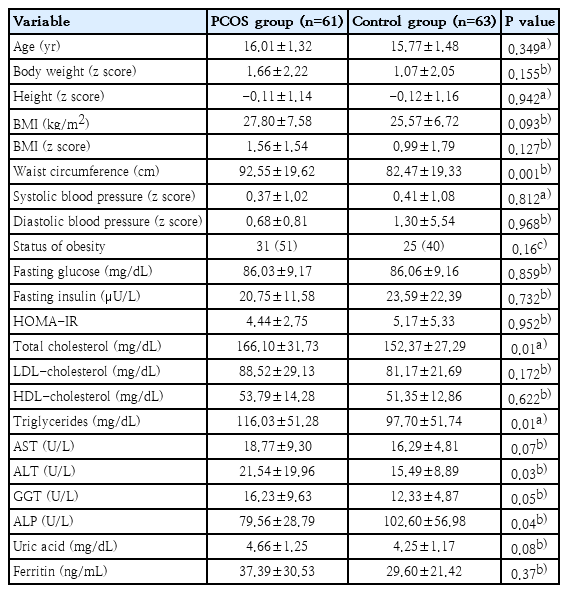
Anthropometric, clinical, and laboratory parameters of PCOS and control groups
2. Laboratory characteristics
The TC, TG and the ALT levels were found to be higher in the PCOS group (P=0.01, P=0.01, P=0.03, respectively). The ALP level was lower in the PCOS group (P=0.04). The laboratory data of both groups have been presented in Table 1.
While hyperandrogenemia was detected in 32 out of 61 patients in the PCOS group, it was not detected in 29. According to the USG examination, the prevalence of NAFLD was higher in the hyperandrogenemic group (P=0.01) (Table 2). According PCOS groups were compared with regard to laboratory data, ALT, GGT, and uric acid levels were higher in the hyperandrogenemic group compared to the nonhyperandrogenemic group (P=0.02, P=0.01, and P=0.009, respectively) (Table 2).
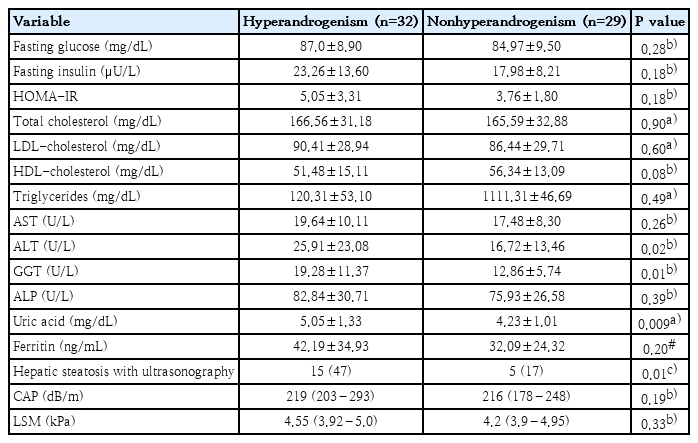
Laboratory parameters and radiological findings in PCOS group according to hyperandrogenism status
3. Radiological characteristics
The PCOS and control groups were similar with regard to USG findings. The presence of hepatic steatosis was 33% in the PCOS group and 32% in the control group (P=0.90). The mean CAP level was 232.56±59.27 dB/m and the LSM level was 4.89±1.75 kPa in the PCOS group. These values were 223.33±46.80 dB/m and 4.66±0.87 kPa in control group (P=0.46, P=0.54, respectively). The radiological characteristics of the groups have been presented in Table 3.
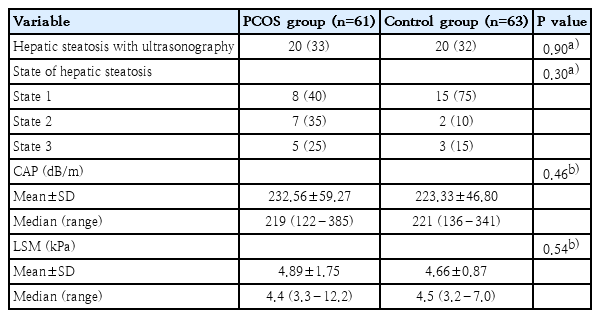
Radiological parameters of PCOS versus control groups
In the PCOS group that was detected to have NAFLD on USG, the mean CAP value was 278.10±71.90 dB/m and the mean LSM value was 6.07±2.61 kPa. These values were 263.70±41.06 dB/m and LSM 5.02±1.05 kPa, respectively (P=0.44, P=0.11, respectively). According to the ROC analysis, the cutoff value for CAP was >245 dB/m, sensitivity (95% Cl) 65 (48.3–79.4), specificity (%95 Cl) 91.6 (83.6–96.6), AUC (%95 Cl) 0.82 (0.74–0.88) and P<0.001.
While a positive correlation was determined between the CAP and LSM values, and the BMI, waist circumference , insulin, IRHOMA, TG, ALT and uric acid levels (for CAP, r=0.69, r=0.66, r=0.54, r=0.53, r=0.46, r=0.54, r=0.43, respectively; for LSM, r=0.51, r=0.45, r=0.39, r=0.42, r=0.48, r=0.61, r=0.41, respectively), there was a negative correlation with the HDL level (r=-0.32).
Discussion
A total of 124 individuals (61 patients with PCOS and 63 healthy adolescents) were included in the study. The patients and the control groups were similar with regard to age and BMI z score. Waist circumference was higher in the PCOS group. The TC, TG and, the ALT levels were found to be higher and the ALP level was lower in the PCOS group. The PCOS and control groups were similar with regard to USG findings, CAP and, the LSM values. Fifty-two percent of the PCOS group were hyperandrogenemic. Hepatic steatosis was more common in the hyperandrogenemic group on ultrasound imaging. Also, ALT, GGT, and uric acid levels were higher.
There are a limited number of studies available in the literature investigating the coexistence of PCOS and NAFLD in adolescence. In our study, hepatic steatosis was evaluated with USG and FibroScan and compared with healthy controls. Although liver biopsy is the gold standard for the detection of NAFLD, it is not a practical approach due as it is an invasive procedure. In many studies, USG is often used and aminotransferases, some markers (NAFLD liver fat score, fatty liver index, lipid accumulation product, hepatic steatosis index, etc.) and magnetic resonance spectroscopy have also been used [11-14,32-36].
In our prospective, cross-sectional study, which evaluated NAFLD according to USG, the prevalence of NAFLD was seen not to increase in adolescent PCOS patients compared to healthy controls with similar age and BMI. Vassilatou et al. [12] detected an increase in the prevalence of NAFLD in 57 premenopausal PCOS patients. In another study, the prevalence of NAFLD according to USG findings was found to increase in obese PCOS patients [14]. In a large study, Macut et al. [11] demonstrated an increase in the prevalence of NAFLD detected with a liver fat score in adults with PCOS compared to healthy controls with similar BMI. However, in the study of Tantanavipas et al. [13], the prevalence of NAFLD according to USG findings was seen not to increase in 63 adult PCOS patients. Another study also reported no increase in the prevalence of NAFLD in PCOS [37].
In addition, in the FibroScan analysis performed for assessment of NAFLD, CAP and the LSM values were found to be similar between the 2 groups. Recently, FibroScan has been widely used as an alternative to liver biopsy, both for the assessment of hepatic steatosis and hepatic fibrosis. However, the studies have been limited to PCOS patients [13,14]. In the study of Tantanavipas et al. [13], in patients who were determined to have NAFLD on USG, the sensitivity was found to be 84% and specificity was determined as 78% when CAP≥236 dB/m. In our study, according to the presence of NAFLD on USG, the cutoff value of CAP was found to be >245 dB/m, sensitivity 65 %, and specificity 91.6%. The studies in the literature were conducted with adults; the difference in CAP values in our study can be explained by our study population’s being 18 years or below. In the study by Ferraioli et al. [38] conducted with children, CAP had a high specificity for assessment of hepatic steatosis when the cutoff value was taken as 249 dB/m. This result supports our study.
A significant correlation was found between CAP and LSM levels and anthropometric measurements and laboratory findings. In particular, the increase in BMI and waist circumference was positively correlated on 2 parameters. This result supports that abdominal obesity is an important indicator of visceral adiposity. In laboratory data, a positive correlation was found between serum uric acid, insulin, IR-HOMA, TG, ALT levels with CAP and LSM levels. In many studies, it has been shown that serum uric acid level causes NAFLD through many mechanisms. Also, high TG and low HDL levels are risk factors for NAFLD. CAP value, which is a good indicator for hepatic adiposity, is positively correlated with TG level and negatively correlated with HDL level, which supports this situation. Waist circumference is usually used for the prediction of the presence of visceral steatosis [39]. In our study, waist circumference was found to be higher in PCOS patients compared to healthy controls. In previous studies, waist circumference was found to be higher in adults with PCOS compared to healthy controls and a significant correlation was shown between NAFLD and waist circumference [11,12,14]. In our study, a significant correlation was determined between CAP measurement and waist circumference. Consequently, android steatosis should be evaluated as a risk factor for metabolic disorders in patients with PCOS.
The ALT level was found to be higher in PCOS patients compared to the control group. The serum aminotransferase level is widely used in the assessment of liver injury. In many studies, the ALT levels were studied for the assessment of NAFLD in patients with PCOS. Although it varies according to serum ALT cutoff levels, abnormal ALT levels were found to be at a rate of 15%–39% [12,33,40,41]. In these studies, abnormal ALT levels were observed more frequently in obese patients [42]. The higher ALT level in the PCOS group compared to the control group with similar BMI in our study reveals hepatopathy associated with PCOS independent from obesity.
The serum GGT level was found to be similar between the 2 groups. Although a limited number of studies are available evaluating the serum GGT level, it was found to be higher in the PCOS group compared to the control, independent from obesity [43]. The increase in the serum GGT level may be an indicator of increased oxidative stress, systemic inflammation, and visceral and hepatic adiposity [43]. The ALP levels being lower in patients with PCOS, although within the normal range, compared to the control group is an interesting finding. Studies evaluating the ALP levels in PCOS and NAFLD are limited. There are also studies that found a slight increase in serum ALP levels, but did not detect any difference [25,44]. Although the clinical significance of the decrease in serum ALP level in our study is not fully known, it may be interesting to conduct further research on this subject.
In our study, the rate of NAFLD was higher in the PCOS group with hyperandrogenemia. In addition, the serum ALT, GGT and uric acid levels were higher in PCOS patients with hyperandrogenemia. In the NAFLD study of Jones et al. [36] evaluating it using magnetic resonance spectroscopy, the authors found a high rate of hepatic steatosis in PCOS patients with hyperandrogenemia. Again, in NAFLD studies that used USG for evaluation, hyperandrogenemia was shown to be a risk factor for NAFLD [12,24]. Similarly, the ALT levels were found to be high in patients with hyperandrogenemic and PCOS [12,36,45]. On the other hand, there are also studies showing that hyperandrogenemia does not increase NAFLD [13,14]. As in our study, most studies have found that hyperandrogenemia is an independent risk factor for NAFLD in PCOS patients. It should be taken into account that hyperandrogenemia will create metabolic risks in patients with PCOS. In particular, patients with hyperandrogenemia and PCOS should be followed more closely in terms of NAFLD. Although the insulin and HOMA-IR levels were similar in PCOS patients with and without hyperandrogenemia, the serum uric acid levels were higher in the hyperandrogenemic group. There are studies showing that the serum uric acid level is positively correlated with androgen levels [46]. Although there are many unknown mechanisms of the role of androgens in hyperuricemia, patients with PCOS with hyperandrogenemia should be monitored for hyperuricemia.
Liver biopsy, which is the gold standard in the evaluation of NAFLD, was not performed onany patients due to its being an invasive method. Another limitation is that abdominal USG examinations were not performed by the same radiologist. However, all patients in the study were evaluated by radiologists who were experienced in NAFLD and only performed USG examinations on pediatric patients.
In conclusion, the frequency of NAFLD was found not to increase in adolescents with PCOS. However, hyperandrogenemia was found to be a risk factor for NAFLD. PCOS patients with elevated androgen, ALT, GGT and uric acid levels should be particularly screened for NAFLD.
Notes
Conflicts of interest
No potential conflict of interest relevant to this article was reported.
Funding
This study received no specific grant from any funding agency in the public, commercial, or not-for-profit sectors.
Author Contribution
Conceptualization: OK, HAA, MK; Data curation: OK, HAA, MK; Formal analysis: OK, HAA, MK; Funding acquisition: OK, HAA, MK; Methodology: OK, HAA, MK; Project administration: OK, HAA, MK; Visualization: OK, HAA, MK; Writing-original draft: OK; Writing-review & editing: OK, HAA, MK