Comparative analysis of adolescent hypertension definitions for predicting early adulthood carotid artery intima-media thickness: Tehran lipid and glucose study
Article information
Abstract
Background
Definitions of childhood and adolescent hypertension (HTN) do not precisely elucidate the relationship between HTN and cardiovascular outcomes. Carotid intima-media thickness (CIMT), as a substitute for cardiovascular outcomes, enables the early identification of cardiovascular events throughout early adulthood.
Purpose
This study aimed to compare the ability of childhood HTN definitions to predict a high CIMT in early adulthood.
Methods
This prospective cohort study included 921 individuals aged 10–17 years from the Tehran Lipid and Glucose Study. The CIMT was measured after 18 years of follow-up. Participants were categorized into normal blood pressure (BP), high-normal BP, HTN stage 1, and HTN stage 2 groups based on the childhood HTN definitions of the 4th report, European Society of Hypertension (ESH), and American Academy of Pediatrics Clinical Practice Guidelines (AAP-CPG). Akaike information criterion (AIC) and relative efficiencies (RE) were calculated to compare the ability of each to predict a high CIMT (≥95th percentile) during early adulthood.
Results
The highest and lowest prevalence of stage 1 HTN was observed with the AAP-CPG (17.7%) and ESH (8.8%), respectively. Similarly, the highest and lowest prevalence of stage 2 HTN was noted with the AAP-CPG (1.5%) and ESH (0.8%), respectively. According to the RE values, the highest to lowest predictive abilities belonged to the 4th report, ESH, and AAP-CPG, respectively. In all models, the 4th report’s pediatric HTN definition had the lowest AIC value and offered the best predictive ability.
Conclusion
Among the various definitions of pediatric HTN, the 4th report offered the best ability to predict a high CIMT during early adulthood, followed by the ESH and AAP-CPG. Because the reference population of the 4th report includes overweight, obese, and normal- weight individuals, our findings suggest that excessive adiposity is among the main predictors of early adulthood atherosclerosis risk.
Key message
Question: What is the prevalence of HTN among adolescents enrolled in the TLGS according to 3 different accepted definitions (4th report, ESH, and AAP-CPG). Also, what is the ability of each of these definitions in predicting early adulthood CIMT, as a surrogate for cardiovascular disease events?
Finding: The highest and lowest prevalence of stage 1 HTN was observed with the AAP-CPG (17.7%) and ESH (8.8%), respectively. Similarly, the highest and lowest prevalence of stage 2 HTN was noted with the AAP-CPG (1.5%) and ESH (0.8%), respectively. The highest to lowest predictive abilities belonged to the 4th report, ESH, and AAP-CPG, respectively.
Meaning: Among the various definitions of pediatric HTN, the 4th report offered the best ability to predict a high CIMT during early adulthood, followed by the ESH and AAP-CPG.
Introduction
Hypertension (HTN), or high blood pressure (BP), has traditionally been considered to be a rare condition in children, but it is now recognized as a major global public health concern [1]. A meta-analysis study in 2019 reported that the global pooled prevalence of childhood HTN and pre-HTN in the general population was 4.0 and 9.67%, respectively [2]. According to a meta-analysis study in 2017, the prevalence of HTN among Iranian children and adolescents was estimated to be 8.9% [3]. Previous studies have debated that, children with high BP are more likely to develop HTN during adulthood [4]. Also, childhood high BP was linked to a higher risk of developing early-onset subclinical cardiovascular diseases (CVDs) during adulthood [5,6].
There is no consensus on the definition of childhood HTN. Studies on the prevalence of pediatric HTN have reported different results based on various definitions used [7,8]. The Fourth (4th) Report on the Diagnosis, Evaluation, and Treatment of High BP in Children and Adolescents, was released by the US National Heart, Lung, and Blood Institute in 2004 [9]. The European Society of Hypertension (ESH) and the American Academy of Pediatrics Clinical Practice Guidelines (AAP-CPG) updated their childhood HTN therapeutic guidelines in 2016 and 2017, respectively [10,11].
Nevertheless, the existing definitions of pediatric HTN have used a statistical approach and overlooked the link between HTN and cardiovascular outcomes. Therefore, as for adults, we need to precisely draw the line interconnecting childhood HTN definitions and CVD events [9-11]. However, since CVD events are not common during childhood, an appropriate surrogate should be applied. Carotid intima-media thickness (CIMT)is a noninvasive and reliable surrogate for CVD risk, enabling the early detection of impending CVD events in early adulthood [12,13]. The usefulness of CIMT as an independent indicator of future CVD events has been established [14]. Nonetheless, few studies have compared the performance of HTN definitions provided by the United States 4th report and updated United States, Chinese, and international standards in predicting adulthood CIMT [8,15-17].
It is essential to screen and early identify children and adolescents exposed to a high risk of CVDs to reduce the burden of disease by implementing effective interventions. The main objective of this study was to investigate the prevalence of HTN among a subsample of Tehranian adolescents enrolled in the Tehran Lipid and Glucose Study (TLGS) according to 3 different accepted definitions. Also, we compared the performance of each of these definitions in predicting early adulthood CIMT, as a surrogate for CVD events.
Methods
1. Study population
The participants of the current cohort study were selected from individuals enrolled in the TLGS, a community-based prospective study designed to identify the risk factors and outcomes of noncommunicable diseases in Tehran, Iran [18]. A multistep random sampling method was employed in the original study to recruit subjects from District 13 of Tehran, the capital city of Iran, so a total of 15,005 individuals aged ≥3 years old were selected to enter the TLGS. These individuals are regularly followed up every 3 years to update their demographic, clinical, biochemical, and anthropometric data and any lifestyle changes. The baseline cross-sectional survey in TLGS was conducted from 1999 to 2001, followed by subsequent prospective follow-up surveys (i.e., phase II: 2002–2005, phase III: 2006–2008, phase IV: 2009–2011, phase V: 2012–2015, and phase VI: 2016–2019).
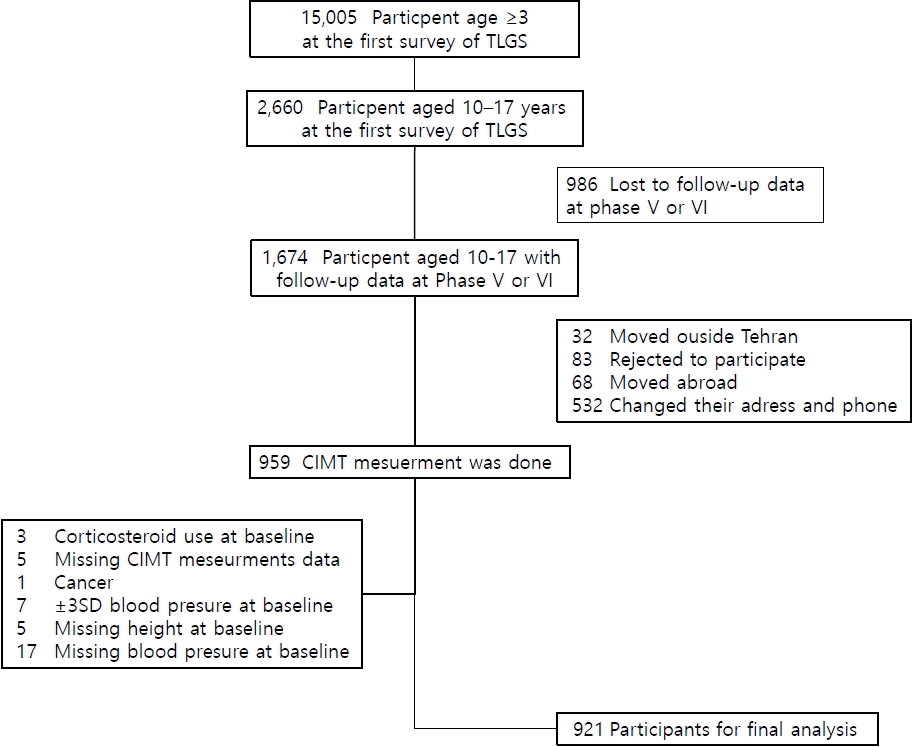
In the present study, eligible subjects were recruited for CIMT measurements through telephone calls. Out of 1674 eligible participants (aged 10–17 years at the baseline and having their data available in phases V or VI), 759 individuals did not participate in CIMT measurement, so the remaining 959 participants were subjected to CIMT measurement. Measurement of CIMT was performed between February 2017 and October 2019. The median duration of follow-up was 18 years (17.8–18.8). We excluded 38 subjects because of cancer (n=1), chronic use of corticosteroids (n=3), extreme BP values (exceeding±3 standard deviation [SD]) (n=7), missing BP data at the baseline (n=22), and missing CIMT data (n=5). Eventually, 921 participants were included in the final analysis. Lost to follow-up subjects were regarded as 10- to 17-year-old participants in phase I who were not included in phase V or VI(Fig. 1).
2. Measurements
TLGS protocol and laboratory techniques were described in detail elsewhere [18].
1) Anthropometric and laboratory measurements
Qualified healthcare experts obtained demographic and anthropometric data based on World Health Organization guidelines body mass index (BMI) was calculated.
To measure fasting plasma glucose (FPG) and lipid levels, a blood sample was taken at the TLGS Research Laboratory between 7 AM and 9 AM after a 12- to 14-hour fasting period. Total cholesterol (TC), high-density lipoprotein cholesterol, triglyceride, low-density lipoprotein cholesterol (LDL-C) and FPG were measured.
2) BP measurement
The participants were requested to be seated still for 15 minutes, and then a qualified physician measured their BP twice using a mercury sphygmomanometer calibrated by the Iranian Institute of Standards and Industrial Research. Depending on the participant’s arm circumference, a pediatric, standard adult, or large cuff was employed. We did not take additional measures for those with a >3 mmHg difference between their first and second systolic blood pressure (SBP) or diastolic blood pressure (DBP) measurements. A standard pediatric sphygmomanometer cuff was used to measure adolescents’ BP, covering two-thirds of a child’s arm. The right arm was positioned with the cuff at heart level, and it was inflated as quickly as possible until the cuff pressure was 30 mmHg higher than the point at which the radial pulse ceased to exist. The participant’s BP was recorded as the mean of the 2 measurements separated by at least a 30-second gap. When the cuff was deflated at a rate of 2–3 mm per second, systolic BP was defined as the onset of the first sound (Korotkoff phase 1) and diastolic BP as the disappearance of the sound (Korotkoff phase 5).
3) CIMT measurement
A linear 7.5- to 10-MHz transducer was used to conduct an ultrasound examination (Samsung Medison SonoAceR3 ultrasound machine). The position of subjects during the examination was supine, with the neck extended and slightly turned to the other side. The initial carotid scan was carried out in the transverse plane throughout the artery to assess the subject’s anatomy, detect any atherosclerotic plaques, and record the far or near wall’s maximum thickening. The artery was then scanned longitudinally from various angles. Measurements were carried out in segments of plaque-free arteries and fulfilled the criteria of optimal B-mode imaging as mentioned below.
The optimal grey scale imaging of the carotid artery was defined as a clear visualization of far-wall arterial interfaces with a completely anechoic luminal content and was saved for subsequent measurements. The scan depth was adjusted so that the artery’s lumen would be in the center of the image and the focal zone would be positioned at the arterial lumen level. CIMT is typically described as a hypo-echoic band between the echogenic intimal and adventitial surfaces of an artery’s wall. On both sides, 3 locations of the common carotid artery were used to measure the distance between the leading edge of the first and second echogenic lines of the far walls of the distal segment and the average value was taken as the final size for the side. Subjects who met the optimal technique and image criteria were sporadically measured for the CIMT of the internal carotid artery and carotid bulb on both sides and the carotid bulb. The left common carotid artery measures were utilized in the current investigation to define a high CIMT and to investigate its association with BP values in adolescents.
To assess reliability agreement, CIMT was measured by 2 radiologists in a subsample of 30 persons (66.7% female; mean age, 41.7±10.7 years; and mean BMI, 24.4±5.5 kg/m2). Calculating the interclass correlation coefficient (ICC) allowed us to assess the levels of agreement between radiologists’ CIMT measurements. A 2-way mixed-effects model in IBM SPSS Statistics ver. 20.0 (IBM Co., Armonk, NY, USA) was used to calculate the ICCs and 95% confidence intervals (CIs). The ICC values were as ICC=0.8 with a 95% CI of 0.5 to 0.9. Typically, ICC ranges from 0 to 1, with values between 0.75 and 0.9, denoting good reliability [16]. Additionally, there was a 0.08 (0.12) mm mean difference (SD) in CIMT between the readers.
3. Definitions and classifications
1) Blood pressure
The definitions applied were as follows:
(1) 4th report [9]: (a) normal BP as <90th percentile, (b) pre-HTN (considered equivalent to high-normal BP) as ≥90th percentile, and <95th percentile or SBP/DBP ≥120/80 mmHg, (c) HTN stage 1 as ≥95th percentile and <99th percentile+5 mmHg, and (d) HTN stage 2 as ≥99th percentile+5 mmHg. According to the National High Blood Pressure Education Program, the percentiles were adjusted for sex, height, and age.
(2) ESH [19]: The ESH has recommended the same definitions as the 4th report for individuals aged 0–15 years, but for adolescents aged ≥16 years, the following definitions were employed:(a) normal BP as SBP/DBP <130/85 mmHg, (b) high-normal BP (considered equivalent to elevated BP) as (130−139)/(85−89) mmHg, (c) HTN stage 1 as (140−159)/(90−99) mmHg, and (d) HTN stage 2 as ≥160/100 mmHg.
(3) AAP-CPG (updated United States reference) (10): AAP-CPG suggested BP nomograms developed from normal-weight individuals exclusively. This approach divides individuals into <13-year-olds and ≥13-year- olds groups. For those younger than 13 years, normal BP and elevated BP are defined similar to that of the 4th report; however, HTN stage 1 is considered BP ≥95th percentile and <95th percentile+12 mmHg, and HTN stage 2 as BP ≥95th percentile+12 mmHg. For those aged 13 years and older, normal BP is defined as <(120/<80) mmHg, high-normal BP as (120/<80) to (129/<80) mmHg, HTN stage 1 as 130/80 to 139/89 mmHg, and HTN stage 2 as ≥140/90 mmHg. Blood pressure percentiles used in this study were adjusted for the age and height of adolescents in Tehran as reported by Ataei et al. [20].
According to the 3 above-mentioned definitions, our participants were classified into 4 groups: normal BP, high-normal blood pressure, HTN stage 1, and HTN stage 2. For consistency, elevated BP and pre-HTN were designated as “high-normal BP.”
2) CIMT classification
High CIMT, a surrogate for subclinical atherosclerosis, was defined as CIMT with at least 95th percentile values for sex and age obtained from a study within TLGS on 1450 Tehranian adults. The 95th percentile for males and females was 0.70 mm for both genders in the 20- to 30-year-old age range, while it was 0.70 and 0.73 mm in the 30- to 40-year-old age range for males and females, respectively [21].
4. Statistical analysis
All normally distributed continuous variables were expressed as mean±SD. Otherwise, skewed-distributed continuous variables were reported as median and 25–75 interquartile range. Categorical baseline variables were shown as frequency (percentages). Differences in baseline characteristics between HTN groups were tested using 1-way analysis of variance, Kruskal-Wallis, and chi-square test for normally distributed continuous, skewed continuous, and categorical variables, respectively. The association between pediatric HTN definitions and adulthood CIMT was explored by linear regression analysis to calculate the coefficient (β) with standard error. Linear regression models were adjusted for potential confounders, including baseline demographics, family history of CVD, smoking, and adulthood BMI. Akaike information criterion (AIC) was used to evaluate the coefficients of different regression models to assess the impact of HTN groups on CIMT, where lower AIC values demonstrated a better fit. relative efficiency (RE), as calculated by dividing the mean squared error of estimates of 2 models, was used to compare the efficiency of parameter estimates obtained from different models. All statistical analyses were performed in Stata 14 (Stata, College Station, TX, USA); the statistical significance level was set at P<0.05 (2-tailed).
Results
Out of 2641 participants who had follow-up data at Phases V and VI of TLGS, 921 individuals aged 10 to 17 years, including 484 boys (52.0%), were included in our study. We compared the baseline characteristics of the follow-up and lost-to-follow-up groups and found no significant difference regarding clinical and demographic variables between the 2 groups except for mean age, which was 13.4±2.2 years for the follow-up group and 14.3±2.5 years for the lost-to-follow-up group (P<0.05). Therefore, the results of this study could be considered representative of the total TLGS population (Supplementary Table 1).
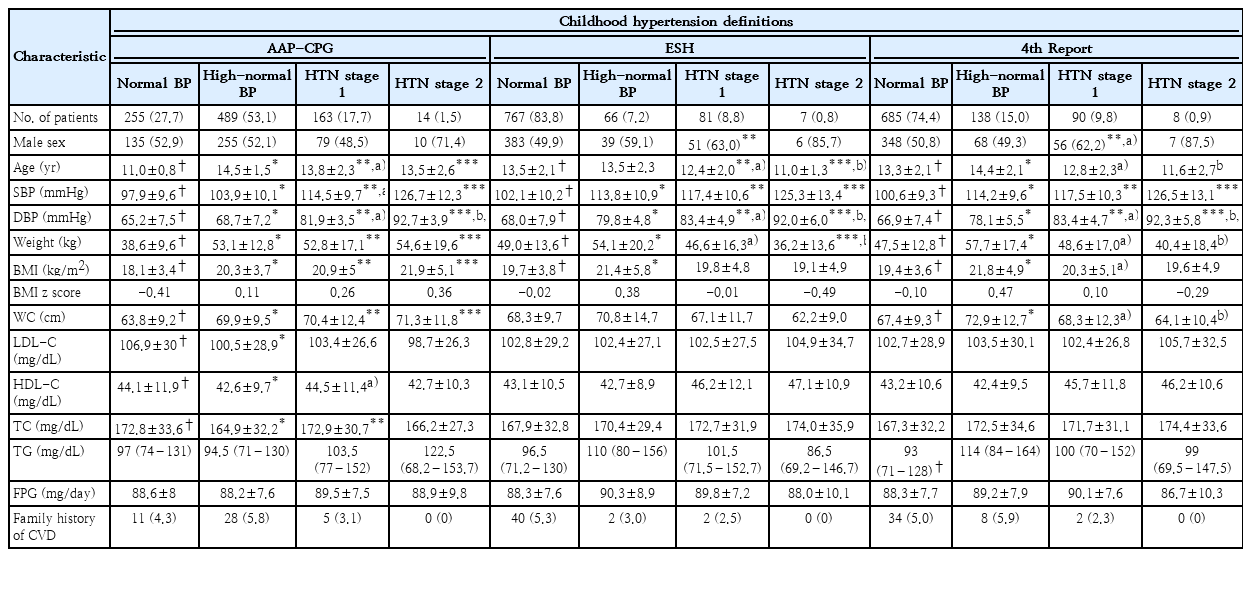
Table 1 displays our study participants’ baseline cardiometabolic profile and characteristics. Age, SBP, DBP, BMI, and weight were significantly different between the 4 groups of childhood blood pressure by all 3 definitions used for categorization. Waist circumference; however, showed a significant difference between the 4 study groups based on the definitions provided by the AAP-CPG and 4th report systems, but not in ESH. A significant difference in LDL and TC was observed only in the AAP-CPG definition. Other features showed no significant difference between the study groups. The overall prevalence of high- blood pressure was 51.6%, 7.0%, and 14.6%, the prevalence of stage 1 HTN was 17.3%, 8.7%, and 9.6%, and stage 2 HTN prevalence was obtained as 1.8%, 0.9%, and 1.0% for AAP-CPG, ESH, and 4th report classification systems respectively. The frequency of normal linear BP among adolescents was the lowest according to AAP-CPG compared to the ESH and 4th report (Table 1).
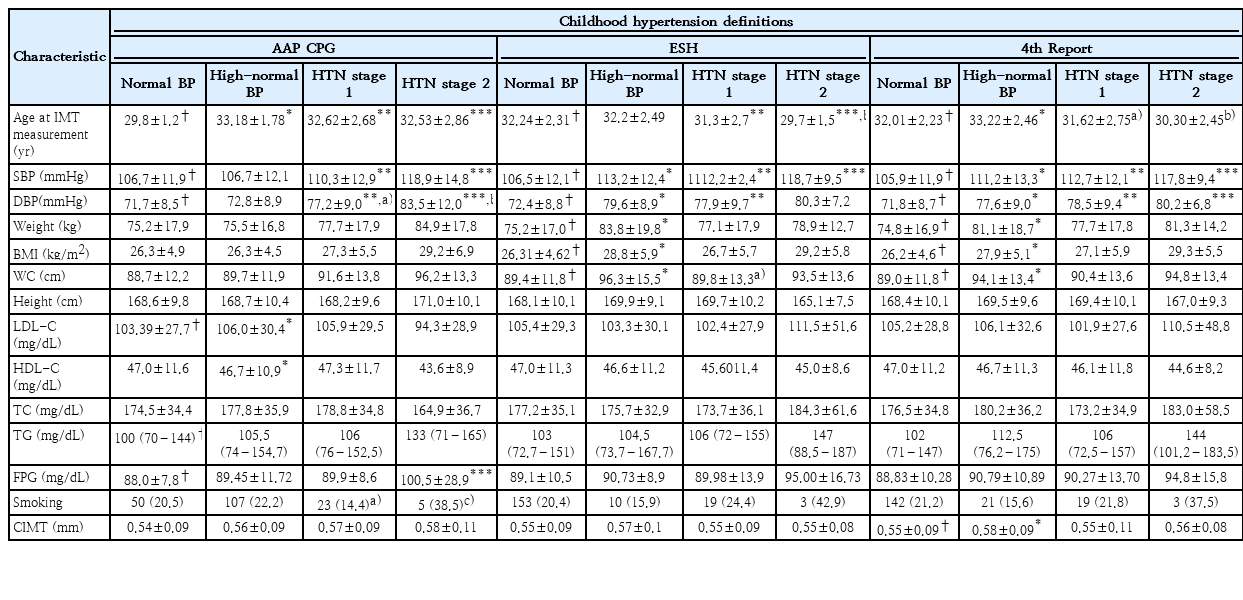
Table 2 demonstrates the characteristics of participants in phases V or VI (end of the follow-up). Final SBP and DBP values were significantly different across the 4 study groups regarding all 3 definition systems. A difference in CIMT was observed between the study groups only when the 4th report definition was used, indicating a significant difference between the high-normal and normal BP groups. However, based on AAP-CPG and ESH classification systems, no significant difference was observed in CIMT between the 4 study groups (Fig. 2).
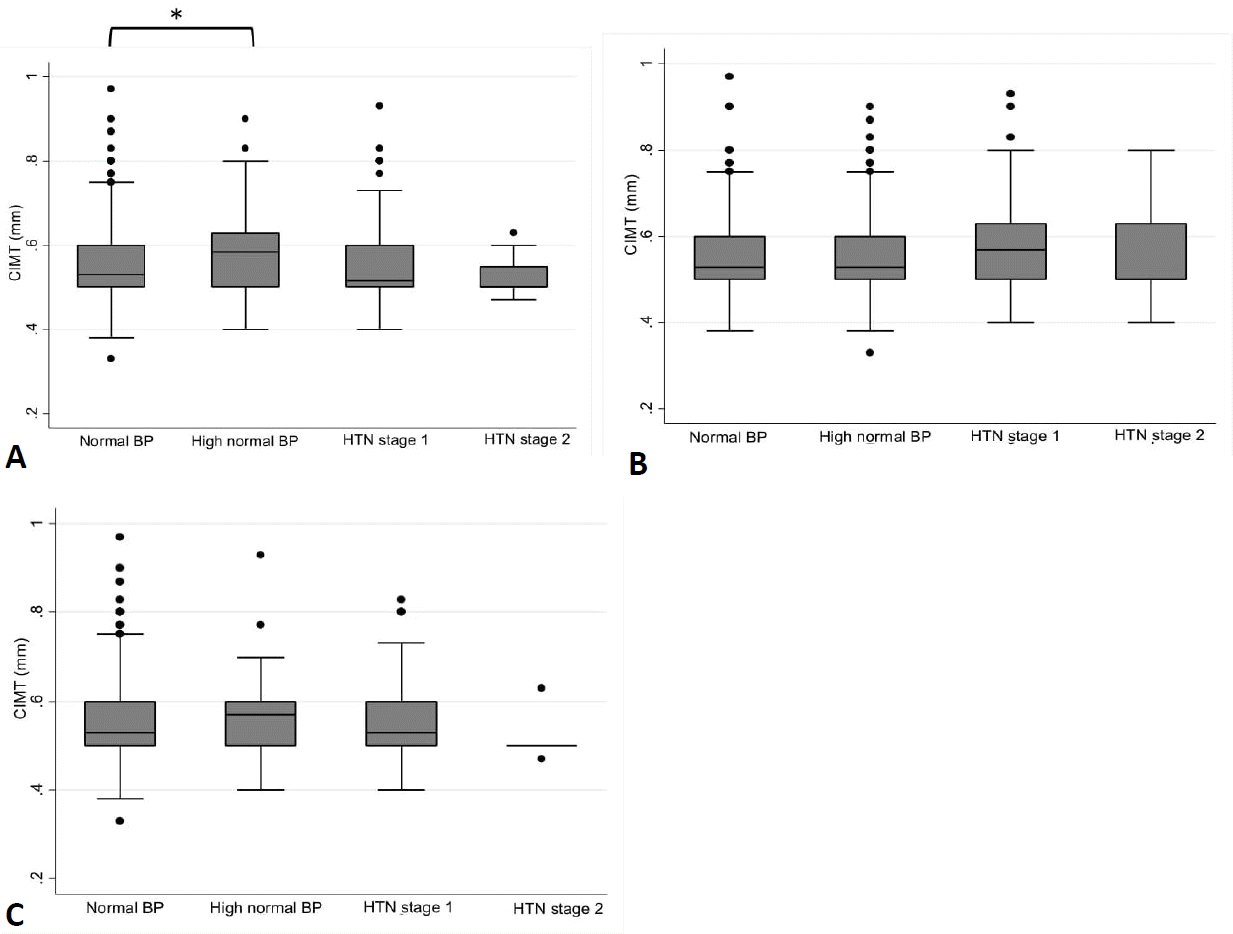
CIMT classification based on HTN definitions in 4th report (A), American Academy of Pediatrics Clinical Practice Guidelines (B), and European Society of Hypertension (C). CIMT, carotid intima-media thickness; BP, blood pressure; HTN, hypertension.
*P<0.05, normal blood pressure versus high-normal blood pressure.
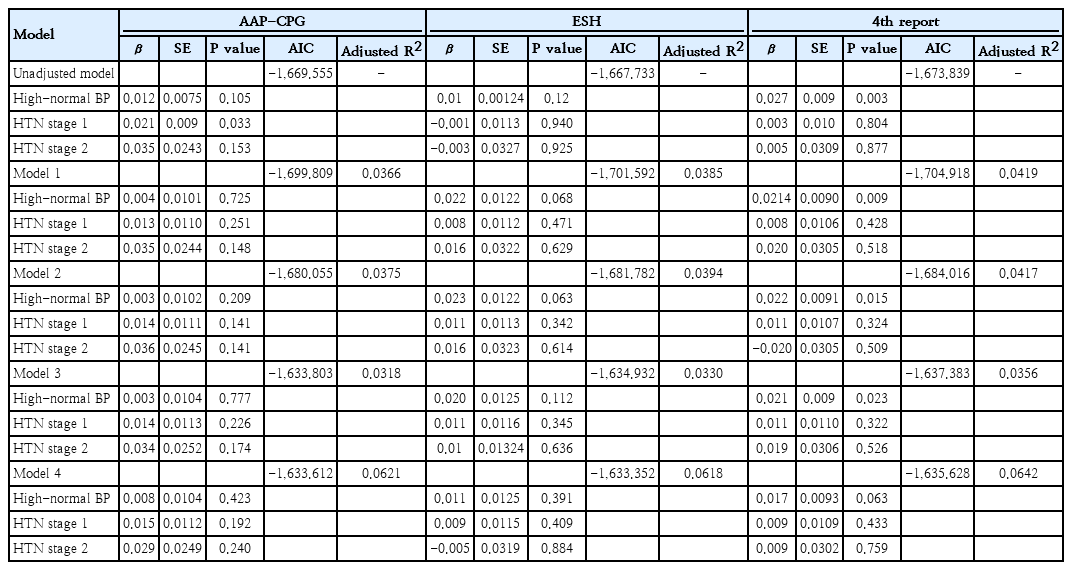
We further conducted multiple linear analyses adjusted for baseline demographics (family history of CVD, smoking, and adulthood BMI) to ascertain the best model to predict adulthood CIMT. We calculated AICs for models, considering that lower AIC values would demonstrate a better fit. In all models, the 4th report definition represented the lowest AIC among all 3 definitions, and AAP-CPG offered the highest AIC values in model numbers 1, 2, and 3. Also, ESH had the highest AIC in the unadjusted models, as well as in model No. 4 (Table 3).
We also calculated RE to compare the ability of the AAP-CPG, ESH, and 4th report in adulthood CIMT discrimination. The results showed that RE values of ESH or AAP-CPG with the 4th report were >1 in all models, indicating that the 4th report discriminates adulthood CIMT more efficiently than the other 2 definitions. Also, RE values of AAP-CPG vs. ESH were >1 in model numbers 1, 2, and 3, demonstrating that ESH could better discriminate adulthood CIMT compared to AAP-CPG (Table 4). Therefore, based on RE values, the discrimination ability of definitions could be ranked from the highest to the lowest as 4th report, ESH, and AAP-CPG, respectively, except for the unadjusted model and model No. 4 with the ranking of 4th report, AAP-CPG, and ESH, respectively.
Discussion
In the current study, we assessed the ability of common childhood BP classification systems to predict adulthood CIMT as a surrogate for subclinical atherosclerosis during an 18-year follow-up. According to our findings, among the 4th report, AAP-CPG, and ESH classification systems, the 4th report had the highest ability to predict high CIMT (≥95th percentile) during early adulthood, followed by the ESH and AAP-CPG, respectively.
Using different BP classification systems leads to different epidemiologic findings on childhood HTN [7,8,17,22-29]. According to AAP’s definitions, the overall prevalence of HTN increased within subgroups based on age, sex, weight, and height in each survey [7,8,17,22-29]. The findings of Fan and Zhang [22] study on 4,276 individuals in China over a follow-up period of 4.6 years revealed significant differences in the prevalence of childhood HTN based on different classification systems; AAP, ESH, and 4th report definitions. They reported that more children were classified as hypertensive when applying the AAP definition. Similar findings emerged from subgroup analyses based on sex, age, height, and weight status. Another study by Zhou et al. [30] on 28,715 adolescents in China showed a higher prevalence of hypertensive cases using AAP-CPG compared to 2018 Chinese definitions for adults and children. Consistently, in our study, the highest prevalence (17.7%) of stage 1 HTN was observed according to AAP-CPG while the lowest (8.8%) was according to ESH. Also, the highest prevalence (1.5%) of stage 2 HTN was related to AAP-CPG and the lowest (0.8%) to ESH.
Abnormal blood pressure during childhood and adolescence can affect cardiovascular outcomes later in life [31-33]. Previous cohort studies have demonstrated that high blood pressure during adolescence and childhood is linked to CVD and early death [34-36]. An autopsy investigation on 93 individuals in Bogalusa, revealed a correlation between childhood cardiovascular risk factors, including lipids, smoking, and BP, and evidence of atherosclerosis. The extent of atherosclerotic lesions was associated with SBP and DBP, various lipid parameters, and BMI. The presence of multiple cardiovascular risk factors during childhood was linked to a greater risk of atherosclerosis [33].
It is important to know that HTN definitions currently in use for children and adolescents have a statistical basis but do not consider the relationship between HTN and cardiovascular outcomes. Therefore, it is necessary to establish a connection between children's or adolescents' BP categories and cardiovascular outcomes in adulthood [9-11]; however, because cardiovascular events are infrequent in early adulthood, it would be difficult to assess such a connection. A potential solution is to address this link using a surrogate marker of cardiovascular outcomes. A noninvasive and reliable surrogate for cardiovascular risk is CIMT, which enables the early identification of cardiovascular risk factors in early adulthood [12,13]. CIMT is a recognized contributor to early-stage atherosclerosis and a predictor of cardiovascular outcomes [14]. In our study, the difference in CIMT between 4 BP groups was only observed when 4th report definition was applied, revealing a significant difference between the high-normal BP and normal BP. However, based on definitions provided by the AAP-CPG and ESH classification systems, no significant difference was observed in CIMT between the 4 BP groups. This may be justifiable by the fact that the reference population of the 4th report included overweight and obese children as well, which might show a possible connection between childhood excess adiposity and increased CIMT in early adulthood in this definition. The Muscatine Study and Bogalusa Heart Study found that childhood BMI was linked to adulthood CIMT, while SBP did not show the same association [37,38].
Cardiovascular Risk Cohort Study suggested that childhood BMI and SBP could predict an increased CIMT during adulthood [39,40]. Consistent with these findings, Yan et al. [41] reported that childhood BMI and SBP, as well as the cumulative values of these parameters from childhood to adulthood, were significant predictors of elevated CIMT in adulthood. Previous studies have also shown that other childhood risk factors, such as LDL-C, TC, and smoking, can predict adulthood CIMT [37,38,40].
Limited prospective studies investigated the performance of childhood BP definitions in predicting cardiovascular outcomes. Earlier cross-sectional studies demonstrated equal performance for the AAP and ESH definitions in recognizing children with HTN who are at an elevated risk of target organ damage [8,17]. Compared to the 4th report, the AAP definition can better identify children with cardiometabolic risk factors and predict cardiovascular outcomes in adulthood [15,16]. The study of Fan et al. [15] on 1,177 individuals in China compared the ability of AAP-CPG, 4th report, Chinese criteria, and international standards to predict adulthood HTN and subclinical CVD with the pediatric BP definitions. They assessed subclinical CVD in adults by carotid-femoral pulse wave velocity (cfPWV) and measured CIMT and left ventricular mass index (LVMI). The prevalence of pediatric elevated BP was significantly higher according to the Chinese standards compared to the 4th report, the updated US standards, and the international standards. Children with elevated BP, according to each of the 4 standards and definitions were more likely to also meet the criteria for adult HTN, high cfPWV, and high LVMI; however, the greater risk of high CIMT in adulthood could only be predicted by Chinese and AAP-CPG standards. Thus, according to Fan et al. [15], the Chinese standards performed in part similar to or even better than 3 other standards in predicting HTN and subclinical CVD in adulthood.
In comparison, our results showed that the 4th report was the best model for predicting adulthood CIMT, followed by ESH and AAP-CPG, respectively. The reference population of the 4th report included individuals with all weight categories, including overweight and obese subjects, which could lead to the association. Thus, the better discriminative ability of the 4th report in predicting high CIMT during early adulthood may highlight the role of childhood excess adiposity as the primary predictor of future atherosclerotic risk.
The strengths of this investigation were its prospective design, long follow-up duration, application of CIMT as a noninvasive outcome surrogate, and use of various statistical methods to compare the performance of different childhood BP definitions in predicting atherosclerotic risk. However, several limitations can also be noted. We could not include some variables with probable confounding effects, including physical activity, BMI changes, dietary habits, and socioeconomic status. Additionally, this study was conducted on data belonging to a population in the capital city of Iran, so our findings might not be nationally representative.
In conclusion, the study's findings indicate that pediatric BP definitions embedded in the 4th report could better predict the risk of subclinical atherosclerosis during adulthood compared to equivalent systems (ESH andAAP-CPG). In terms of discrimination, the weakest predictive ability belonged to the AAP-CPG. However, a higher prevalence of childhood HTN was noticed when we used the AAP-CPG definition. This discrepancy underscores the importance of monitoring different factors, including BMI changes when evaluating childhood HTN and subsequent cardiovascular outcomes. Changes in BMI are recognized to affect the prevalence of childhood HTN and the discriminative ability of various BP classification systems. Although BMI changes were not monitored in our study, future investigations should examine the relationship between childhood HTN and BMI changes to provide a more comprehensive understanding of cardiovascular risk factors from early ages. According to our study, the 4th report definition could be a superior system to control childhood HTN nationally and decrease cardiovascular events in adulthood. More studies in different geographic regions are required to compare the performance of the childhood BP definitions in discriminating adulthood CIMT.
Supplementary materials
Supplementary Table 1 can be found via https://doi.org/10.3345/cep.2024.00248.
Supplementary Table 1. Comparison of baseline characteristics among the followed group and loss to the follow-up group
cep-2024-00248-Supplementary-Table-1.pdfNotes
Conflicts of interest
The authors declare no competing interests.
Funding
This study received no specific grant from any funding agency in the public, commercial, or not-for-profit sectors.
Author contribution
Conceptualization: FH; Data curation: MB, MM; Formal analysis: MM; Project administration: MV; Visualization: PD, MM; Writing-original draft: SY; Writing-review & editing: MB, MV, BA, FA, PD, FH
Acknowledgements
We thank all adolescents and families who participated in the study. We would like to thank the staff of the TLGS study for their important contributions.

