Anthropometric trajectories of Korean children and adolescents with severe obesity
Article information

Abstract
Background
The burden of severe pediatric obesity is increasing globally, including in South Korea, and associated with metabolic and cardiovascular complications. However, longitudinal data of Korean children with severe obesity are limited.
Purpose
This study evaluated the changes in body mass index (BMI) and associated metabolic syndrome components in children and adolescents with severe obesity managed without pharmacological or surgical treatment.
Methods
We retrospectively reviewed participants diagnosed with severe obesity (BMI ≥120% of the 95th percentile) before the age of 18 years at 3 medical centers in 2017–2024. Participants with more than 1 year of follow-up were included. Management consisted exclusively of lifestyle modifications, including nutritional counseling and physician-led education on physical activity, screen time, and sleep. Patients with chronic illnesses, with psychiatric disorders, or who were taking medications that affect weight were excluded. The primary outcome was the change in BMI z score from baseline to the last visit. Predictors of a change in the BMI z score were analyzed using multivariable linear regression with adjustment for age, sex, pubertal stage, baseline BMI z score, and follow-up duration and frequency.
Results
Among 124 participants (mean age, 9.69±3.39 years; 61.3% boys) followed for a mean duration of 2.64±1.51 years, BMI z scores significantly decreased (from 3.68±0.75 to a mean change of -0.27±0.79, P<0.001). Younger age and male sex were associated with greater reductions in BMI z scores. However, most participants remained severely obese. Except for modest improvements in liver transaminase levels, no substantial differences were observed in other metabolic syndrome components.
Conclusion
Lifestyle modification resulted in a modest BMI z score reduction; however, most participants remained severely obese with no significant improvements in most metabolic syndrome components. These findings underscore the need for early and intensive interventions for pediatric obesity.
Key message
Question: How do body mass index (BMI) and metabolic markers change over time in severely obese Korean children and adolescents receiving only lifestyle modifications?
Finding: Among 124 participants, BMI z scores decreased modestly over 2.6 years, primarily in younger prepubertal boys. However, most remained severely obese, with minimal improvement in body composition or metabolic markers.
Meaning: Lifestyle interventions alone have limited efficacy for severe pediatric obesity. Early and more intensive treatments are required.
Graphical abstract
Introduction
The global prevalence of childhood obesity has been rising dramatically since the 1990s—nearly tripling worldwide—and this trend is expected to continue in the coming decades [1]. South Korea has experienced a similar upward trend, with increasing rates of severe pediatric obesity [2,3]. Obesity during childhood and adolescence is a major public health concern, owing to its strong association with metabolic disorders such as dyslipidemia, hypertension, metabolic dysfunction-associated steatotic liver disease (MASLD), and type 2 diabetes, as well as mental health problems and impaired quality of life [4-6].
Severe obesity in children and adolescents, defined as a body mass index (BMI) ≥120% of the age- and sex-specific 95th percentile, is further subclassified into class 2 obesity (120%–140% of the 95th percentile) and class 3 obesity (≥140% of the 95th percentile) [7]. This condition presents even greater health risks, including cardiovascular disease, insulin resistance, and early atherosclerosis [7-13]. Notably, children with severe obesity are at an increased risk of persisting obesity into adulthood, thereby raising their lifelong risk of chronic health conditions [14,15]. Characterizing individual anthropometric trajectories can help predict long-term outcomes and optimize early intervention strategies [16-18].
Although BMI remains a widely used metric in obesity research, waist-height ratio (WHtR) has been recognized as a complementary index that better reflects visceral adiposity and correlates with the risk of metabolic syndrome [19-21]. Tracking these indicators can enhance our understanding of obesity progression and help identify high-risk subgroups.
Despite the growing burden of severe pediatric obesity, longitudinal data on its natural history and clinical course among Korean children remain limited. This study aimed to evaluate longitudinal trajectories of BMI and WHtR in children and adolescents newly diagnosed with severe obesity, in the absence of pharmacologic or surgical intervention. We further assessed the real-world effectiveness of conservative management for severe pediatric obesity using a multicenter cohort of participants receiving outpatient lifestyle intervention alone.
Methods
1. Study design and participants
This retrospective observational study included pediatric participants aged <18 years who were newly diagnosed with severe obesity at Seoul National University Bundang Hospital, Soonchunhyang University Bucheon Hospital, and Inje University Ilsan Paik Hospital between June 2017 and February 2024.
This study was approved by the institutional review boards (IRBs) of all participating hospitals—Seoul National University Bundang Hospital (IRB No. B-2506-978-102), Soonchunhyang University Bucheon Hospital (IRB No. SCHBC 2025-09-011), and Ilsan Paik Hospital (IRB No. ISPAIK 2025-10-032)—and was conducted in accordance with the principles of the Declaration of Helsinki. Informed consent was not required because this study involved retrospective analysis of de-identified data, in accordance with institutional policies.
Participants with at least one year follow-up after the diagnosis of severe obesity were enrolled. Exclusion criteria were (1) prior use of medications that could affect growth or weight, such as growth hormone, gonadotropin-releasing hormone agonists, or corticosteroids; (2) diagnosis of diabetes mellitus, thyroid disease, or congenital or chronic systemic conditions such as leukemia, osteosarcoma, chronic kidney disease, nephrotic syndrome, or Down syndrome; (3) prior use of anti-obesity pharmacotherapy, (4) history of bariatric surgery, or (5) presence of psychiatric disorders. After applying these criteria, 124 participants were included in the final analysis (Supplementary Fig. 1).
Participants received routine lifestyle and dietary interventions during follow-up visits every 2–6 months. Dietary counseling by a dietitian was generally provided at diagnosis, with 1–2 additional sessions offered as required. At each subsequent visit, pediatric endocrinologists provided consistent lifestyle education. The counseling focused on age- and weight-appropriate nutritional guidance and specific lifestyle modifications, including limiting screen time to less than 2 hours per day, engaging in at least 30 minutes of daily physical activity, and ensuring adequate sleep.
2. Data collection
Anthropometric measurements including height, weight, and waist circumference (WC), and pubertal stage; were measured at each outpatient visit by the attending pediatric endocrinologists. Height was measured to the nearest 0.1 cm using a stadiometer (Seca 213, Seca 216; Seca, Germany), and weight was measured to the nearest 0.1 kg using an electronic balance (GL-310B, GL-6000S; Gtech, Korea). WC was measured to the nearest 0.1 cm using a tape measure (Rollfix; Hoechstmass Balzer GmbH, Germany) at the midpoint between the lowest margin of the rib and the highest margin of the iliac crest during expiration. Pubertal stage was assessed according to the Tanner staging system based on breast development in girls and genital development in boys [22,23].
Observations were categorized as baseline (initial), final (last follow-up), and one or more intermediate visits conducted approximately every 2–6 months. These intermediate data points were retained for longitudinal analysis of anthropometric trajectories over time. BMI and WC z scores were calculated using reference data derived from Korean children and adolescents [21,24].
Blood pressure (systolic and diastolic, measured as the average of 3 seated readings after at least 5 minutes of rest) and metabolic parameters—including fasting blood glucose, total cholesterol, triglycerides, high-density lipoprotein cholesterol (HDL-C), low-density lipoprotein cholesterol (LDL-C), aspartate aminotransferase (AST), alanine aminotransferase (ALT), and uric acid—were evaluated at the baseline visit for all participants with available data to characterize the initial metabolic status of the cohort. To assess longitudinal changes in metabolic profiles, data were analyzed in a subset of participants who had complete metabolic syndrome-related indicators available from no less than 2 time points at least 6 months apart; specifically, this analysis was restricted to participants aged ≥10 years, for whom the criteria for metabolic syndrome were applicable. For these participants, the earliest and latest available data during the follow-up period were analyzed. Similarly, body composition indices—including body fat percentage and skeletal muscle mass—were measured using bioelectrical impedance analysis (InBody 570; InBody Co., Korea) in participants with ≥2 measurements obtained at least 6 months apart. For these subsets, the first and last available results were included in the analysis. These metabolic and body composition assessments were performed based on data availability in a real-world clinical setting, where initial and repeat laboratory tests and bioelectrical impedance analyses were conducted at the discretion of the attending physician and subject to parental consent. Metabolic syndrome was defined according to the International Diabetes Federation criteria [25].
3. Statistical analysis
All analyses were conducted using R ver. 4.5.0 (R Foundation for Statistical Computing, Austria). Baseline characteristics were compared between sexes and groups defined by BMI z score change (Improved vs. not improved) using the independent t test or Mann-Whitney U test for continuous variables, depending on normality, and Fisher exact test for categorical variables. To account for the potential confounding effect of age, analysis of covariance (ANCOVA) with age at diagnosis as a covariate was additionally performed for these comparisons to assess metabolic parameters. The Improved group was defined as participants with any decrease in BMI z score between the initial and last visits, while the Not improved group included those with maintained or increased BMI z scores.
BMI z score trajectories were plotted across all visits, with smoothed curves generated using locally estimated scatterplot smoothing (LOESS) regression. Similar LOESS plots for WC and WtHR z scores were stratified by sex. Transitions in obesity classes between the initial and last visits were visualized using a Sankey diagram, illustrating individual-level changes in obesity severity. Changes in BMI z score were analyzed using the paired Wilcoxon signed-rank test, stratified by sex, baseline BMI z score category, age group, and pubertal stage at diagnosis. Multivariable linear regression and linear mixed-effects model with participant-level random intercepts were used to identify predictors of BMI z score change over time, with sex, age, pubertal stage, baseline BMI z score, follow-up duration, and visit frequency as covariates.
Changes in body composition parameters were analyzed using the paired Wilcoxon signed-rank test among participants with available data. Comparisons between participants with and without body composition data were performed using the Welch t test. Changes in metabolic syndrome-related indicators—including WC z score, blood pressure, fasting blood glucose, glycated hemoglobin (HbA1c), total cholesterol, triglycerides, HDL-C, LDL-C, AST, ALT, and uric acid—were analyzed using paired t test or Wilcoxon signed-rank test among participants with available data, and categorical variables were compared using the McNemar test. Log-transformation was applied to skewed variables (total cholesterol, triglycerides, HDL-C, LDL-C, AST, and ALT) before comparison.
Results
1. Baseline characteristics
A total of 124 participants (boys, 61.3%) were included in the study. The mean age at diagnosis was 9.69±3.39 years, and girls were significantly younger than boys (P=0.044); however, pubertal stage distribution did not differ significantly by sex. The mean baseline BMI was 29.14±5.05 kg/ m², corresponding to a mean BMI z score of 3.68±0.75. Boys had a higher mean BMI than girls (P=0.001), whereas BMI z scores were comparable between the sexes. Among participants with available waist measurements (n=69), the mean WC was 88.22±13.92 cm, with a mean WC z score of 3.03±0.47. The mean WtHR was 0.63±0.05, with a corresponding WtHR z score of 3.11±0.52. WC and WtHR z scores did not differ significantly by sex. Regarding obesity severity, 80.6% of participants had class 2 obesity and 19.4% had class 3 obesity, with no significant sex difference. The mean follow-up duration was 2.64±1.51 years, with an average visit frequency of 2.33±0.92 visits per year, both comparable between sexes.
The mean systolic and diastolic pressures were 122.43±14.85 and 72.26±10.07 mmHg, respectively, with no significant differences observed between sexes. Laboratory evaluations, available for the majority of the cohort, revealed several sex-specific differences. The mean fasting glucose level was significantly higher in boys than in girls (P<0.001). Boys also exhibited significantly higher levels of liver transaminases, including AST (P=0.001) and ALT (P<0.001), as well as serum uric acid (P=0.014). When adjusted for age at diagnosis using ANCOVA, the sex difference in fasting glucose, AST, and ALT remained significant (all P<0.05). However, the difference in serum uric acid was no longer significant after age adjustment. Other metabolic parameters, including HbA1c and lipid profiles, were comparable between the sexes (Table 1).
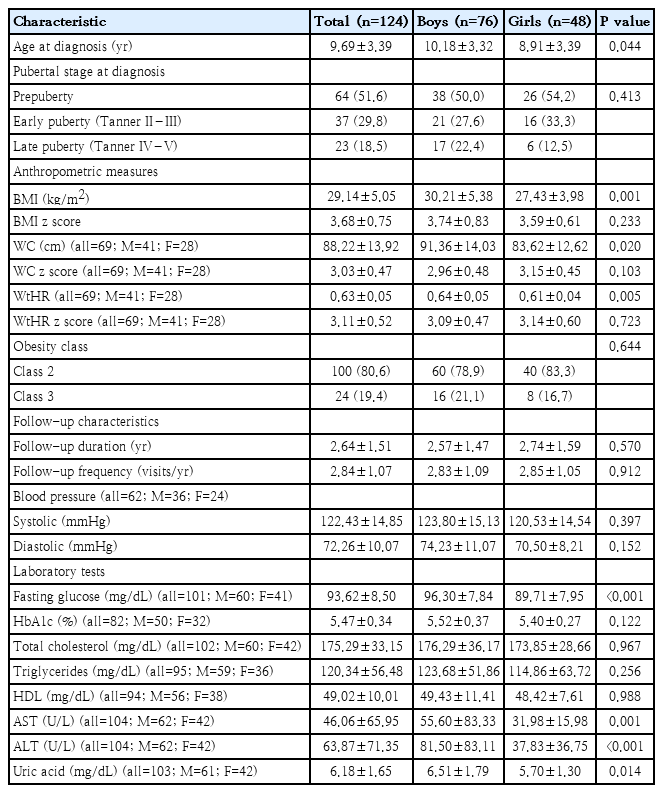
Participants' baseline characteristics by sex
2. Baseline characteristics according to BMI z score change
When participants were grouped by their BMI z score change, 85 (68.5%) were in the improved group and 39 (31.5%) were in the Not improved group. Participants in the improved group were significantly younger at diagnosis than those in the not improved group (P<0.001). Consistently, the improved group exhibited a significantly less advanced pubertal status at diagnosis (P=0.039). Although the mean baseline BMI and WC were significantly lower in the improved group (P=0.001 and P=0.046, respectively), their corresponding z scores showed no significant differences between the 2 groups.
Regarding metabolic parameters, the improved group exhibited significantly lower mean systolic blood pressure and baseline triglyceride levels (P=0.034 and P=0.011, respectively). However, after adjusting for age at diagnosis, these differences in systolic blood pressure and triglycerides were no longer significant. Other parameters showed no significant differences between the 2 groups. Furthermore, other baseline characteristics, including sex distribution and follow-up frequency, were comparable between the groups (Supplementary Table 1).
3. Anthropometric trajectories and transitions in obesity class
BMI z score trajectories demonstrated a distinct age-and sex-dependent pattern (Fig. 1). Among boys, BMI z scores gradually decreased until approximately 11–12 years of age, reaching a nadir before increasing thereafter. In girls, a similar decline was observed until approximately 9–10 years of age, followed by a subsequent rise. When comparing baseline and last-visit values, boys showed an overall trend toward lower BMI z scores, whereas girls did not show a similar pattern. In contrast, WC and WtHR z scores remained largely stable throughout the observation period, showing no clear directional trend (Supplementary Figs. 2 and 3).
Body mass index (BMI) z score trajectories by age and sex. Plots for boys (A) and girls (B). Each line represents an individual participant’s BMI z score between the baseline and last visits. Smoothed trajectories (LOESS) are overlaid for each visit type (baseline and last). LOESS, locally estimated scatterplot smoothing.
Transitions in obesity class between the initial and last visits are visualized using a Sankey diagram (Fig. 2). Most participants remained in the same obesity class during follow-up; however, downward transitions indicating improvement were observed in a subset of participants, primarily from class 3 to class 2 and from class 2 to class 1. Only 2 participants improved to the overweight range at the last visit. In addition, 2 participants developed diabetes mellitus and 3 required pharmacotherapies for weight control after at least 1 year of follow-up.
Transitions in obesity classes between the initial and last visits. Each band represents the flow of participants between obesity classes from the initial visit (left) to the last visit (right). The numbers above the bands indicate the participants per band with percentages based on the initial nodes. Obesity classes were defined as follows: overweight, body mass index 85th to <95th percentile; class 1, ≥95th percentile to <120% of the 95th percentile; class 2, 120%–140% of the 95th percentile; and class 3, ≥140% of the 95th percentile.
4. Subgroup analysis of BMI z score changes
Overall, BMI z scores significantly decreased from baseline to the last visit (mean ΔZ=–0.27±0.79, P<0.001) (Table 2). Boys showed a significant reduction in BMI z scores (P<0.001), whereas the change in girls was not significant. Younger participants tended to experience greater improvement. The largest decrease occurred in the 3- to 6-year group (P=0.003), followed by the 6- to 9-year group (P<0.001). In contrast, an increase in BMI z score was observed among participants aged 12 to 15 years (ΔBMI z score=+0.35±0.60, P=0.024), whereas minimal or no significant change was evident in the other older groups. When stratified by pubertal stage at diagnosis, BMI z scores significantly decreased among prepubertal participants (P<0.001), with no significant change in early or late puberty groups. When stratified by baseline BMI z score category, the greatest reduction occurred in participants with initial scores of 3.5–4.0 (P<0.001), followed by those with scores of 3.0–3.5 (P=0.022). In contrast, participants with baseline BMI z scores ≤3.0 or >4.0 showed no significant change over time.
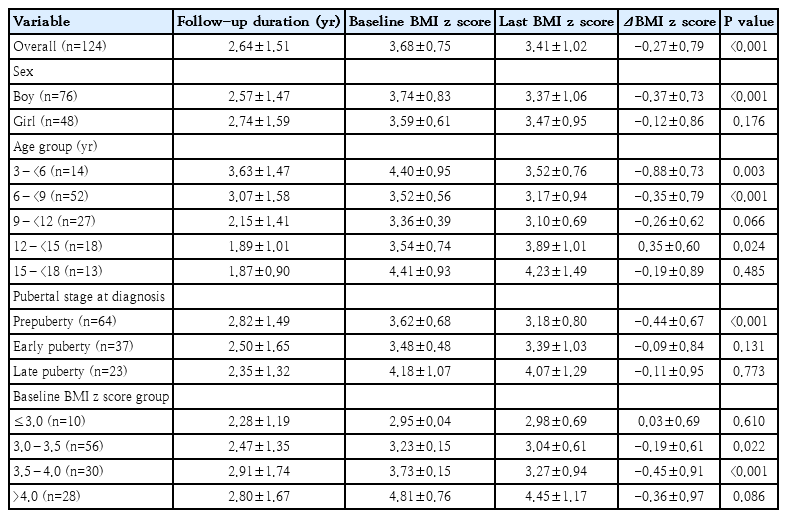
Changes in BMI z score between the initial and last visits stratified by subgroup
5. Predictors of BMI z score change
In the multivariable linear regression model assessing factors associated with changes in BMI z score between the initial and last visits, younger age at diagnosis (P<0.001) and male sex (P=0.015) were independently associated with a greater reduction in BMI z score. Baseline BMI z score, pubertal stage, follow-up duration, and visit frequency were not significantly associated with BMI z score change (Table 3).
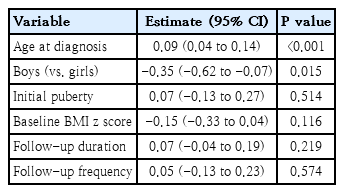
Multivariable linear regression analysis of changes in BMI z score between the initial and last visits
To further evaluate the longitudinal changes, a linear mixed model was employed using all visit-level data. Across all visits, increasing age at each visit was significantly associated with lower BMI z scores over time (P<0.001), indicating a gradual decline during follow-up. Similarly, younger age at diagnosis (P<0.001) and male sex (P=0.015) were associated with lower BMI z scores. In contrast, higher baseline BMI z scores (P<0.001) and longer follow-up duration (P=0.036) were linked to higher BMI z scores; pubertal status and visit frequency were not significant predictors (Table 4).
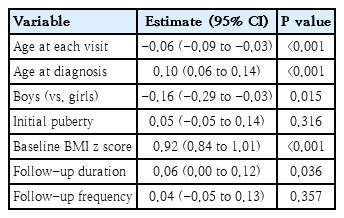
Linear mixed-effects model for predictors of BMI z score over time
6. Changes in body composition parameters
Among the 40 participants (27 boys) with available body composition data, the mean age at earliest evaluation was 9.63±3.19 years, and the mean follow-up duration was 2.44±1.52 years. BMI z scores significantly decreased between the earliest and latest measurements (P=0.012), whereas no significant changes were observed in body fat percentage or the muscle-to-fat ratio (Supplementary Table 2). Participants with and without body composition data did not differ significantly in baseline characteristics or BMI z score changes.
7. Changes in metabolic syndrome indicators
Among the 32 participants (20 boys) with available metabolic data, the mean age at the initial evaluation was 11.69±2.13 years, and the mean follow-up duration was 1.80±0.95 years. No significant changes were observed in BMI z score, WC z score, blood pressure, or most biochemical indices, including fasting glucose, HbA1c, and lipid profile. In contrast, liver transaminase levels decreased modestly (P=0.013 for AST; P=0.021 for ALT), whereas serum uric acid levels increased significantly during follow-up (P<0.001). Within this subgroup, the number of participants meeting the criteria for metabolic syndrome decreased slightly from 10 (31.2%) to 7 (21.9%), but this change was not significant (Supplementary Table 3).
Discussion
In this multicenter longitudinal study of Korean children and adolescents with severe obesity managed exclusively through outpatient lifestyle intervention, we observed a modest but significant overall reduction in BMI z scores over an average follow-up duration of 2.6 years. This improvement was primarily observed among boys and younger participants, whereas older and pubertal participants showed minimal or no meaningful changes. Despite the slight decrease in BMI z scores, most participants remained within the same obesity class. Furthermore, a small subset of participants exhibited worsening outcomes, underscoring the limited efficacy of conservative management in some cases.
Our analysis of baseline characteristics revealed that boys exhibited significantly higher fasting glucose levels than girls, although this did not translate into differences in HbA1c. Boys also showed higher liver transaminases, aligning with the known elevated risk of MASLD in boys with obesity; however, the potential for selection bias due to missing data requires a cautious interpretation [26]. Regarding treatment response, those who achieved a reduction in BMI z score were more likely to be younger and prepubertal at diagnosis, as other baseline clinical variations were found to be primarily age-dependent after statistical adjustment.
Our results are consistent with previous reports showing that behavioral and lifestyle interventions yield only a modest improvement in BMI among children with severe obesity [27,28]. In particular, the significant age-dependent pattern observed in our cohort—where younger, prepubertal participants demonstrated greater reductions in BMI z scores—aligns with previous evidence suggesting that early intervention is associated with better treatment response and greater potential for metabolic recovery [18,29,30]. Conversely, adolescents exhibited limited improvement, likely reflecting both physiological changes during puberty and neurocognitive factors such as heightened impulsivity, increased susceptibility to peer influence, and increasing autonomy from parental guidance [31].
The observed sex-specific differences—greater BMI z score reduction among boys than among girls—have also been reported in prior pediatric obesity intervention studies, suggesting that hormonal, behavioral, or psychosocial factors may contribute to differential responsiveness; nonetheless, the underlying mechanisms remain to be fully elucidated [30,32]. Moreover, the distinct age-related turning points in BMI trajectories (around 11–12 years in boys and 9–10 years in girls) may reflect pubertal timing [33,34].
Unlike BMI, WC and WtHR z scores showed no significant longitudinal change. Given that WtHR reflects central adiposity and is more strongly linked to cardiometabolic risk than BMI alone, the stability of these indices suggests persistent visceral fat accumulation despite modest weight reduction [35]. This perspective is further supported by the unchanged prevalence of metabolic syndrome and the minimal changes in biochemical parameters, except for modest reductions in liver transaminases and an unexpected rise in serum uric acid. However, as these analyses were based on a limited subset of participants, and followup laboratory or WC measurements were less frequently performed in those showing BMI improvement, the validity of the findings may be affected by selection bias. The minimal change in BMI z score observed within the metabolic subgroup further supports this possibility, suggesting that the apparent absence of metabolic improvement may not represent the overall cohort trajectory.
Body composition analysis, performed in a subset of participants, revealed no significant change in body fat percentage or muscle-to-fat ratio despite decreases in BMI z score. This finding underscores the limitations of BMI as a surrogate marker for body composition and emphasizes the importance of incorporating direct adiposity measurements in pediatric obesity follow-up. Although the sample size was relatively small, the similarity in baseline and trajectory characteristics between participants with and without body composition data supports the representativeness of this subset. These results are consistent with previous reports showing that BMI reduction is often dissociated from changes in body composition among children with severe obesity [36]. Furthermore, as demonstrated in a recent meta-regression analysis, meaningful reductions in body fat percentage generally require substantial decreases in BMI, which may explain the absence of significant body composition changes in our cohort [37].
Taken together, our findings indicate that while lifestyle interventions can produce measurable benefits—particularly among younger, male, and prepubertal children—most participants with severe obesity remain above clinical obesity thresholds over time. Thus, early identification and timely intervention can prevent progression to persistent obesity. As initial improvements often plateau, weight management should be intensified beyond lifestyle counseling. In line with recent international guidelines, structured, multidisciplinary interventions—including behavioral therapy, family-based programs, and emerging pharmacologic agents should be considered to achieve sustained outcomes in this high-risk population [38,39].
This study has some limitations. First, as a retrospective study, our analysis may be subject to selection bias and incomplete follow-up data. Participants who achieved meaningful weight improvement may have been less likely to continue follow-up, which could partly explain the apparent association between longer follow-up duration and higher BMI z scores in the mixed-effects model. Furthermore, the pubertal stage was not assessed at every follow-up visit. This precluded a more precise adjustment for the pubertal transition, which may have influenced the observed longitudinal BMI trajectories. Second, lifestyle and dietary counseling were not standardized across hospitals or clinicians, and variations in the intensity or content of counseling may have influenced the observed outcomes. Third, metabolic and body composition parameters were available only for a subset of participants, limiting generalizability and introducing potential selection bias, as follow-up laboratory or WC measurements were less frequently obtained in those with greater BMI improvement. Fourth, socioeconomic status and parental weight data were not collected, precluding adjustment for familial and environmental factors. Finally, the absence of a control group hindered direct comparison with children of normal weight or those receiving pharmacologic treatment. Nevertheless, this study represents the first multicenter longitudinal analyses of severe pediatric obesity in Korea and provides important real-world evidence on anthropometric and metabolic trajectories under standard outpatient care.
In conclusion, this multicenter longitudinal study provides real-world insights into the anthropometric and metabolic trajectories of Korean children and adolescents with severe obesity managed through routine outpatient care. Although modest reductions in BMI z scores were observed, most participants remained within the range of severe obesity, with limited improvement in metabolic indicators. Adolescents and girls showed particularly limited responses compared with younger children and boys, underscoring the need for earlier and more intensive treatment approaches in these subgroups. Overall, these findings highlight the limited effectiveness of lifestyle modification alone, particularly in children and adolescents with severe obesity. Consequently, these results emphasize the importance of early, individualized, and multidisciplinary interventions to achieve sustained weight and metabolic improvement, as well as the need for prevention to preclude the progression to severe obesity. Future research should focus on identifying predictors of treatment responsiveness and establish standardized prevention and care models for severe pediatric obesity.
Supplementary materials
Supplementary Tables 1-3 and Supplementary Figs. 1-3 are available at https://doi.org/10.3345/cep.2025.02999.
Baseline characteristics of participants according to BMI z score change
Changes in body composition parameters between the earliest and latest available measurements (n=40)
Changes in metabolic syndrome-related indicators between the earliest and latest available measurements (n=32)
Flowchart of participant selection. BMI, body mass index.
Waist circumference (WC) z score trajectories by age and sex. Each dot represents an individual visit, and connecting lines indicate repeated measurements from the same participant. Smoothed trajectories (locally estimated scatterplot smoothing) are shown separately by sex.
Waist-to-height ratio z score trajectories by age and sex. Each dot represents an individual visit, and connecting lines indicate repeated measurements from the same participant. Smoothed trajectories (locally estimated scatterplot smoothing) are shown separately by sex.
Notes
Conflicts of interest
No potential conflict of interest relevant to this article was reported.
Funding
This study was supported by the National Institute of Health (NIH) Research Project (Project No.2024-ER1102-01).
Author contribution
Conceptualization: JH, JK; Data curation: JH, HL, DJH, JL, YHH; Formal analysis: JH, HL, JK; Funding acquisition: JK; Methodology: JH, JL, YHH, HYK, JK; Project administration: JK; Visualization: JH; Writing - original draft: JH; Writing - review & editing: JH, JL, YHH, HYK, JK