All issues > Volume 65(4); 2022
Nonfatal injuries in Korean children and adolescents, 2007–2018
- Corresponding author: Seom Gim Kong, MD. Department of Pediatrics, Kosin University College of Medicine, 262 Gamcheon-ro, Seo-gu, Busan 49267, Korea Email: ana313@hanmail.net
- Received April 29, 2021 Revised August 26, 2021 Accepted August 30, 2021
- Abstract
-
- Background
- Background
- Injury is the leading cause of death or disability in children and adolescents. Rates of deaths from injuries have recently declined, but studies of the occurrence of nonfatal injuries are lacking.
- Purpose
- Purpose
- This study aimed to investigate nonfatal injuries in children and adolescents younger than 20 years based on data from the Korean National Health and Nutrition Survey, 2007–2018.
- Methods
- Methods
- A questionnaire survey was conducted to determine whether children and adolescents had experienced an injury requiring a hospital visit in the previous year. We investigated each injury’s risk factors and characteristics.
- Results
- Results
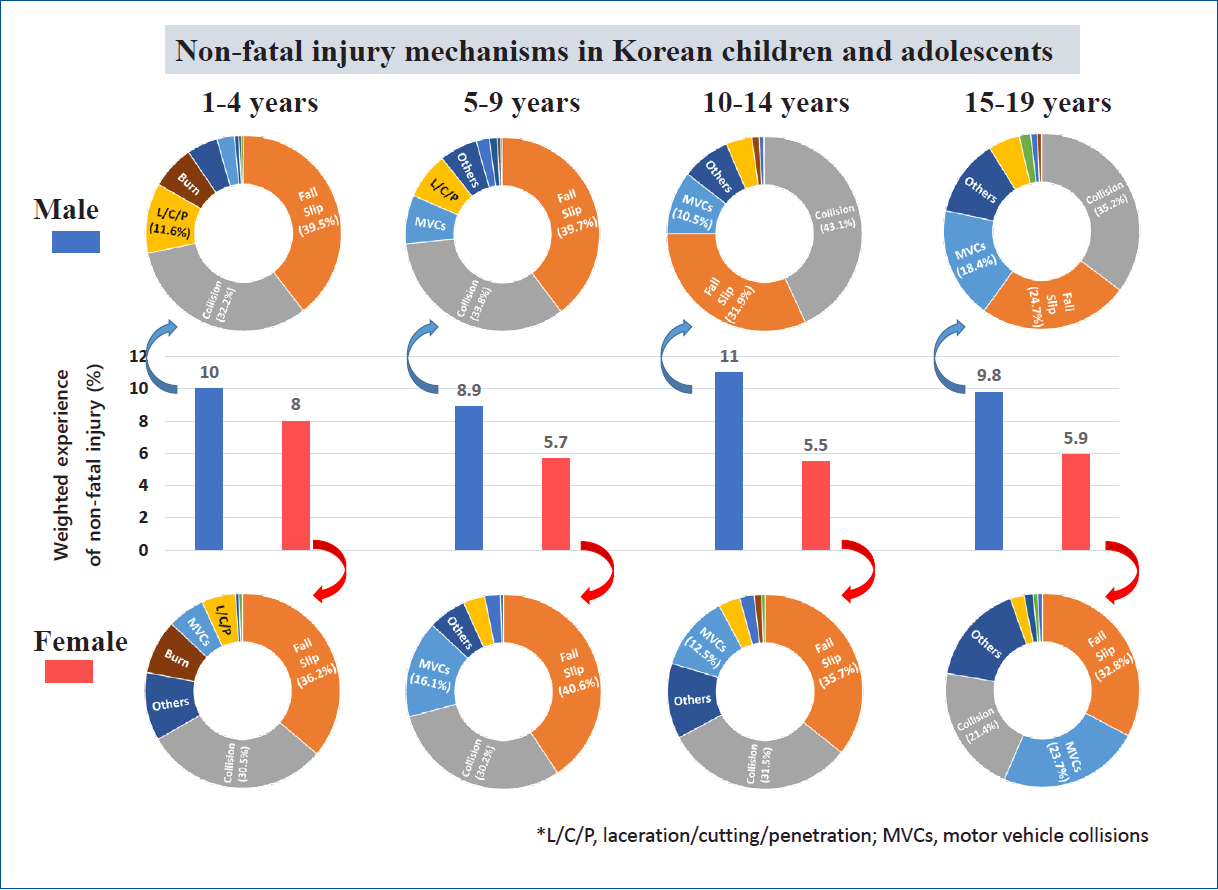
- Of a total of 21,598 children and adolescents, 1,748 (weighted percentage, 8.1%) experienced one or more injuries in the previous year. There was no yearly difference in the proportion of injuries experienced. Among the male subjects, 10.0% had an injury experience; among the female participants, 6.1% had an injury experience (P<0.001). The highest rate was 9.0% in children aged 1–4 years. In multivariate logistic regression analysis, male sex; having an urban residence; having restricted activity due to visual, hearing, or developmental impairment; and attention deficit/hyperactivity disorder were significant risk factors for injury experience. The characteristics of up to 3 injuries per patient were investigated, and 1,951 injuries were analyzed. Falls and slips accounted for 34.9%, collisions for 34.1%, and motor vehicle accidents for 11.3% of the total injuries. Ninety-six percent of injuries were unintentional, 20% caused school absences, and 10% required hospitalization.
- Conclusion
- Conclusion
- Among Korean children and adolescents, 8.1% experienced injuries at least once a year with no significant differences in incidence over the past 12 years. Greater attention and effort to prevent injuries are needed.
Graphical abstract.
- Introduction
- Introduction
Injury is the leading cause of death and disability in children and adolescents [1]. The mortality rate due to injury is used mainly as a major indicator for injury monitoring and evaluation. According to 2019 Korea Statistical Office data, the mortality rates among children aged 0, 1 to 9, and 10 to 19 years old due to injury were 16.6, 3.6, and 9.4 per 100,000 population, respectively [2]. Injuries accounted for a high proportion of the total mortality rates of these age groups, 6%, 34%, and 59%, respectively. According to another statistic on the mortality rate of injury of children younger than 14 years in Korea, deaths from injury per 100,000 population decreased from 24.3 in 1996 to 3.9 in 2016, ranking ninth of the 32 countries belonging to the Organization for Economic Cooperation and Development [3].Mortality data from injury are objective and important, but these data reflect only a part of the total injury scenario. According to the Emergency Department (ED)-based Injuries In-depth Surveillance database of Korea from 2011 to 2017, death occurred in only 0.1% of patients under the age of 20 who visited the ED due to injury [4]. Fatal injuries account for only a minute portion of injuries and have different characteristics than nonfatal injuries [5]. According to the 2017–2018 National Injury Fact Book of Korea, the number of deaths from injury decreased for all ages, but hospitalization and outpatient visits for injuries increased [6]. According to these data, the overall injury mortality rate at all ages was 55 per 100,000, ED visits were 3,142, and inpatients were 2,177. Based on the data of the Korean National Health and Nutrition Examination Survey (KNHANES), the number of injured patients was 6,842 per 100,000. Although the data on ED-based injuries are meaningful [4,7], they reflect less than half of all injuries.As such, the mortality data and ED data due to injury are insufficient for monitoring and effective prevention of injury. The KNHANES data include a questionnaire on the experience of injury. These data are representative of the Korean population, and the nonfatal injury data can supplement data on deaths. Therefore, we tried to confirm the incidence, risk factors, and characteristics of injury in children and adolescents using data from the KNHANES.
- Methods
- Methods
We conducted this study using data from the KNHANES. The KNHANES data managed by the Korea Centers for Disease Control and Prevention are sample survey data extracted using a 2-stage stratified colony sampling method that uses the survey zone and household as the extraction unit. These data are representative of the entire Korean population. Patients older than 1 year were interviewed about the experience of injury. We conducted the study based on data from 2007 to 2018: KNHANES IV (2007–2009), KNHANES V (2010–2012), KNHANES VI (2013–2015), and KNHANES VII (2016–2018). This study was approved by the Institutional Review Board of Kosin University Gospel Hospital (2021-04-031).This study was conducted in children and adolescents aged 1 to 19 years from 2007 to 2018. We analyzed the response to the questionnaire about injury experience. The survey asked, “Have you had any accidents or poisoning that required treatment in a hospital or emergency department in the past year?” Subjects with more than one injury experience in the 1 year were defined as having an injury experience. The weighted percentage of injury experience was investigated according to survey period, age, sex, region of residence, household income, and type of insurance. In addition, it was asked whether the subjects were restricted in daily life and social activities due to health problems or physical or mental disabilities. Visual impairment, hearing impairment, depression/anxiety, mental retardation, language disorder, developmental disorder, and attention deficit/hyperactivity disorder (ADHD) were investigated as reasons of activity restriction. Among chronic diseases of children and adolescents, it was investigated whether the subjects had ever been diagnosed during their lifetime with ADHD by a doctor.In addition, the month of occurrence, mechanism and intentionality of the injury, hospital treatment, and absence from school were investigated. Motor vehicle collision (MVC), falls/slip, collision, laceration/cut/penetration, burns, asphyxia, drowning, poisoning, and others were investigated to describe the mechanism of injury. Hospital treatment was divided into ED, outpatient, and hospitalization. For intentionality, we investigated whether the injury was unintentional, due to intentional self-harm, or caused by violence of others. In addition, the requirement for absence from school was investigated.The KNHANES data were extracted via the multistage stratified cluster sampling method for sample representativeness and accuracy of estimation. Unlike simple random sampling design data, these data can maintain representativeness only when analysis is performed using weights, stratification variables, and colony variables. Therefore, we performed statistical analysis using a complex sample analysis method utilizing weights, stratification variables, and colony variables. Sampling weights were generated by considering a complex sample design, the nonresponse rate of the target population, and poststratification. The weighted percentage was calculated for subjects with experience of injury. As a statistical method, a complex sample crosstabs analysis was performed. Logistic regression analysis was performed for risk factors affecting the injury experience. For statistical analysis, IBM SPSS Statistics ver. 25.0 (IBM Co., Armonk, NY, USA) was used. P values less than 0.05 were judged to be statistically significant.
- Results
- Results
- 1. Experience of nonfatal injury of subjects
- 1. Experience of nonfatal injury of subjects
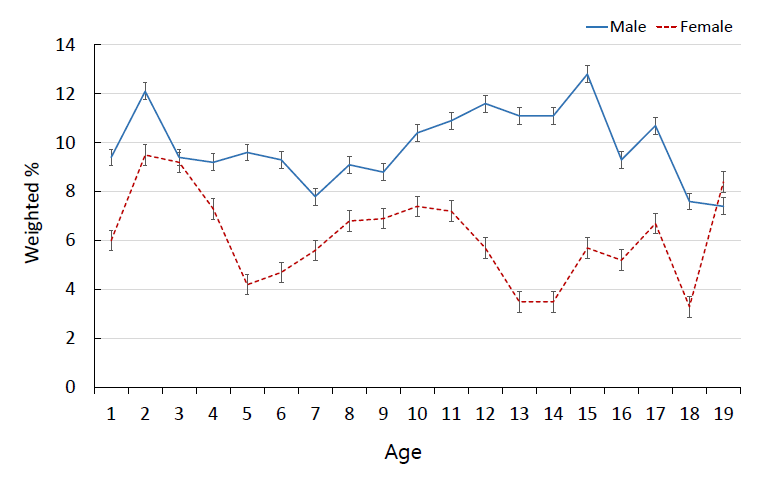
A total of 21,598 subjects were younger than 20 years. Among these subjects, 1,748 experienced more than one injury in the preceding year; the weighted percentage was 8.1%±0.1% (Table 1). There was no significant difference by year in experience of injury. There was no significant change by year according to sex, region, or household income. In male subjects, 10.0% ±0.2% had an injury experience, while females had an injury experience incidence of 6.1%±0.1% (P<0.001). The highest rate was 9.0%±0.3% in children aged 1–4 years (P<0.001). There were many experiences of injury in males of all ages (Fig. 1). In females, around 9% of the patients experienced injury at 2–3 years of age and less than 4% at 13–14 years of age. For those living in urban areas, 8.3%±0.1% experienced injury; for those living in rural areas, 7.1%±0.3% experienced injury. The incidence was high in urban areas (P<0.001). Injury incidence was high for those in the low-household income group (8.4%±0.2%, P=0.009) and for those receiving the medical aid form of health insurance (10.2%±0.5%, P<0.001).Few subjects had activity restrictions. However, 17.5%±1.1% of children who had activity restriction due to visual impairment experienced injury. Other reasons for restricted activity were associated with increased risk of injury: hearing impairment (17.8%), depression/anxiety (14.2%), mental retardation (12.5 %), language disorder (14.7%), developmental disorder (19.1 %), and ADHD (12.7%). There were 153 subjects diagnosed with ADHD, and they had a higher rate of injury experience than did subjects without ADHD (15.6%±1.3%, P<0.001).- 2. Risk factors associated with injury experience
- 2. Risk factors associated with injury experience
In univariate analysis of factors related to injury experience, being male, young age, living in urban areas, low-household income, and receiving medical aid were identified as significant risk factors (Table 2). In addition, activity restriction and diagnosis of ADHD also were identified as significant risk factors. In multivariate analysis, the odds ratio (OR) for male was 1.77 (95% confidence interval [CI], 1.67–1.87; P<0.001). The OR for urban dwellings was 1.19 (95% CI, 1.11–1.29; P<0.001). Among the causes of activity restriction, the OR for visual impairment was 1.81 (95% CI, 1.47–2.22; P<0.001), the OR for hearing impairment was 1.72 (95% CI, 1.15–2.55; P=0.008), and the OR for developmental disorder was 2.00 (95% CI, 1.01–3.93; P=0.046). Among chronic diseases, the OR for diagnosis of ADHD was 1.88 (95% CI, 1.48–2.40; P<0.001).- 3. Characteristics of nonfatal injury
- 3. Characteristics of nonfatal injury
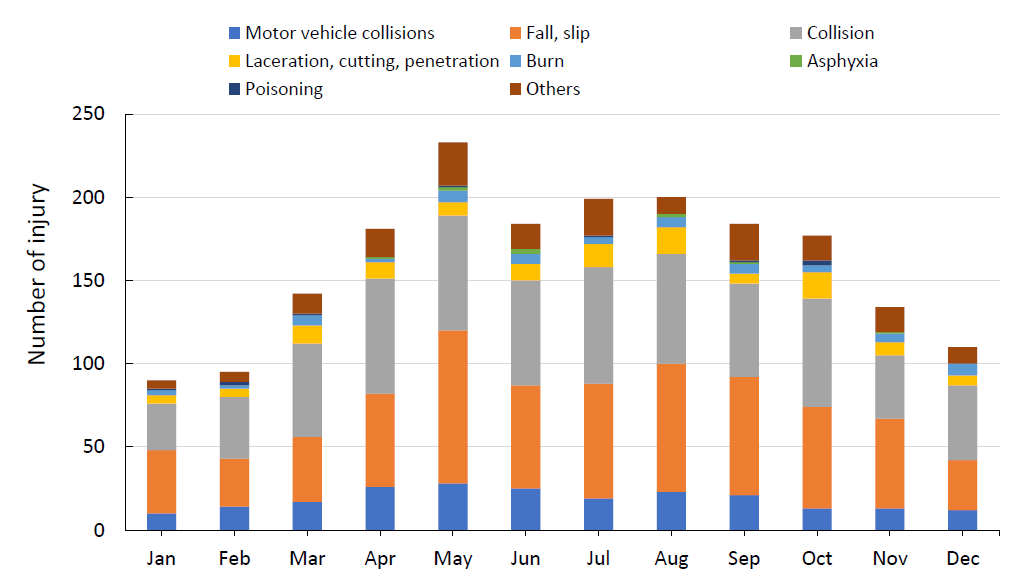
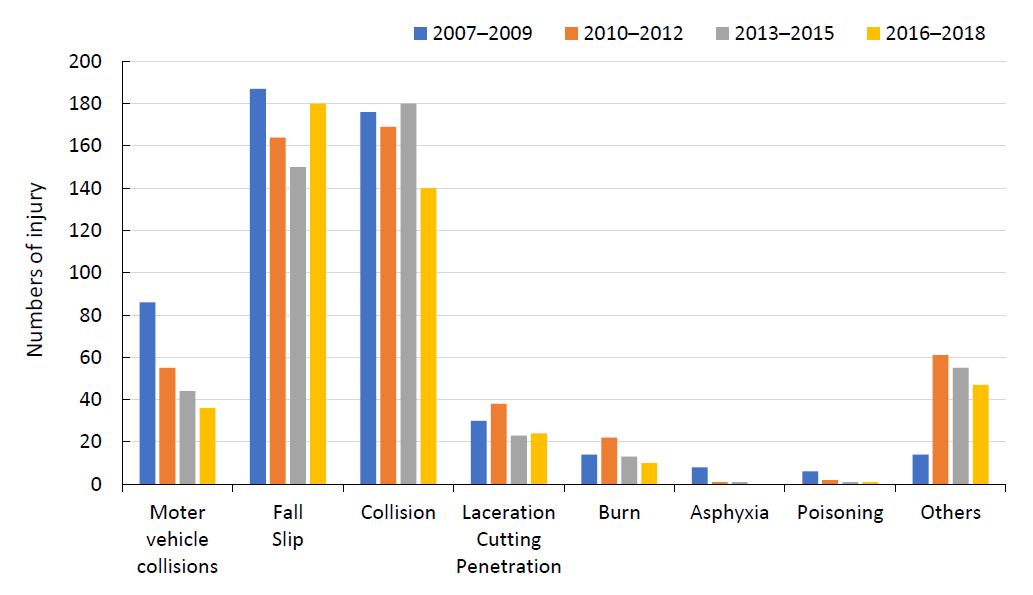
The characteristics of the injury were investigated for up to 3 injuries per subject, and a total of 1,951 injuries was investigated (Table 3). Of the 1,748 patients who had experience of injury, 1,579 (90.2%) had 1 injury experience, 135 (7.6%) had 2 injuries, and 34 (2.2%) had 3 or more injuries.The most common causes of injury were fall and slip (34.9%), collision (34.1%), and MVC (11.3%). Cutting and penetration were responsible for 5.9%, burns for 3.2%, and asphyxia and poisoning for 0.5%. There were no cases of drowning. MVC injury was less frequent in the 1–4 years of age group. MVCs accounted for 18.4% of injuries in 15- to 19-year-old males and 23.7% of injuries in females 15–19 years. Fall/slip and collision accounted for approximately 70% of all injuries and were more frequent than other types at all ages. Burns were frequent in the under 1–4 year age group, accounting for 7.2% of injuries in boys and 9.0% in girls. The number of experiences of MVC decreased over time (Fig. 2).Of all injuries, 96.3% were unintentional. Self-harm injury was responsible for 0.7%, and violence by others caused 2.6%. Of the total injuries, 33.5% of patients visited the ED, 55.7% were outpatients, and 10.0% were hospitalized. The most frequent ED visitors were 1–4 years old; after 5 years of age, outpatient use was most frequent. School absence was required in 20% of injuries. Injury occurrence was high between April and October, and the month with the most injuries was May (Fig. 3).
- Discussion
- Discussion
In our study, 8.1% of children and adolescents experienced nonfatal injury more than once a year, and 10% of them experienced injury more than twice. This result did not include fatal injury cases or cases not requiring hospital care. Therefore, this result is underestimated compared to the actual number of injuries. In addition, while the injury-related mortality rate has decreased [2,3], there was no significant decrease in the nonfatal injury experience rate over 12 years. According to data from the Korean Statistical Office, between 2007 and 2018, the number of births decreased from 497,000 to 327,000, and the number of children under 14 decreased from 8.7 million to 6.6 million [8,9]. Thus, the total number of injured persons decreased over 12 years, but the injury experience rate did not change significantly. In Korea, policies on child safety have been implemented since 2003, and include traffic safety, product safety, food safety, living space, and safety education. Although the death rate and MVC recently have decreased significantly, more long-term and practical planning and implementation are needed. The Child Safety Control Act was enacted in 2020, requiring establishment and implementation of a comprehensive child safety plan every 5 years [10].In our study, the rate of injury experience was higher in males, urban residents, and those from low-income households. In Korea, the incidence of injury at all ages was higher among males [6]. For fatal injuries in 2016, the number in children younger than 14 years was 1.7 times higher for boys: 4.9 males and 2.8 females per 100,000 [3]. In the Centers for Disease Control and Prevention data, the incidence of injuries in boys was high among children and adolescents except those younger than one year [11]. In addition, the incidence of injury was high in urban areas; this differs from the results of comparing deaths of children due to unintentional injuries by region in the data of the Korean National Statistical Office [2]. In Seoul, Gyeonggi province, and other metropolitan areas, the mortality rate of children due to unintentional accidents is 2.0–3.2 per 100,000 population, lower than the 3.0–4.7 in other areas. This difference is believed to be due to differences in medical infrastructure. Considering that the incidence of MVC is higher in metropolitan areas, the regional difference is expected to be larger than the measured results.In our data, the risk of injury was high when there were restrictions on activity due to visual impairment, hearing impairment, or developmental disorder. Consistent with previous findings, those diagnosed with ADHD had a high incidence of injury [12]. Focus and correction should be placed on the physical and social environments of children [13].In our data, unintentional injuries accounted for 96.3% of all injuries. According to the data of 2019 Korean death statistics, deaths from intentional injury between the ages of 0 and 9 years accounted for 27.8%–29.5%, while that of those ages 10 and 19 accounted for 65.9% [2]. This means intentional injuries are more fatal than unintentional injuries. Moreover, the mechanisms of injury in our data were different from those in the death statistics data. Among unintentional injury that caused death in children and adolescents, MVC, suffocation, and drowning were common [3]. Among children younger than 1 year, suffocation accounted for more than 60%. The incidence of injuries with such a high-mortality rate was low in our study [14]. In particular, no one experienced drowning.On the other hand, the results for patients who visited the ED were similar to our results in that more than 95% of injuries were unintentional [4]. As the mechanism of injury, cases of fall, slip, and collision accounted for about 2/3 of the total injuries at all ages [4]. This is similar to that in the study of Dorney et al. [5], fall and collision are the most common mechanisms that cause nonfatal injury in 1- to 19-year-olds in the United States.In children and adolescents, the mechanism of injury also differed according to age [5,11,15]. In our study, burns occurred mainly in children younger than 4 years of age and MVC increased with age. According to the Centers for Disease Control and Prevention childhood injury report, fall was the most common cause of injury in children under the age of 15, and MVC was the most common cause thereafter [11]. In particular, the rate of suffocation was highest in children younger than 1 year of age, and the rates of fires, burns, and drowning were highest for children 4 years and younger [11,16]. This was similar to the rates of unintentional injuries in low-income countries in the World Report on Child Injury Prevention [17]. The reason that injury in children and adolescents differs according to age is that development and behavior are related closely to specific injuries [17]. In addition, as age increased, the number of cases of injury during leisure activities, exercise, or education increased gradually [4].Injuries to children and adolescents are being recognized as predictable and preventable, moving away from the past concept of 'accidents,' and various improvement efforts are occurring around the world [17,18]. Prevention of high-mortality injuries such as suicide, MVC, and suffocation is important, as is that of higher-incidence rate injuries. Unintentional injury can be prevented in many cases. Supplementation and reinforcement of policies on wearing protective equipment and safe facility management are necessary; few cases of injury occur while wearing protective equipment. Provision of consistent preventive education according to age for caregivers, children, and adolescents especially is important. Pediatricians need to provide this important unintentional injury prevention education to parents during examinations of infants and toddlers.The limitation of our study was that the data were collected through a questionnaire survey. Therefore, the accuracy and reliability might be low because or recall bias. In addition, the total number of injuries was not reflected sufficiently, and location, mechanism, and detailed outcome of injury were not investigated. Also, there was a limitation that fatal and mild injuries were excluded. Nevertheless, estimation of the incidence of injury in all children and adolescents through large-scale data reflecting the entire Korean population is meaningful.In conclusion, 8.1% of children and adolescents who visited the hospital annually experienced injury, and this is probably an underestimation. Since there is no significant difference in the frequency of nonfatal injury over the past 12 years, we believe that more attention and efforts to prevent injury are needed.
- Footnotes
Conflicts of interest No potential conflicts of interest relevant to this article were reported.
Fig. 1.
Percentage of children and adolescents experiencing injury by age. Males had a higher overall incidence of injury experiences than females (10.0%±0.2% vs. 6.1%±0.1%, P<0.001). Children between the ages of 1 and 4 years had the highest incidence of injury experience (9.0%±0.3%, P<0.001).

Fig. 3.
Differences in monthly injury number and mechanism. Injuries occurred frequently between April and October, and May had the highest injury frequency.

Table 1.
Nonfatal injury experiences of children and adolescents
Table 2.
Logistic regression analysis of factors associated with nonfatal injuries in children and adults
Table 3.
Injury mechanisms and outcomes by age and sex
- References
- 1. Global Burden of Disease Pediatrics Collaboration; Kyu HH, Pinho C, Wagner JA, Brown JC, Bertozzi-Villa A, et al. Global and national burden of diseases and injuries among children and adolescents between 1990 and 2013: findings from the global burden of disease 2013 study. JAMA Pediatr 2016;170:267–87.
[PubMed] [PMC]2. Korea Statistical Office. 2019 Cause of death statistics results [Internet]. Daejeon (Korea), Korea Statistical Office. c2020;[cited 2021 Apr 12]. Available from: http://kostat.go.kr/portal/korea/kor_nw/1/1/index.board?bmode=read&aSeq=385219.3. Korea Statistical Office. Child death due to injury (1996–2016) [Internet]. Daejeon (Korea), Korea Statistical Office. c2018;[cited 2021 Feb 28]. Available from: http://kostat.go.kr/portal/korea/kor_nw/1/6/1/index.board?bmode=read&bSeq=&aSeq=367573&pageNo=3&rowNum=10&navCount=10&currPg=&searchInfo=&sTarget=title&sTxt=.4. Park SH, Min JY, Cha WC, Jo IJ, Kim T. National surveillance of injury in children and adolescents in the republic of Korea: 2011–2017. Int J Environ Res Public Health 2020;17:9132.
[Article] [PubMed] [PMC]5. Dorney K, Dodington JM, Rees CA, Farrell CA, Hanson HR, Lyons TW, et al. Preventing injuries must be a priority to prevent disease in the twenty-first century. Pediatr Res 2020;87:282–92.
[Article] [PubMed]6. Korea Centers for Disease Control and Prevention. The 10th National Injury Fact Book [Internet]. Cheongju (Korea), Korea Centers for Disease Control and Prevention. c2018;[cited 2021 Apr 19]. Available from: http://kdca.go.kr/contents.es?mid=a20601030600.7. Jung JH, Kim DK, Jang HY, Kwak YH. Epidemiology and regional distribution of pediatric unintentional emergency injury in Korea from 2010 to 2011. J Korean Med Sci 2015;30:1625–30.
[Article] [PubMed] [PMC]8. Korean Statistical Information Service. Fertility rate [Internet]. Daejeon (Korea), Statistics Korea. c2020;[cited 2021 Jul 3]. Available from: http://www.kosis.kr/.9. Korean Statistical Information Service. Population by age [Internet]. Daejeon (Korea): Statistics Korea. Daejeon (Korea), Statistics Korea. c2020;[cited 2021 Jul 3]. Available from: http://www.kosis.kr/.10. Korea Law Information Center. Child Safety Control Act. [Internet]. Sejong, Korea Law Information Center. c2020;[cited 2021 Jul 3]. Available from: https://www.law.go.kr/.11. Borse N, Sleet DA. CDC childhood injury report: patterns of unintentional injuries among 0- to 19-year olds in the United States, 2000-2006. Fam Community Health 2009;32:189.
[PubMed]12. Gayton WF, Bailey C, Wagner A, Hardesty VA. Relationship between childhood hyperactivity and accident proneness. Percept Mot Skills 1986;63:801–2.
[Article] [PubMed]13. Brian DJ, Frederick PR. Injury control. Kliegman RM, Stanton BF, St. Geme JW, Schor NF, Behrman RE, editors. Nelson textbook of pediatrics. 21st ed. Philadelphia (PA): Elsevier Saunders, 2019;:80.14. Gallagher SS, Finison K, Guyer B, Goodenough S. The incidence of injuries among 87,000 Massachusetts children and adolescents: results of the 1980-81 Statewide Childhood Injury Prevention Program Surveillance System. Am J Public Health 1984;74:1340–7.
[Article] [PubMed] [PMC]15. Tracy ET, Englum BR, Barbas AS, Foley C, Rice HE, Shapiro ML. Pediatric injury patterns by year of age. J Pediatr Surg 2013;48:1384–8.
[Article] [PubMed] [PMC]16. Agran PF, Anderson C, Winn D, Trent R, Walton-Haynes L, Thayer S. Rates of pediatric injuries by 3-month intervals for children 0 to 3 years of age. Pediatrics 2003;111:e683–92.
[Article] [PubMed]17. Peden M, Oyegbite K, Ozanne-Smith J, Hyder AA, Branche C, Rahman AF, et al. World report on child injury prevention. Geneva (Switzerland): World Health Organization, 2008.18. Sleet DA. The global challenge of child injury prevention. Int J Environ Res Pub Health 2018;15:1921.
[Article]

 About
About Browse articles
 For contributors


