 About
About Browse articles
 For contributors
Fecal microbiome profiles in infants with biliary atresia versus nonbiliary atresia cholestasis: a pilot study
-
Nur Azizah, MBiomed1
 , Fadilah Fadilah, PhD2,3, Silvia Werdhy Lestari, MD, PhD4, Muzal Kadim, MD, PhD5, Fithriyah Sjatha, PhD6, Hanifah Oswari, MD, PhD5
- Corresponding author: Hanifah Oswari, MD, PhD. Gastrohepatology Division, Department of Child Health, Dr, Cipto Mangunkusumo Hospital, Faculty of Medicine, Universitas Indonesia, Jl. Diponegoro No. 71, Cental Jakarta, 10430, Indonesia Email: hanifah.oswari@ui.ac.id
- Received March 8, 2025 Revised May 25, 2025 Accepted June 20, 2025
- Abstract
-
- Background
- Background
- Cholestasis is characterized by disrupted bile flow and can lead to severe liver disease in newborns, of which biliary atresia (BA) is a common cause. The gut microbiome plays a crucial role in aggravating liver injury in BA and non-BA cholestasis. However, information is lacking regarding the differences in gut microbiome composition between patients with BA and non-BA cholestasis.
- Purpose
- Purpose
- This study aimed to assess the gut microbiome profile of infants with BA versus those with non-BA cholestasis and healthy controls in an Indonesian population.
- Methods
- Methods
- We investigated the changes in the microbial composition of fecal samples from 12 infants with BA and 8 with non-BA cholestasis and compared them with those of 8 age-matched healthy controls (HCs). Fecal DNA from all the participants was subjected to 16S rRNA amplicon sequencing.
- Results
- Results
- The fecal microbiome at the phylum level differed between the BA and non-BA cholestasis groups with increased Proteobacteria and decreased Firmicutes. At the genus level, the BA group was enriched with Bacteroides, unclassified Enterobacteriaceae, and Dialister (P<0.05), whereas the non-BA group was enriched with Klebsiella, Chryseobacterium, Acinetobacter, and Pseudomonas (P<0.05). Parabacteroides, unclassified Lachnospiraceae, Actinomyces, Anaerococcus, Clostridium innocuum group, Collinsella, Gemella, and Peptostreptococcaceae (P<0.05) were more enriched in the HC than in the other 2 groups. Detected cytomegalovirus in fecal samples was associated with significant microbial shifts, including increased Lactobacillus, decreased Escherichia-Shigella, and altered Faith’s phylogenetic diversity, highlighting its potential role in gut microbiome modulation. Microbial alterations in patients with BA versus non-BA cholestasis were significantly correlated with liver function indicators.
- Conclusion
- Conclusion
- The BA and non-BA groups showed specific genus enrichment, highlighting the urgent need to identify potential treatments to inhibit the progression of liver injury in infants with cholestasis.
- Introduction
- Introduction
Cholestasis is a condition in which bile production and/or flow is disrupted, and it may affect both the intrahepatic and extrahepatic bile ducts or be restricted to one or the other [1]. Jaundice or yellowing symptoms typically occur in newborn babies. However, prolonged jaundice beyond 2 weeks of age, followed by pale stool and elevated liver enzymes, might be a serious indicator of severe liver disease. The most common cause of cholestasis is biliary atresia (BA), which is defined as an obliterative condition of the biliary tract resulting in bile flow blockage [2]. The initial management of BA is the Kasai portoenterostomy (KPE) procedure. Nearly 70%–80% of patients after KPE experience end-stage liver cirrhosis, requiring liver transplantation or dying from liver failure. On the other hand, the remaining 11% are free from clinical and biochemical signs of liver disease 10 years after the procedure [3]. Therefore, early identification and timely intervention are essential to improve outcomes in infants with cholestasis, especially those with BA.It is increasingly recognized that the gut microbiota plays a role in the developing liver injury in BA [4]. The mechanism is facilitated by the gut-liver axis, which is connected by the bile duct and portal vein. Under normal physiological conditions, the gut microbiota regulates immune responses, tissue repair, protection against pathogens, vitamin synthesis, and digestion [5]. In cholestasis, the retention of bile within the liver prevents its flow into the intestine, disrupting gut homeostasis and contributing to microbial dysbiosis. This dysbiosis can increase intestinal epithelial permeability, elevate the risk of infection, disrupt metabolic functions, exacerbate inflammation, and impair immune responses [6]. Increased gut permeability and the overgrowth of pathogenic microbes may facilitate bacterial and toxin (e.g., lipopolysaccharide) translocation to the liver, thereby aggravating hepatic injury [7]. In addition, previous studies have shown that bile acid accumulation in the liver fails to promote liver injury in the absence of the microbiome in vivo [8]. This confirms the important role of the gut microbiome in the development of liver injury in cholestasis.Previous studies have revealed a gut microbial imbalance in BA patients compared with healthy controls (HCs) [4,9]. Van Wessel et al. [4] reported increased abundances of Acinetobacter and the family Clostridiaceae and decreased abundances of Enterobacteriaceae (including Klebsiella, Salmonella, and Trabulsiella) and Bifidobacterium [4]. In particular, gut microbiome alterations in BA and non-BA cholestasis patients are relatively new, and data showing their differences are lacking. Moreover, the gut microbiome composition in BA and non-BA cholestasis needs to be explored. Here, we performed a comprehensive analysis of the gut microbiota in BA patients and non-BA patients. In the present study, we characterized the structure of the microbial composition in BA and non-BA cholestasis, specifically in the Indonesian population. In addition, we analyzed the correlation of the fecal microbiome with liver function indicators in infants with cholestasis.
- Methods
- Methods
- 1. Study design
- 1. Study design
We enrolled 12 patients with BA and 8 non-BA cholestasis from Cipto Mangunkusumo Hospital, an Indonesian referral hospital. We also enrolled 8 HC infants from integrated health service posts, a center for pre- and postnatal health care in Central Jakarta. The general inclusion criteria were age less than 4 months, no history of diarrhea or gastrointestinal diseases, and no antibiotic use within 2 weeks prior to sample collection. BA patients were confirmed through intraoperative cholangiography. Non-BA cholestasis patients must meet the criteria of direct/conjugated bilirubin levels exceeding 1 mg/dL when total bilirubin is below 5 mg/dL or more than 20% of total bilirubin when total bilirubin is above 5 mg/dL. The HC group comprised the infants who were age-matched to those with cholestasis and were cleared as healthy by a medical doctor in integrated health service posts, a center for pre- and postnatal health care in Central Jakarta. One infant in the BA group and one infant in the non-BA cholestasis group were born preterm (35–36 weeks’ gestation), while the remaining participants were born full-term. None of the infants had a history of total parenteral nutrition (TPN), no complementary feeding, no gastrointestinal disease, or other underlying conditions known to affect liver function or gut microbiota composition. The study was approved by the Ethical Committee of Cipto Mangunkususo Hospital and Faculty of Medicine, Universitas Indonesia, with the number KET-1676/UN2.F1/LTIK/PPM.00.02/2023.- 2. Sample collection
- 2. Sample collection
Informed consent was obtained from each participant’s guardians before sample collection. We also collected supporting data, which included the demographic characteristics of patients via questionnaires. We collected fecal samples from BA patients, non-BA cholestasis patients, and HCs. The samples were collected immediately after defecation and transferred to the laboratory in ice gel within 1 hour. The collected fecal samples were preserved at -80°C until further analysis. The medical records of BA and non-BA groups were collected for further analysis.- 3. DNA extraction and quantification
- 3. DNA extraction and quantification
DNA was extracted from the fecal samples following instructions from the QIAamp Fast DNA Stool Mini Kit (51604, QIAGEN, Germany). Two hundred milligrams of stool samples were weighed in a centrifuge tube, and 1 mL of Inhibitex Buffer was added to each sample. The mixture was then homogenized and incubated at 95°C for 10 minutes. After incubation, the mixture was centrifuged, and the supernatant was added to a new tube containing Protease K. Buffer AL was added to the mixture and incubated at 70°C for 10 minutes. Ethanol was added to the mixture, which was subsequently homogenized and transferred to the spin column for centrifugation. Wash buffers 1 and 2 were added sequentially to the spin column. After that, elution buffer was added, and the mixture was finally centrifuged. A NanoDrop spectrophotometer 2000 (Thermo Scientific, USA) was used to determine DNA concentration and purity. Qubit 4.0 (Invitrogen, USA) was used to measure dsDNA accurately before library preparation.- 4. Library preparation and metagenomic sequencing
- 4. Library preparation and metagenomic sequencing
The hypervariable V3-V4 regions of the bacterial 16S rRNA gene were amplified with the primers 341F and 805R. The polymerase chain reactions (PCRs) product was then cleaned using AMPure. After that, index PCR was performed, and DNA clean-up was performed again. Purified amplicons were pooled in equimolar amounts and paired end sequenced on an Illumina MiSeq System (Illumina, USA).- 5. Bioinformatic analysis of metagenomic sequencing
- 5. Bioinformatic analysis of metagenomic sequencing
Illumina raw reads were analyzed using Quantitative Insights Into Microbial Ecology 2 (QIIME2). The forward and reverse reads were demultiplexed, quality-filtered, and visualized. The primers and adapters were removed using the QIIME2 cutadapt plugin. The reads containing low-quality bases (Q<30) were trimmed. The reads were clustered into features on the basis of 97% similarity. The retained features were aligned with SILVA 132 ribosomal RNA databases at 99% shared identity via the “qiime feature-classifier classify-sklearn” command. Alpha and beta diversity were calculated for the taxonomic level of the species using the Shannon, Pielou, Faith and Jaccard similarity indices.- 6. Statistical analysis
- 6. Statistical analysis
IBM SPSS Statistics ver. 29.0 (IBM Co., 9 USA) was used to analyze the data in this study. We present demographic data as median values (minimum, maximum), while microbiome counts are presented as mean±standard deviation. Student t tests and analysis of variance (ANOVA) were used to analyze the clinical and demographic data. The statistical significance of differences between groups was calculated using the Mann-Whitney U test or independent t test for 2 groups, whereas the Kruskall-Wallis test or ANOVA was used for 3 groups. The differences were considered significant at P<0.05. Principal coordinate analysis (PCoA) between species was used to evaluate the β-diversity of the gut microbial composition and permutational multivariate ANOVA (PERMANOVA) was performed using R. Spearman correlation coefficients were calculated to investigate the relationships between liver function indicators and the gut microbiome composition.
- Results
- Results
- 1. Characteristic of the BA, non-BA, and HCs
- 1. Characteristic of the BA, non-BA, and HCs
We included 12 BA patients and 8 non-BA cholestasis patients, with median ages of 80 days (29–93 days) and 76.5 days (20–115 days), respectively. Eight age-matched healthy infants were recruited at similar ages to those in the BA and non-BA groups. Table 1 summarizes the baseline characteristics of the total infants recruited. The demographic characteristics revealed that none of the above environmental factors significantly differed (all P>0.05) between the BA and non-BA groups.The baseline diet was equivalent between the BA and non-BA groups but significantly different between the cholestasis and healthy groups. A higher proportion of HC infants were exclusively breastfed, whereas infants in both the BA and non-BA cholestasis groups primarily received formula milk supplemented with medium-chain triglycerides (MCTs). Compared to HCs, infants in the non-BA cholestasis group exhibited shorter stature and lower body weight, while infants in the BA group had significantly lower body weight than those HC infants.One preterm infant in each of the BA and non-BA groups was born at 35–36 weeks of gestation, with birth weights of 2,000 and 3,000 g, respectively. The preterm BA infant received enteral nutrition (feeding tube) and was managed with standard nursing care, while the preterm non-BA infant demonstrated regular oral feeding. Neither infant had a history of TPN, antibiotic exposure prior to stool sampling, or clinically documented sepsis.Table 2 shows the clinical characteristics of liver function indices from BA and non-BA groups. There were no significant differences between BA and non-BA groups in total bilirubin, direct bilirubin, albumin, alkaline phosphatase (ALP), aspartate transferase (AST), or alanine transaminase (ALT). A significant difference was found in the gamma glutamyl transferase (GGT) level, which was greater in the BA group 1,044 U/L (204–2,311 U/L) than in the non-BA group 247 U/L (43–625 U/L).- 2. Taxonomic profiles of the fecal microbiota in the BA, non-BA cholestasis, and HC groups
- 2. Taxonomic profiles of the fecal microbiota in the BA, non-BA cholestasis, and HC groups
We analyzed the gut microbial community features within the group using 16S rRNA gene sequencing targeting the V3-V4 regions. Relative taxonomic abundances in the BA groups were compared with those in the non-BA cholestasis and HC groups. A total of 802 features were annotated into 9 phyla, 14 classes, 35 ordos, 61 families, and 96 genera.At the phylum level, Proteobacteria, Firmicutes, and Bacteroidota were the most prevalent among all groups. Proteobacteria were highly enriched in the non-BA group, contributing 65.3%, followed by the BA group (43.21 %) and the HC group (31.78%). Compared with the HC group, the BA and non-BA cholestasis groups presented a conspicuously lower abundance of Firmicutes with almost similar percentages (21.95% and 23.42%). The Bacteroidota accounted for 26.55% of the bacteria in the BA group, which was significantly greater than the 20.66% in the HC group. Moreover, Bacteroidota was found in only 6.48% of the non-BA cholestasis group. The phylum-level composition of each group is presented in Fig. 1A.To investigate the differences in microbial composition at the deeper taxonomic level, we analyzed the relative microbial abundance at the genus level. Fig. 1B shows the 11 most abundant genera among the 3 groups. Streptococcus and Gammaproteobacteria were visually dominant in all the groups, whereas Allorhizobium-Neorhizobium-Pararhizobium-Rhizobium was more common in the BA and non-BA cholestasis groups. The HC group had the greatest number of genera with 76 genera identified, followed by the BA group with 62 genera. In contrast, the non-BA cholestasis group showed a notable reduction in fecal microbiome diversity, with only 50 genera detected.The genus-level characterization proved to be more complex and variable than at the phylum level. Several bacterial genera significantly differed among the groups (P<0.05, Mann-Whitney U test). As shown in Fig. 2A, Bacteroides was a dominant genus and was significantly more abundant in the BA group (25.40%) than in the non-BA cholestasis group (6.42%). Additionally, a higher number of unclassified genera from the family Enterobacteriaceae was also found in the BA group than in the HC group (Fig. 2B). Klebsiella was significantly enriched in the non-BA cholestasis group compared with the HC group (Fig. 2C), whereas the abundance of the unclassified family Lachnospiraceae was significantly greater in the HC group (Fig. 2D). Parabacteroides was also more prevalent in the HC group than in the other groups, as displayed in Fig. 2E. Fig. 2F illustrates the elevated abundance of Bacteroides fragilis, as the dominant Bacteroides in the BA group.Other significant differences in the relative abundance of several genera were observed within the groups. Dialister was significantly enriched in the BA group compared with the other 2 groups. In contrast, the abundances of Chryseobacterium, Acinetobacter, and Pseudomonas were significantly greater in the non-BA cholestasis group than in the other 2 groups. The HC group was significantly enriched with Actinomyces, Anaerococcus, Clostridium innocuum group, Collinsella, Gemella, and Peptostreptococcaceae. However, these taxa were not classifically dominant since their relative abundances were less than 1%.- 3. Comparable alpha and beta diversity of fecal microbiota in the BA, non-BA cholestasis, and HC groups
- 3. Comparable alpha and beta diversity of fecal microbiota in the BA, non-BA cholestasis, and HC groups
The microbial alpha diversity was calculated to evaluate differences in the gut microbiome composition across groups. The results revealed that the alpha diversity in the HC group was significantly lower than that in the BA group, as measured by the Shannon index (P=0.008) and Pielou’s evenness index (P=0.023) (Fig. 3A and B). Additionally, the Pielou index significantly differed between the non-BA and HC groups (P=0.037) (Fig. 3B). However, no significant differences were observed among the 3 groups for phylogenetic richness, as analyzed by Faith’s phylogenetic diversity index.To clarify the differences in the gut microbiota among the study groups, we analyzed community structure variation via PCoA based on the Jaccard similarity index. Our findings demonstrated distinct divergence in overall fecal microbiome compositions in the BA and non-BA groups, which deviated from each other. In contrast, the HC group exhibited greater dispersion. The PERMANOVA indicated that the composition of the fecal microbiota significantly differed between the groups (P=0.01) (Fig. 3C).To determine the differences in microbiota composition and diversity in cytomegalovirus (CMV)-positive (CMV+) and CMV-negative (CMV-) subjects, we analyzed each subgroup. Lactobacillus abundance was significantly higher in CMV-positive patients compared to CMV-negative patients within both the BA group (P=0.037) and the non- BA group (P=0.022) as shown in Fig. 4A. Additionally, Escherichia-Shigella was found to be significantly more abundant in the non-BA CMV¯ group, with a relative abundance of 43.97%, with a P value of 0.025 (Fig. 4B). Alpha diversity measured by Faith’s phylogenetic diversity index was also significantly greater in CMV+ patients in both BA (P=0.012) and non-BA subgroups (P=0.036), indicating increased microbial richness associated with CMV infection (Fig. 4C and D). However, due to the small sample size in each group, beta diversity analysis was performed on the combined cholestasis group, where no significant differences were observed between CMV+ and CMV– patients (PERMANOVA test, P=0.659), suggesting similar overall microbial community structures regardless of fecal CMV status at the broader group level.- 4. Liver function indicator correlate with gut microbial alteration
- 4. Liver function indicator correlate with gut microbial alteration
To investigate the relationship between gut microbiota and liver enzyme levels, we performed Spearman's correlation analysis. As shown in Fig. 5, the abundance of the uncultured family Neisseriaceae, which belongs to the phylum Proteobacteria, was negatively correlated with bilirubin and transaminase enzymes. Corynebacterium, Lactobacillus, Veillonella, and Klebsiella showed a positive correlation with the serum albumin concentration, whereas Acinetobacter, Acidaminococcus, Pseudomonas, and Stenotrophomonas were negatively correlated with the albumin concentration.Interestingly, Bacteroides was positively correlated with GGT levels. Notably, Bacteroides fragilis was markedly elevated in the BA group accounting for 25.97% of the Bacteroides genus, compared to 1.47% in the HC group and 6.56% in the non-BA group (Fig. 2F). Parabacteroides also showed a positive correlation with GGT levels, whereas Eikenella was negatively correlated with GGT levels. Furthermore, we also found that Rothia, unclassified ordo Aeromonadales, and unclassified family Enterobacteriaceae were positively correlated with ALP levels, while Parabacteroides and Pseudomonas were negatively correlated with ALP levels. In addition, several genera, including Chryseobacterium, Dialister, Roseomonas, Allorhizobium-Neorhizobium-Pararhizobium-Rhizobium, the unclassified family Sphingomonadaceae, the uncultured family Neissseraceae, and Escherichia-Shigella, were negatively correlated with transaminase enzymes, while Stenotrophomonas exhibited a positive correlation. These findings highlight the significant correlation between specific gut microbial taxa and liver function markers, suggesting that certain bacteria may exert either pathogenic or hepatoprotective roles in liver health.
- Discussion
- Discussion
Alterations in the human gut microbiome are widely known to correlate with the progression of liver diseases. An imbalance in the gut microbiome disrupts intestinal permeability, which allows bacterial translocation to the liver via the portal vein. Moreover, bacterial translocation aggravates inflammation in the liver cells [7]. Thus, restoring gut microbiome dysbiosis has emerged as a promising therapy to delay liver injury progression in various liver diseases.Cholestasis is a liver disease commonly found in newborns and infants, with various etiologies including infection, drug-related, immune-mediated, circulation disorders, and genetic/metabolic causes [10]. Among these, BA is the most frequent cause of cholestasis in infants, contributing to the most common cause of liver transplants in children [11]. Several studies have shown the disturbance of the gut microbiome in BA. Song et al. [9] reported the dominance of Klebsiella, Streptococcus, Veillonella, and Enterococcus in BA [9]. Another study by Van Wessel et al. [4] found a greater abundance of Streptococcus and a lower abundance of Lachnospiraceae and Bifidobacteriaceae in the BA of the Dutch population [4]. We conclude that gut microbiome disturbance in BA varies between populations. This finding is also supported by Syromyatnikov et al. [12], who summarized the different gut microbiome compositions between nationalities.The gut microbiome diversity in infants is strongly influenced by several factors, including mode of birth delivery, disease condition, breastmilk diet, and formula milk diet [13]. Our study revealed that mode of delivery and diet patterns impacted several genera. Overall, the results revealed that infants born by cesarean section have lower diversity than those born vaginally. This reduction in diversity may be attributed to the lack of exposure to maternal vaginal microbiota during birth [14]. Moreover, this study revealed that the genus Bacteroides was more abundant in infants with a formula-fed diet. Wang et al. [13] reported that Bacteroides was found in breast milk, and its proportion continues to increase as the infant matures. Bacteroides is widely known as a regulator of human milk oligosaccharide metabolism, highlighting its importance in early gut colonization and developmentThis study explored gut microbiome disturbance in BA patients within the Indonesian population. Bile duct obstruction in BA enables bile flow to the intestine, whereas other causes of cholestasis are characterized by reduced bile flow [11]. To account for these physiological differences, we also investigated the gut microbiome composition in non-BA cholestasis patients, given the known disparities in intestinal bile acid concentrations between BA and non-BA cholestasis. Compared to the HC group, both cholestasis groups exhibited notable alterations in gut microbiota including the elimination of specific taxa, fluctuations in bacterial density, and significant differences in microbial diversity.At the phylum level, the cholestasis group presented an increased abundance of Proteobacteria and a decreased abundance of Firmicutes. Proteobacteria are the largest phylum within the bacterial domain and are well-known as an opportunistic pathogen causing both intestinal and extraintestinal diseases. However, it is also noteworthy that Proteobacteria are generally abundant in healthy newborns, and their proportion typically declines with age [15]. Firmicutes comprises gram-positive bacteria that play essential roles in nutrient metabolism and host physiological processes by synthesizing short-chain fatty acids (SCFAs) [16]. SCFAs are critical for maintaining intestinal metabolism, preserving intestinal barrier integrity, and suppressing proinflammatory cytokine production [17].Interestingly, the relative abundance of Bacteroidota was significantly greater in the BA group than in the HC group and was excessively lower in the non-BA group. Along with Firmicutes, Bacteroidetes are essential for maintaining gut homeostasis [16]. However, higher Bacteroidetes reduced the Firmicutes/Bacteroidetes (F/B) ratio. Disruption of the F/B ratio has been widely associated with gut dysbiosis in the gastrointestinal tract, which affects host immunity and promotes inflammatory responses. Several diseases have been repeatedly reported to be correlated with changes in the F/B ratio, including obesity, type 2 diabetes, and inflammatory bowel disease [16].The classification at the genus level revealed considerable complexity and variability across groups. The probiotic genus, Bacteroides, was surprisingly more abundant in the BA group than in the HC and non-BA groups. Bacteroides are commensal bacteria in the digestive tract that that are important for providing protection against pathogens and supplying nutritions to other gut inhabitant microbes [18]. However, we also noted that the abundance of Bacteroides fragilis was higher in the BA group compared to the other 2 groups. Teo et al. [19] reported that B. fragilis causes liver abscess and pyelonephritis in a 68-year-old man. Furthermore, our study identified that Bacteroides was positively correlated with GGT level elevation. Effenberger et al. [20] also demonstrated that B. fragilis is associated with cholangitis, highlighting its established role as an infectious agent in the biliary tract. GGT is predominantly localized in the endothelial cells of the bile ducts and the cytoplasm of hepatocytes. Thus, biliary tract infections can lead to elevated serum GGT levels.The number of genera unclassified within the family Enterobacteriaceae was significantly greater in the BA group than in the HC group, whereas the abundance of Klebsiella was significantly higher in the non-BA group than in the HC group. Members of the Enterobacteriaceae are widely known as opportunistic pathogen bacteria that typically exist at low concentrations in the gut without causing symptoms. However, a significant increase in Enterobacteriaceae abundance may affect host immunity responses and has been associated with the pathogenesis of various diseases, including type 2 diabetes, nonalcoholic fatty liver disease, and other obesity-related diseases [21]. This study consistently revealed a positive correlation between unclassified Enterobacteriaceae and ALP levels.Dialister was also enriched in the BA group compared with the HC group, whereas Chryseobacterium, Acinetobacter, and Pseudomonas were significantly enriched in the non-BA group. An increased abundance of Pseudomonas, Klebsiella, and Dialister has been associated with various diseases, such as pneumonia and infections of soft tissue and surgical wounds, gastrointestinal tract, urinary tract, and the bloodstream [22-24]. Interestingly, Klebsiella was positively correlated with the albumin concentration, while Dialister was negatively correlated with the ALT concentration in the cholestasis group.Parabacteroides contribute to host health through their role in carbohydrate metabolism and SCFA synthesis [25]. Surprisingly, this study revealed that Parabacteroides abundance was positively correlated with GGT but negatively correlated with ALP in the cholestasis groups. Despite these correlations, our data report that the abundance of Parabacteroides was extremely low in the cholestasis groups. Unclassified genera belonging to the family Lachnospiraceae were detected exclusively in HC. Along with Clostridiaceae and Peptostreptococcaceae, Lachnospiraceae is among the major producers of the SCFA butyrate [25]. Consistently, unclassified Peptostreptococcaceae were also significantly enriched in HC. In addition, several genera, including Actinomyces, Anaerococcus, Clostridium innocuum group, Collinsella, and Gemella, were enriched in HC. Actinomyces, Clostridium, Collinsella, and Gemella, have been identified as SCFA producers contributing to the synthesis of propionate, butyrate, lactate, and acetate [25-27].The overall composition of the gut microbiome was comparable across groups based on alpha and beta diversity. The Shannon diversity index was significantly higher in the BA group compared to those in the HC, whereas Pielou evenness was higher in the BA and non-BA groups than in the HC group. Wang et al. [28] previously reported that alpha diversity in BA patients was significantly lower than in healthy individuals. However, according to Shade et al. [29], the interpretation of alpha diversity requires more than just measurements of numerical indices, but also background data. Even though the BA and non-BA groups exhibited higher Shannon and Pielou indices than the HC group in our study, the HC group showed the greatest variation in the number of genera (76 genera), followed by the BA (62 genera) and non-BA (50 genera) groups.Patients with cholestasis are often characterized by hyperbilirubinemia and elevated liver function markers. In our study, several genera exhibit a strong correlation with liver enzyme levels. Other than those previously mentioned, Rothia, unclassified Aeromonadales, and Stenotrophomonas were positively correlated with liver enzymes. Rothia has been identified as an opportunistic pathogen associated with infection in various sites, including the abdomen, lungs, brain, and periodontium [30]. Stenotrophomonas has also been identified as a pathogen that usually infects immunocompromised individuals [31]. Consistently, Stenotrophomonas negatively correlated with the albumin concentration, further supporting its potential role in disease severity.Several genera, including Chryseobacterium, Roseomonas, Allorhizobium-Neorhizobium-Pararhizobium-Rhizobium, unclassified family Sphingomonadaceae, Elkenella, uncultured genus from the family Neisseriaceae, and Escherichia-Shigella, were negatively correlated with liver enzyme levels. Although the aforementioned genera are commonly identified as opportunistic pathogens, our correlation tests suggest that they also exert potentially beneficial effects. For instance, Roseomonas is often associated with various infections. However, recent evidence has demonstrated that Roseomonas mucosa could improve atopic dermatitis through enhancing epithelial barrier function and producing immunomodulatory phospholipids [32].Serum albumin concentration is a critical marker for assessing liver function and detecting hepatic injury. In cholestasis disease, albumin levels are typically reduced due to impaired synthesis by hepatocytes [33]. Corynebacterium, Lactobacillus, and Veillonella were positively correlated with serum albumin levels in the cholestasis groups. Recent studies have highlighted the beneficial role of various Corynebacterium spp. in promoting gut health by producing antimicrobial peptides that inhibit pathogenic infection, stimulate cytokine production, and reduce human cholesterol levels [34]. Lactobacillus and Veillonella are well-known as probiotic genera capable of producing SCFA, contributing to gut and metabolic health [35].Our data indicate that certain bacterial genera are associated with changes in liver indicators. However, some genera still showed inconsistent or unclear correlations with these changes. For example, Pseudomonas and Escherichia-Shigella, which are widely recognized as pathogenic, exhibited reduced abundance in parallel with elevated liver enzyme levels. These elevated enzyme concentrations may be influenced by cytomegalovirus (CMV) infection, particularly in infants with cholestasis. We detected CMV DNA in the fecal samples of 5 non-BA patients and 4 BA patients included in this study [36]. Ye and Zhao [37] previously reported a link between CMV infection and the elevated liver enzymes. CMV infection has been shown to activate nuclear factor kappa B and proinflammatory cytokines, which may contribute to hepatic injury and the subsequent increase in ALT and AST levels [37].In subgroup analysis, we found a higher number of Lactobacillus among CMV-positive individuals in the BA and non-BA groups. Lactobacillus is known to have antiinflammatory properties and to modulate host immune responses [38]. CMV infection can trigger inflammation and immune activation [37]. We speculated that Lactobacillus enrichment in CMV-positive patients may be the body's response to counteracting inflammation. In contrast, the enrichment of Escherichia-Shigella among CMV-negatives in the non-BA group may be due to the absence of innate and adaptive immune responses induced by CMV infection, thus allowing opportunistic pathogens such as Escherichia-Shigella to escalate. Another possibility may be due to the low abundance of Lactobacillus in CMV-negative. Lactobacillus is known to inhibit the growth of pathogenic bacteria through acidification of the environment and production of antimicrobial compounds [39]. Therefore, the absence of Lactobacillus dominance might allow Escherichia-Shigella to thrive.Several factors constitute the limitations of this study. Although the BA patients were recruited from various regions across Indonesia, the overall sample size was relatively small. This reflects the rarity of BA and the logistical challenges associated with recruiting participants and collecting high-quality stool samples from infants with cholestasis. Furthermore, the analysis did not include SCFA measurements, which could have provided further insight into functional correlations with the gut microbiome.Another important limitation of this study is the imbalance in feeding methods among groups, which may introduce potential confounding in the interpreting of gut microbiome differences. While the mode of administration was comparable across groups, most infants in the BA and non-BA cholestasis groups received formula feeding, including specialized formulas containing MCTs, whereas most HCs were breastfed. Given that infant diet is a well-established determinant of early gut microbiota composition, it is possible that some of the observed microbial differences are influenced by feeding patterns rather than disease status alone. Future studies with larger sample sizes and better-matched feeding practices, or with feeding-stratified analyses, are warranted to clarify the specific contributions of disease-related microbial alterations.Despite these limitations, this study provides novel insights into the gut microbiome profiles of infants with BA and non-BA cholestasis. To the best of our knowledge, our data constitute the first report describing gut microbiome profiles in BA and non-BA cholestasis patients from the Indonesian population. In addition, the study provides important preliminary insights that can inform future, larger-scale investigations.In conclusion, the microbiome compositions of BA and non-BA patients were notably different from those in HCs. Alpha and beta diversity were significantly different between the BA and HC groups, as well as between the non-BA and HC groups. The correlation between the microbiota and liver indicators indicates that several taxa, such as Bacteroides, Klebsiella, Parabacteroides, and Enterobacteriaceae might impact liver injury severity in cholestasis infants. Our data reveal possible microbial-specific alterations, which are important for future potential treatments to inhibit liver disease progression in cholestasis infants.
- Notes
-
Acknowledgments
NA acknowledges the Indonesian Ministry of Education, Culture, Research, and Technology for providing scholarship to Magister and Doctoral Programs in Biomedical Science. The authors extend their appreciation to the Program Magister Menuju Doktor Untuk Sarjana Unggul (PMDSU) for funding this work.
-
- Conflicts of interest
-
Conflicts of interest No potential conflict of interest relevant to this article was reported.
-
- Notes
-
Funding
This research was supported by a Research Grant for Pendidikan Magister menuju Doktor untuk Sarjana Unggul (PMDSU), No. NKB-850/UN2.RST/HKP.05.00/2024, initiated by the Indonesian Ministry of Education, Culture, Research, and Technology.
-
- Notes
-
Author contribution
Conceptualization: NA, FS, HO; Data curation: NA, FF; Formal analysis: NA, FF; Funding acquisition: HO, FS; Visualization: HO, MK, SWL; Methodology: NA, FS, FF; Project administration: NA, HO, FS; Writing – original draft: NA, FS; Writing – review & editing: SWL, MK, FF, HO
-
Fig. 1.
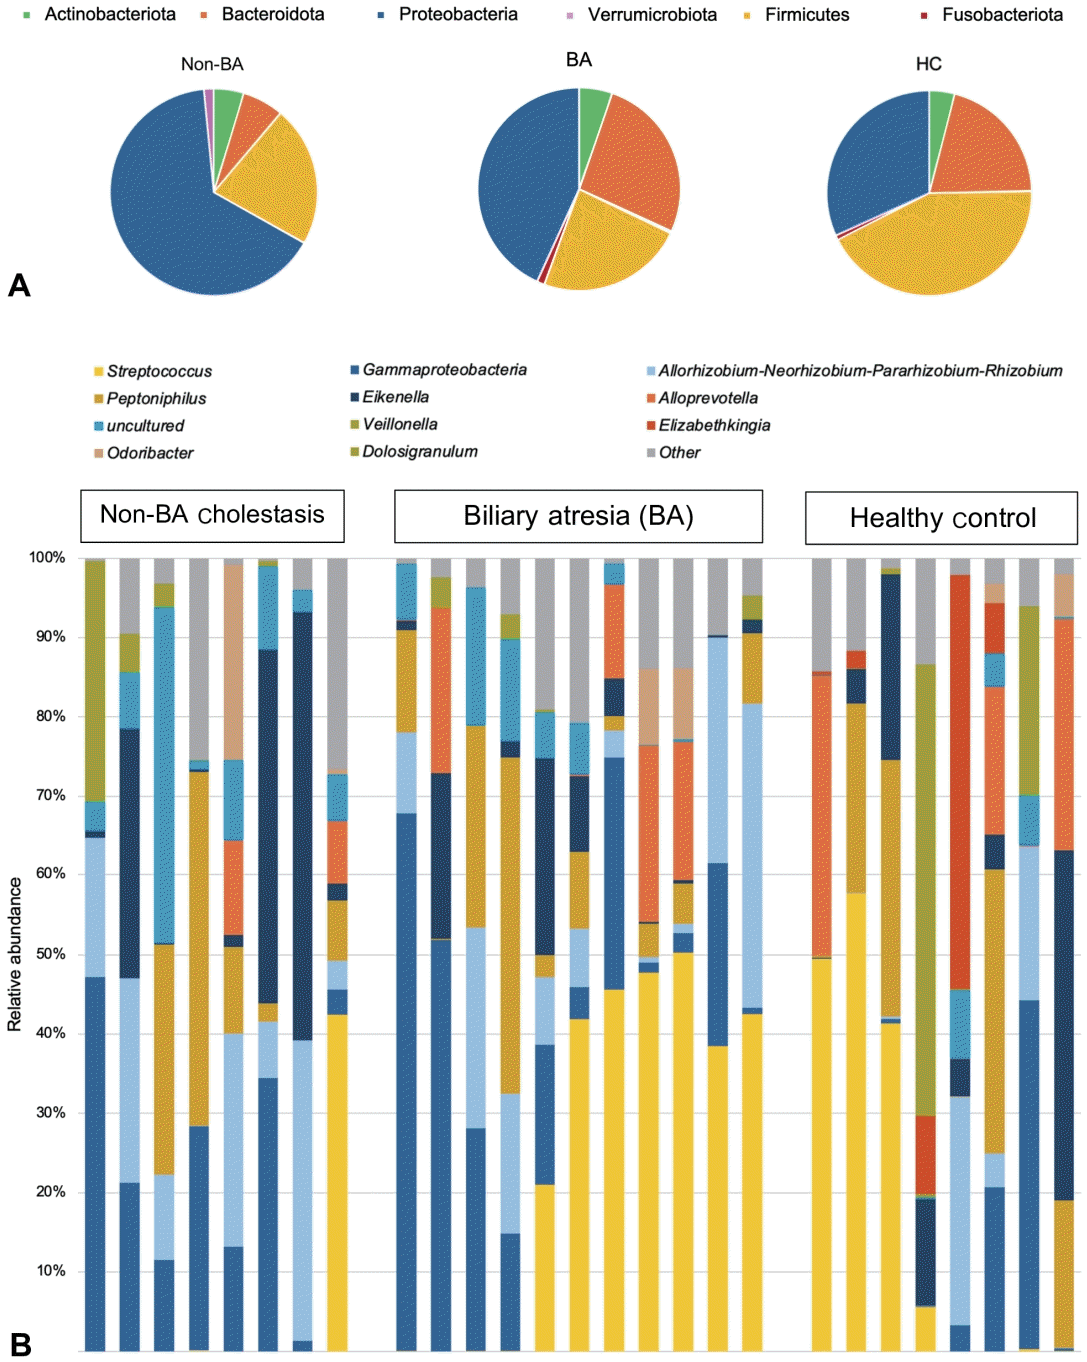
Fig. 2.
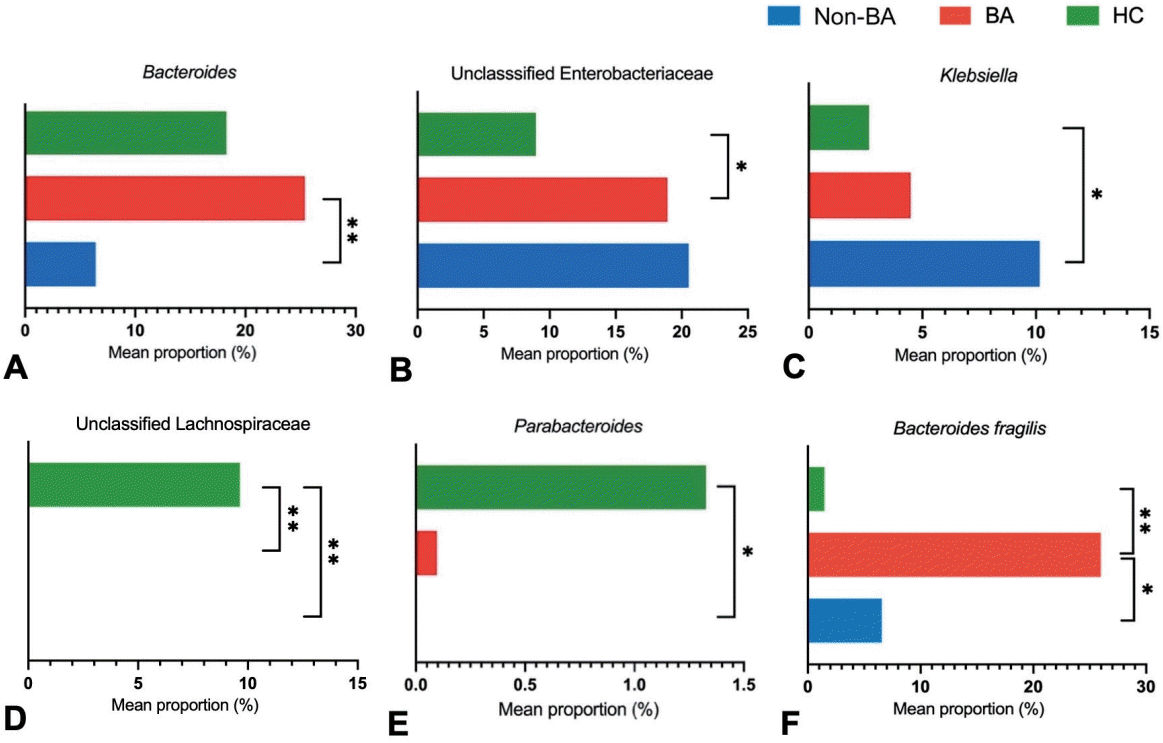
Fig. 3.

Fig. 4.
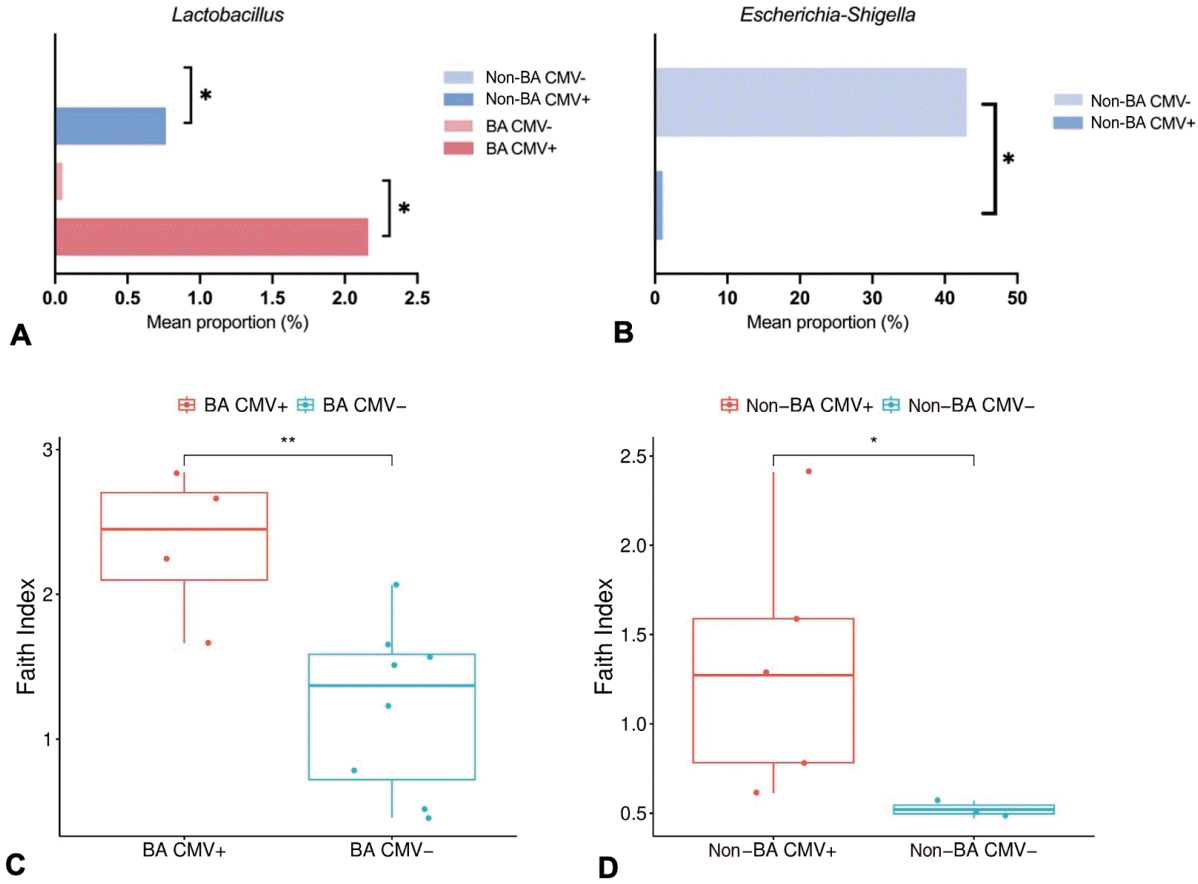
Fig. 5.

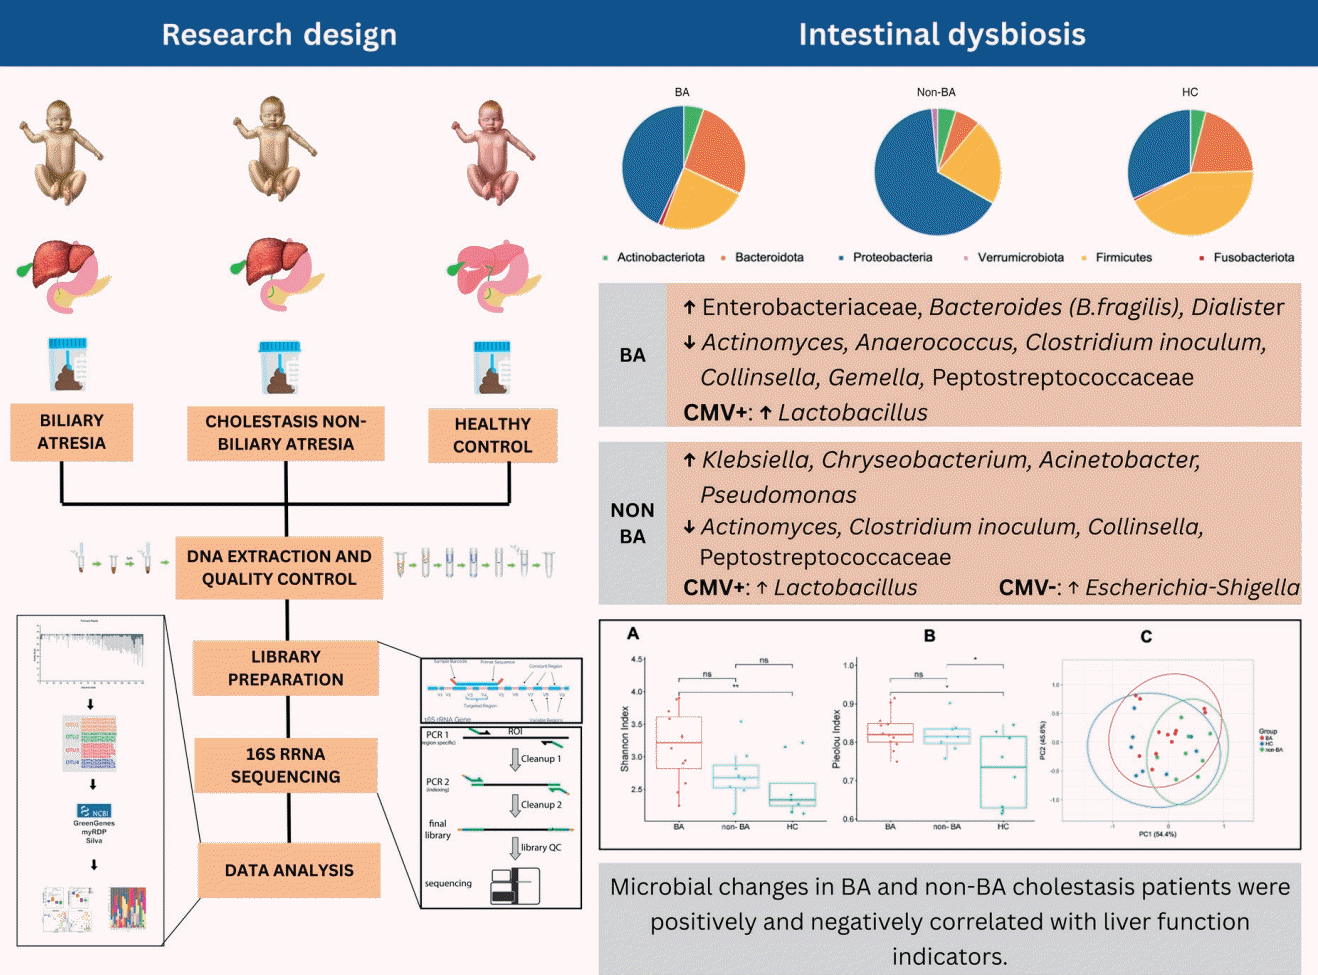
Table 1.
Table 2.
- References
- 1. Xie S, Wei S, Ma X, Wang R, He T, Zhang Z, et al. Genetic alterations and molecular mechanisms underlying hereditary intrahepatic cholestasis. Front Pharmacol 2023;14:1173542
[Article] [PubMed] [PMC]2. Davenport M, Muntean A, Hadzic N. Biliary atresia: clinical phenotypes and aetiological heterogeneity. J Clin Med 2021;10:5675
[Article] [PubMed] [PMC]3. Kelly D, Samyn M, Schwarz KB. Biliary atresia in adolescence and adult life: medical, surgical and psychological aspects. J Clin Med 2023;12:1594
[Article] [PubMed] [PMC]4. Van Wessel D, Nomden M, Bruggink J, De Kleine R, Kurilshikov A, Verkade H, et al. Gut microbiota composition of biliary atresia patients before kasai portoenterostomy associates with long-term outcome. J Pediatr Gastroenterol Nutr 2021;73:485–90.
[Article] [PubMed] [PMC]5. Hou K, Wu ZX, Chen XY, Wang JQ, Zhang D, Xiao C, et al. Microbiota in health and diseases. Signal Transduct Target Ther 2022;7:135
[Article] [PubMed] [PMC]6. Zhao M, Chu J, Feng S, Guo C, Xue B, He K, et al. Immunological mechanisms of inflammatory diseases caused by gut microbiota dysbiosis: a review. Biomed Pharmacother 2023;164:114985
[Article] [PubMed]7. Albhaisi SA, Bajaj JS, Sanyal AJ. The role of the gut microbiota in liver disease. Am J Physiol Gastrointest Liver Physiol 2020;318:G84–98.
[PubMed]8. Isaacs-Ten A, Echeandia M, Moreno-Gonzalez M, Brion A, Goldson A, Philo M, et al. Intestinal microbiome-macrophage crosstalk contributes to cholestatic liver disease by promoting intestinal permeability in mice. Hepatology 2020;72:2090–108.
[Article] [PubMed] [PMC]9. Song W, Sun LY, Zhu ZJ, Wei L, Qu W, Zeng ZG, et al. Association of gut microbiota and metabolites with disease progression in children with biliary atresia. Front Immunol 2021;12:698900
[Article] [PubMed] [PMC]10. Wang H, Yang L, Wang J. Etiology of neonatal cholestasis after emerging molecular diagnostics. Transl Pediatr 2022;11:359–67.
[Article] [PubMed] [PMC]11. Feldman AG, Sokol RJ. Neonatal cholestasis: updates on diagnostics, therapeutics, and prevention. Neoreviews 2021;22:E819–36.
[Article] [PubMed] [PMC]12. Syromyatnikov M, Nesterova E, Gladkikh M, Smirnova Y, Gryaznova M, Popov V. Characteristics of the gut bacterial composition in people of different nationalities and religions. Microorganisms 2022;10:1886
[Article] [PubMed] [PMC]13. Wang K, Xia X, Sun L, Wang H, Li Q, Yang Z, et al. Microbial diversity and correlation between breast milk and the infant gut. Foods 2023;12:1740
[Article] [PubMed] [PMC]14. Moya A, Ferrer M. Functional redundancy-induced stability of gut microbiota subjected to disturbance. Trends Microbiol 2016;24:402–13.
[Article] [PubMed]15. Kuang YS, Li SH, Guo Y, Lu JH, He JR, Luo BJ, et al. Composition of gut microbiota in infants in China and global comparison. Sci Rep 2016;6:36666
[Article] [PubMed] [PMC]16. Stojanov S, Berlec A, Štrukelj B. The influence of probiotics on the Firmicutes/Bacteroidetes ratio in the treatment of obesity and inflammatory bowel disease. Microorganisms 2020;8:1715
[Article] [PubMed] [PMC]17. Pant K, Venugopal SK, Lorenzo Pisarello MJ, Gradilone SA. The role of gut microbiome-derived short-chain fatty acid butyrate in hepatobiliary diseases. Am J Pathol 2023;193:1455–67.
[Article] [PubMed] [PMC]18. Zafar H, Saier MH. Gut Bacteroides species in health and disease. Gut Microbes 2021;13:1–20.
[Article] [PubMed] [PMC]19. Teo PS, Chong XY, Chang CY, Deen AN, Zaid M. Bacteroides fragilis causing liver abscess and pyelonephritis. J Global Infect Dis 2024;16:39–40.
[Article] [PubMed] [PMC]20. Effenberger M, Al-Zoairy R, Gstir R, Graziadei I, Schwaighofer H, Tilg H, et al. Transmission of oral microbiota to the biliary tract during endoscopic retrograde cholangiography. BMC Gastroenterol 2023;23:103
[Article] [PubMed] [PMC]21. Moreira de Gouveia MI, Bernalier-Donadille A, Jubelin G. Enterobacteriaceae in the human gut: dynamics and ecological roles in health and disease. Biology 2024;13:142
[Article] [PubMed] [PMC]22. Wheatley RM, Caballero JD, van der Schalk TE, De Winter FH, Shaw LP, Kapel N, et al. Gut to lung translocation and antibiotic mediated selection shape the dynamics of Pseudomonas aeruginosa in an ICU patient. Nat Commun 2022;13:6523
[Article] [PubMed] [PMC]23. Dong N, Yang X, Chan EW, Zhang R, Chen S. Klebsiella species: taxonomy, hypervirulence and multidrug resistance-NC-ND license. EBioMedicine 2022;79:103998
[Article] [PubMed] [PMC]24. Tito RY, Cypers H, Joossens M, Varkas G, Van Praet L, Glorieus E, et al. Brief report: Dialister as a microbial marker of disease activity in spondyloarthritis. Arthritis Rheumatol 2017;69:114–21.
[Article] [PubMed]25. Louis P, Flint HJ. Formation of propionate and butyrate by the human colonic microbiota. Environ Microbiol 2017;19:29–41.
[Article] [PubMed]26. Guo P, Zhang K, Ma X, He P. Clostridium species as probiotics: Potentials and challenges. J Animal Sci Biotechnol 2020;11:24
[Article] [PubMed] [PMC]27. Torres-Morales J, Mark Welch JL, Dewhirst FE, Borisy GG. Site-specialization of human oral Gemella species. J Oral Microbiol 2023;15:2225261
[Article] [PubMed] [PMC]28. Wang J, Qian T, Jiang J, Yang Y, Shen Z, Huang Y, et al. Gut microbial profile in biliary atresia: a case-control study. J Gastroenterol Hepatol 2020;35:334–42.
[Article] [PubMed]29. Shade A. Diversity is the question, not the answer. ISME J 2017;11:1–6.
[Article] [PubMed] [PMC]30. Fatahi-Bafghi M. Characterization of the Rothia spp. and their role in human clinical infections. Infect Genet Evol 2021;93:104877
[Article] [PubMed]31. Adegoke AA, Stenström TA, Okoh AI. Stenotrophomonas maltophilia as an emerging ubiquitous pathogen: Looking beyond contemporary antibiotic therapy. Front Microbiol 2017;8:2276
[Article] [PubMed] [PMC]32. Myles IA, Earland NJ, Anderson ED, Moore IN, Kieh MD, Williams KW, et al. First-in-human topical microbiome transplantation with Roseomonas mucosa for atopic dermatitis. JCI Insight 2018;3(9): e120608
[Article] [PubMed] [PMC]33. Sharma P. Value of liver function tests in cirrhosis. J Clin Exp Hepatol 2022;12:948–64.
[Article] [PubMed] [PMC]34. Shamsuzzaman M, Dahal RH, Kim S, Kim J. Genome insight and probiotic potential of three novel species of the genus Corynebacterium. Front Microbiol 2023;14:1225282
[Article] [PubMed] [PMC]35. Hung JH, Zhang SM, Huang SL. Nitrate promotes the growth and the production of short-chain fatty acids and tryptophan from commensal anaerobe Veillonella dispar in the lactate-deficient environment by facilitating the catabolism of glutamate and aspartate. Appl Environ Microbiol 2024;90:e0114824.
[Article] [PubMed] [PMC]36. Azizah N, Oswari H, Sjatha F. Detection of cytomegalovirus (CMV) in fecal samples of cholestasis infants by real-time Polymerase-Chain Reaction – a pilot study. Microbes Infect Dis 2025;6:2003–12.
[Article]37. Ye B, Zhao H. Early abnormal liver enzyme levels may increase the prevalence of human cytomegalovirus antigenaemia after hematopoietic stem cell transplantation. J Int Med Res 2017;45:673–9.
[Article] [PubMed] [PMC]