Pediatric patients with cancer exhibit increased neutrophil extracellular traps and reduced active deoxyribonuclease I: diagnostic, prognostic, and therapeutic opportunities
Article information

Abstract
Background
Neutrophil extracellular traps (NETs) contribute to cancer progression; however, their value as systemic biomarkers and therapeutic targets in pediatric cancers remains unclear.
Purpose
To evaluate circulating NET markers as minimally invasive diagnostic and prognostic biomarkers in pediatric cancer and explore the restoration of NET degradation as a therapeutic strategy using recombinant human deoxyribonuclease I (DNaseI).
Methods
In this prospective cohort study, plasma samples from 182 pediatric patients with diverse tumor types and 10 age-matched healthy controls were analyzed. Circulating NET markers, including cell-free DNA, calprotectin, neutrophil elastase, citrullinated histone H3–DNA complexes, and DNaseI activity, were quantified. NETs were assessed in tumor tissue samples using immunofluorescence. The diagnostic performance and prognostic value were evaluated using receiver operating characteristic and survival analyses, respectively. The ability of patient plasma to degrade NETs and the effects of recombinant human DNaseI supplementation were examined in vitro.
Results
Plasma cell-free DNA and calprotectin levels were significantly higher in pediatric patients with cancer than in controls, particularly in high-risk patients. Cell-free DNA showed high diagnostic accuracy, whereas calprotectin and DNaseI activity discriminated between high- and low-risk patients and were associated with adverse outcomes. NETs were detected in tumor tissues with heterogeneous distribution and no consistent association with prognosis. Plasma from high-risk patients exhibited impaired NET degradation, which was restored in vitro using recombinant human DNaseI.
Conclusion
Circulating NETs, especially cell-free DNA and calprotectin, show promise as noninvasive diagnostic and prognostic biomarkers for pediatric cancers. Reduced DNaseI activity identified a potentially targetable mechanism, supporting further investigation of DNaseI-based therapeutic strategies for high-risk pediatric tumors.
Key message
· Circulating neutrophil extracellular trap (NET) markers are increased in pediatric cancer and correlate with disease risk and outcomes.
· Cell-free DNA and calprotectin levels show diagnostic and prognostic value, whereas impaired deoxyribonuclease I activity identifies a targetable mechanism.
· NEPs are promising biomarkers and therapeutic targets for high-risk pediatric tumors.
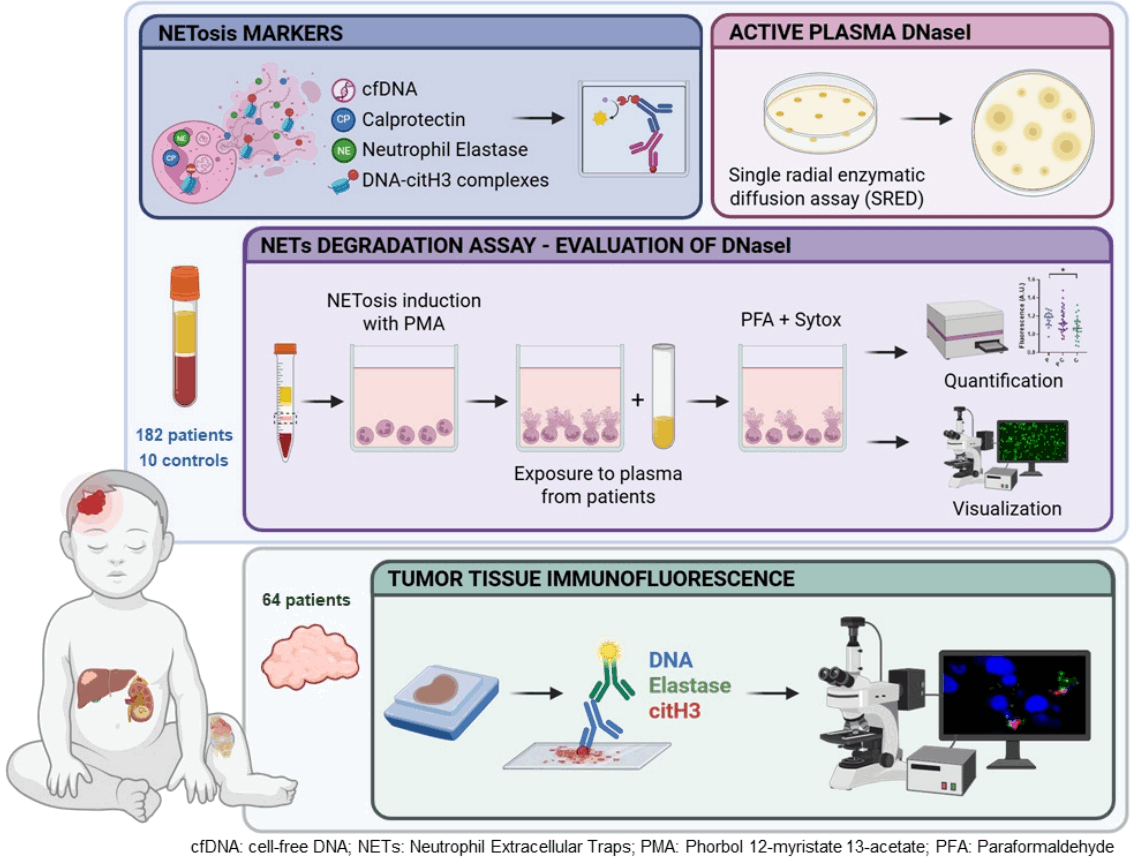
Graphical abstract
Introduction
Pediatric cancers are a heterogeneous group of diseases and remain the leading cause of disease-related mortality in children worldwide [1]. Although survival has improved to over 80% in high-income countries, approximately 20% of patients present with aggressive, refractory subtypes for which current therapies are insufficient [1]. Given that the immune system plays an important role in cancer progression, immunotherapy has emerged as a promising therapeutic approach [2]. However, its clinical implementation in pediatric solid tumors is limited compared with adult cancers [3] and certain leukemias [4], highlighting the need for biomarkers that capture systemic tumor-host interactions. There is an urgent need for minimally invasive biomarkers that refine risk stratification improve prognostic assessment, and support the development of novel immunomodulatory and microenvironment targeted therapeutic strategies [5,6].
Neutrophils constitute 50%–70% of circulating leukocytes and play key roles in innate immunity, acting as the first line of defense from birth and the earliest responders to inflammatory stimuli [7,8]. Upon activation, neutrophils can release neutrophil extracellular traps (NETs) through a process known as NETosis [9]. These structures are composed of decondensed DNA bound to histones, along with granular and cytoplasmic proteins. NETs are released in various contexts, including inflammation, thrombosis, and other pathological conditions [10]. Growing evidence suggests that NETosis contributes to cancer progression by promoting metastasis [11,12], enhancing tumor aggressiveness [13], and inducing chemoresistance [14]. Interestingly, novel therapeutic strategies are currently being developed to target this mechanism [12], mainly focusing on adult tumors [15]. Studies on NETosis in pediatric tumors, although often limited to small cohorts, suggest a dysregulation of NETosis in Ewing sarcoma [16], neuroblastoma [17], lymphoma [15], and osteosarcoma [18]. Thus, further investigation into the role of NETosis is urgently needed in other pediatric cancer subtypes [15]. This study evaluated whether NETosis is dysregulated across pediatric cancers and whether plasma NETosis biomarkers and deoxyribonuclease I (DNaseI) activity can serve as minimally invasive tools for diagnosis, risk stratification, and prognosis. We also assessed NETosis in tumor tissue and explored the potential restoration of impaired NET degradation using human recombinant DNaseI, aiming to identify translational applications for pediatric oncology.
Methods
1. Study design and population
This study included 182 pediatric cancer patients with various tumor types and 10 age-matched healthy controls. Eligible subjects were those with an ethylenediaminetetraacetic acid (EDTA) plasma sample stored in the Accredited Pediatric Oncology Sample Collection (LC2_2012) at the Biobank of La Fe University and Polytechnic Hospital (Valencia, Spain). Plasma samples were collected between March 2006 and February 2024, with clinical follow-up data available up to May 2025.
The reference standard for diagnosis was histopathological confirmation combined with tumor-specific clinical criteria. As this is the first study investigating NETosis in different types of pediatric cancer in humans, sample size calculation could not be performed a priori.
Exclusion criteria included active acute or chronic infection, recent blood transfusion, use of granulocyte colony-stimulating factor, or insufficient plasma available.
The study protocol was approved by the Clinical Research Ethics Committee of Hospital Universitario La Fe, Valencia, Spain (2022-487-1) and conducted in accordance with the Declaration of Helsinki, and its latest amendments. All biological specimens analyzed in this study were obtained from pediatric patients who had previously signed, through their legal guardians, a written informed consent form authorizing the donation and research use of clinical samples.
2. Clinical data and risk classification
Clinical data were extracted from electronic medical records and included diagnosis, clinical staging, sex assigned at birth, age at diagnosis and plasma collection, routine blood test results, treatment initiation data, and survival status. Clinical staging and risk classification were performed by adapting the Toronto Childhood Cancer Stage Guidelines [19,20] and tumor-specific guidelines [21,22] (Supplementary Table 1). Patients were stratified according to the timing of plasma collection: those whose plasma was obtained before initiating treatment (treatment-naive group), and those whose plasma was collected after treatment had started (during-treatment group). Sex assigned at birth was recorded in accordance with SAGER guidelines. Gender identity was not assessed. Race and ethnicity were not collected due to lack of routine recording. Routine blood test results included hematological and inflammatory parameters such as leukocyte counts (neutrophils, lymphocytes, and platelets), C-reactive protein (CRP), and lactate dehydrogenase (LDH) levels. Neutrophil-to-lymphocyte ratio (NLR) and platelet-to-lymphocyte ratio (PLR) were calculated according to established methods [23,24].
3. Quantification of NETosis biomarkers and active DNaseI in plasma
Different markers of NETosis were quantified in plasma as previously described: cell-free DNA (cfDNA, Quant-iT PicoGreen dsDNA kit, Life Technologies, USA), calprotectin (Human Calprotectin ELISA kit, Hycult Biotech, Netherlands), neutrophil elastase (PMN Elastase Human ELISA Kit, Abcam, UK) [25-28] and citrullinated histone 3 (citH3)-DNA complexes [27]. Plasma active DNaseI concentration was measured by the single radial enzyme diffusion assay as previously described [27,28].
4. Immunofluorescence staining of NETs in tissue specimens
NETs were immunofluorescently stained in 64 formalin-fixed paraffin-embedded tissue specimens of 6 tumor types (hepatoblastoma, osteosarcoma, Ewing sarcoma, other sarcoma, Wilms tumor and neuroblastoma) as previously described [28]. The position of tumor and paratumor tissue was guided by hematoxylin and eosin staining.
5. NET degradation assay and in vitro evaluation of DNaseI performance
NETs were generated by stimulating isolated neutrophils, obtained from a healthy individual, with phorbol 12-myristate 13-acetate (Sigma-Aldrich, USA) and incubated overnight at 4°C. To assess the ability of plasma to degrade NETs, these were exposed to 5% EDTA plasma from cancer patients or controls in the presence of PPACK (Santa Cruz Biotechnology, USA) for 6 hours. NET degradation was halted with paraformaldehyde (Sigma-Aldrich, USA), and DNA was fluorescently labeled with Sytox Green (Invitrogen, Life Technologies, USA) for quantification and imaging.
For therapeutic evaluation, NETs were incubated with plasma supplemented with recombinant human DNaseI (rhDNaseI) (Dornase alfa, Pulmozyme; Roche, Switzerland) at defined concentrations (Supplementary Material).
6. Statistical analysis
Continuous variables are presented as median and interquartile range (IQR). Categorical variables are presented as count and percentage. For unpaired comparisons of 2 groups, a nonparametric Mann-Whitney test was performed. For more than 2 unpaired groups, a nonparametric approach was used, and comparison was done with Kruskal-Wallis test. Correlation between NETosis biomarkers was assessed with a Spearman test. The diagnostic performance of NETosis-related biomarkers in pediatric cancer was assessed using the area under the receiver operating characteristic (ROC) curve (AUC). The diagnostic cutoff value of the variables was selected according to the ROC curve’s Youden’s index, and positive predictive value and negative predictive value were calculated. Survival analyses were performed using univariate Cox regression analysis and Kaplan- Meier (log-rank) test method with clinicopathological variables and dichotomized variable levels, taking as cutoff value the median level in patients. To assess the independent value of the tested biomarkers, a Cox proportional hazard model for multivariate analyses was used. All significant variables from the univariate were entered into the multivariate analyses in a forward stepwise Cox regression analysis. GraphPad Prism v.8.0.1 (GraphPad Software Inc., USA), IBM SPSS Statistics ver. 25.0 (IBM Co., USA), and R v.4.5.1 (R Foundation for Statistical Computing, Austria) were used to perform all analyses. Results were considered statistically significant at P<0.05.
Results
1. Participant characteristics
A total of 182 children with cancer and 10 pediatric controls were included in the study. The baseline characteristics of the study population are presented in Table 1. Similar cell counts were evidenced between patients and controls. Neither NLR nor PLR differed between these clinical groups (P>0.05).
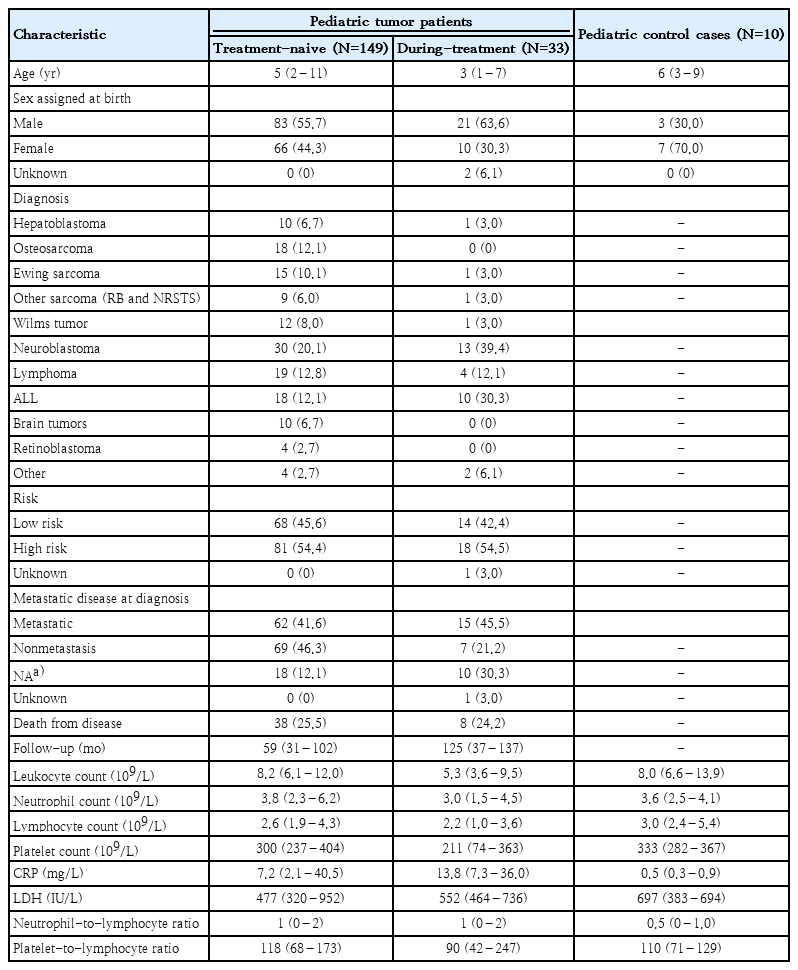
Clinical characteristics of the pediatric patients with tumor and healthy controls
2. Levels of NETosis biomarkers and active DNaseI in plasma of pediatric patients and controls
Treatment-naive patients were stratified according to risk classification (Supplementary Table 1). High-risk (HR) patients showed significantly elevated plasma levels of calprotectin (median, 2,126.41 ng/mL; IQR, 1,268.19–3,361.24 ng/mL) compared with both low-risk (LR) (1,043.38 ng/mL, 571.71–1,617.45 ng/mL, P<0.0001) and healthy controls (885.23 ng/mL, 554.42–1,141.03 ng/mL, P<0.01) (Fig. 1A). Plasma cfDNA levels were significantly elevated in both HR (1,826.25 ng/mL, 1,559.66–2,097.12 ng/mL) and LR patients (1,724.48 ng/mL, 1,541.61–1,928.42 ng/mL) compared with healthy controls (1,402.69 ng/mL, 1,319.43–1,510.84 ng/mL; P<0.0001 and P<0.01, respectively) (Fig. 1B). Additionally, HR patients had higher levels of neutrophil elastase (59.44 ng/mL, 37.36–91.31 ng/mL) than LR patients (45.72 ng/mL, 23.15–69.53 ng/mL, P<0.05) (Fig. 1C). No differences were observed in citH3-DNA complexes among any group (HR: 0.33 ng/mL, LR 0.37 ng/mL, controls: 0.31 ng/mL; P=0.74) (Fig. 1D). Regarding active DNaseI concentration, HR patients had lower (3.29 μU/μL, 1.66–5.35 μU/μL) than LR patients (5.12 μU/μL, 3.16–8.39 μU/μL, P<0.01) (Fig. 1E).
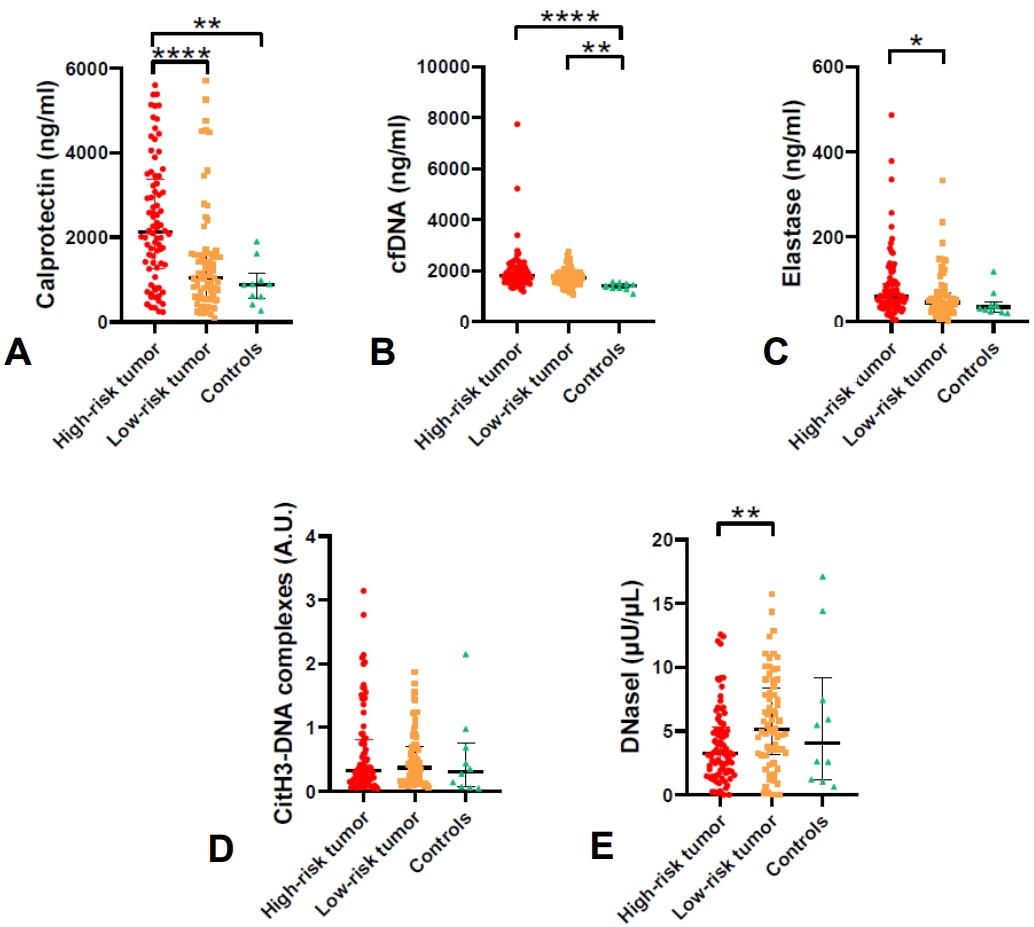
Plasma levels of NETosis biomarkers and deoxyribonuclease I (DNaseI) according to tumor risk in patients with treatment-naive plasma. (A) Calprotectin. (B) Cell-free DNA (cfDNA). (C) Neutrophil elastase. (D) Citrullinated histone 3 (CitH3)-DNA complexes. (E) DNaseI. *P<0.05. **P<0.01. ****P<0.0001.
When comparing hematological and solid tumors according to clinical risk, plasma levels of calprotectin, cfDNA, and neutrophil elastase were higher in patients with solid tumors, especially in the HR subgroup (Supplementary Fig. 1A–C). CitH3-DNA complexes and active DNaseI did not show any significant differences (Supplementary Fig. 1D and E). Lymphomas were excluded due to the complexity of their patterns and the difficulty in assigning them to a defined category.
To further examine this, plasma NETosis biomarker levels were compared across the different tumor types and control samples. Increased levels of calprotectin (hepatoblastoma and Ewing sarcoma), cfDNA (hepatoblastoma, Ewing sarcoma, Wilms tumor, neuroblastoma, lymphoma, and leukemia) and elastase (Wilms tumor) were observed compared to controls (P<0.05, Supplementary Fig. 2A–C), highlighting the importance of tumor-specific evaluations.
When stratifying each tumor type by clinical risk, cfDNA was significantly higher in HR than in LR groups in Wilms tumor and neuroblastoma (P<0.05, P<0.01, respectively) (Supplementary Fig. 3A and B). Additionally, calprotectin and active DNaseI also showed significant differences between HR and LR neuroblastoma cases (P<0.0001, P<0.01, respectively) (Supplementary Fig. 3C and D).
Correlations between NETosis biomarkers and other clinical and laboratory parameters are detailed in Supplementary Table 2. A significant correlation was found among the NET markers studied (P<0.05). Calprotectin showed positive correlations with other parameters such as CRP (r=0.508, P<0.0001), platelet count (r=0.429, P<0.0001), and LDH (r=0.254, P<0.01). Similarly, cfDNA and elastase correlated with CRP (r=0.310, P<0.05; r=0.297, P<0.05, respectively). We also analyzed the influence of patient age on neutrophil counts and NET biomarkers, but found no significant correlation (P>0.05). As cfDNA may increase due to other cancer-related mechanisms other than NETosis, we assessed the potential impact of prior therapy. Among the NETosis markers studied, only elastase levels differed in patients who had already received cytoreductive treatment (during treatment) (median, 36.27 ng/mL; IQR, 12.55–69.64 ng/mL) compared to treatment-naive patients (median, 50.77 ng/mL; IQR, 30.17–88.21 ng/mL; P<0.05) (Supplementary Fig. 4C).
3. Performance of NETosis biomarkers in plasma with diagnostic, stratification, and prognostic relevance in pediatric cancer
We assessed the ability of each NETosis biomarker to distinguish pediatric patients from control subjects. ROC curve analysis revealed that calprotectin and cfDNA exhibited a high diagnostic capacity: AUC=0.711 (95% confidence interval [CI], 0.596–0.826) and 0.876 (0.811–0.942), respectively (Fig. 2A). In HR patients, ROC curve analysis comparing them with controls showed improved diagnostic performance for calprotectin (AUC, 0.803; 95% CI, 0.703–0.902) and cfDNA (0.889; 0.816–0.962) (Fig. 2B).
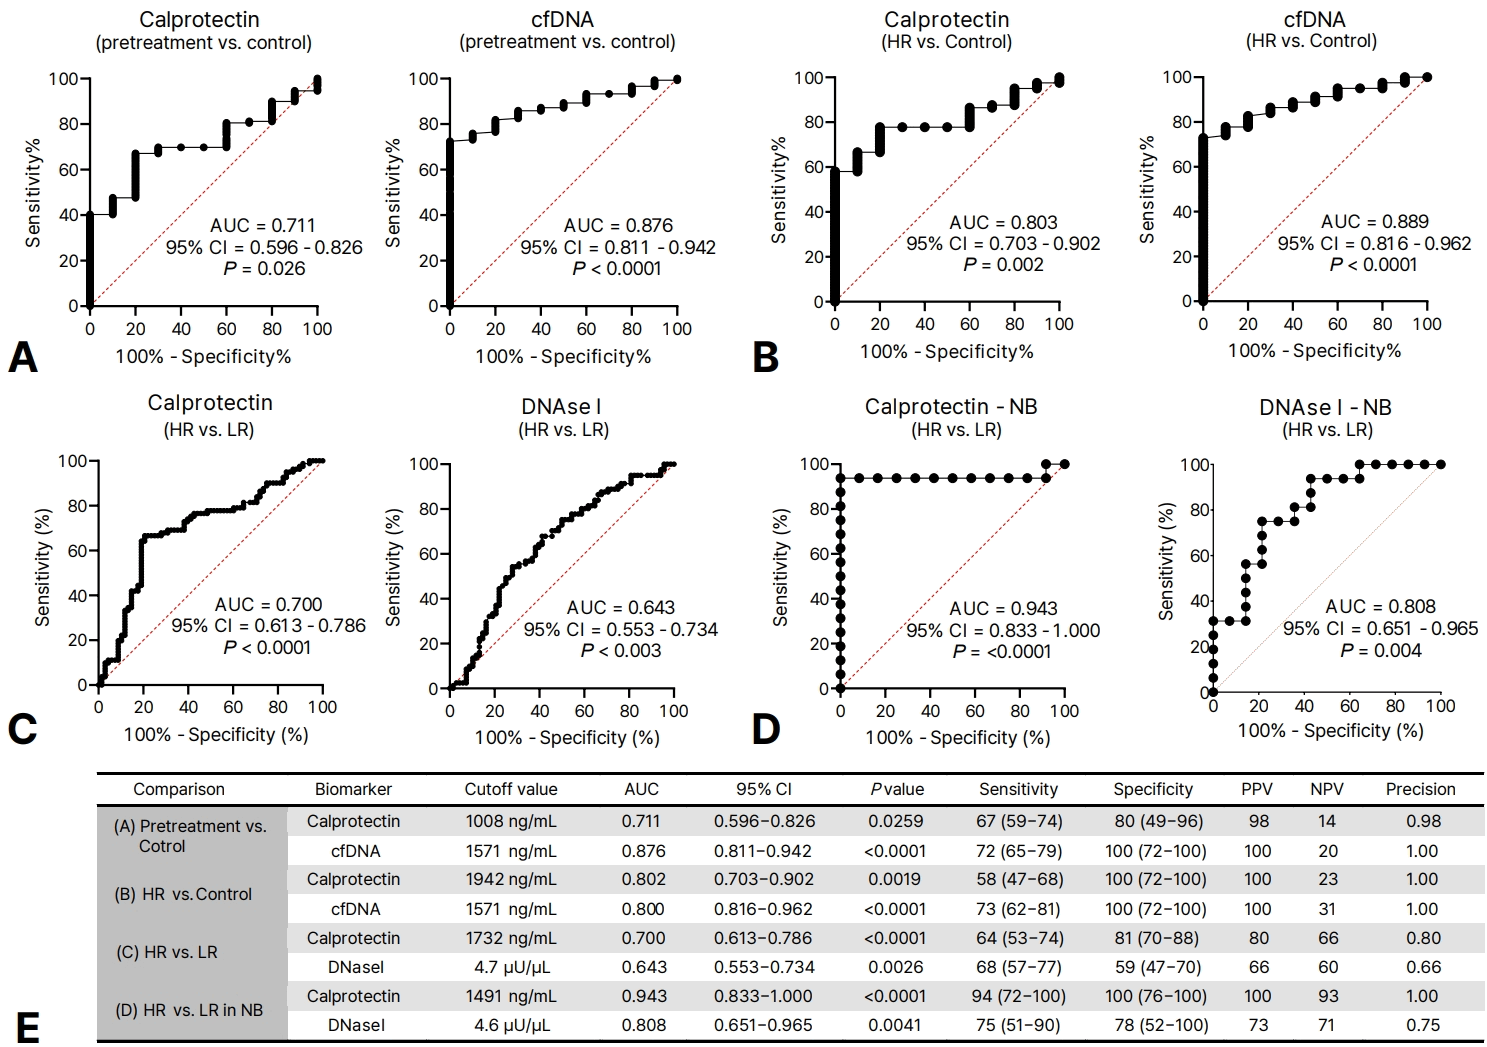
Receiver operating characteristic (ROC) curves of neutrophil extracellular traps (NETs) as biomarkers of pediatric cancer for diagnosis (A), stratification in all tumors (B), stratification in neuroblastoma (C), and their levels according to death-related disease (D), survival in all tumors (E), and survival in children with high-risk (HR) tumors. (A) ROC curves of calprotectin and cell-free DNA (cfDNA) in children with cancer versus controls. (B) ROC curves of calprotectin and cfDNA in children with HR tumors versus lowrisk (LR) tumors in all patients. (C) ROC curves of calprotectin and cfDNA in children with HR tumors versus low-risk (LR) tumors in neuroblastoma. (D) Calprotectin and deoxyribonuclease I (DNaseI) levels according to the death-related disease. (E) Diagnostic metrics for each biomarker derived from the ROC curve analysis of NET markers and DNaseI as biomarkers of pediatric cancer. The optimal cutoff values were determined using Youden’s index. Sensitivity and specificity are reported with 95% confidence intervals. AUC, area under the curve; CI, confidence interval; PPV, positive predictive value; NPV, negative predictive value.
Moreover, calprotectin and active DNaseI demonstrated significant value in risk stratification, showing discriminatory power between HR and LR cases: AUC=0.700 (95% CI, 0.613–0.786) and 0.643 (0.553–0.734), respectively (Fig. 2C). In neuroblastoma, these biomarkers showed the highest capacity for distinguishing between HR and LR groups: AUC=0.943 (0.833–1.000) and 0.808 (0.651–0.965), respectively (Fig. 2D and E).
In terms of absolute mortality, patients who died from the disease exhibited significantly increased calprotectin and decreased active DNaseI levels (P<0.01, P<0.05) (Fig. 3A).
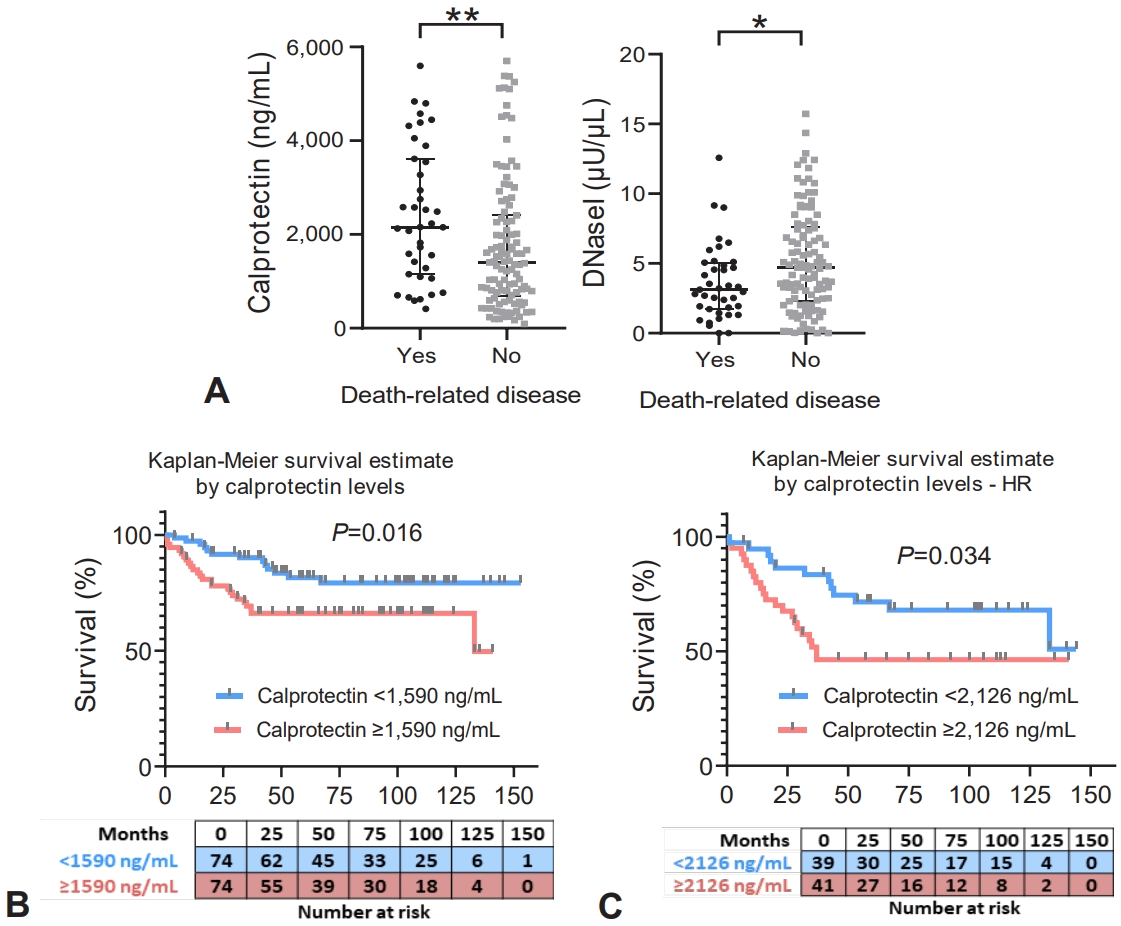
Association of plasma calprotectin and deoxyribonuclease I (DNaseI) levels with diseaserelated mortality and survival outcomes in pediatric cancer patients. (A) Plasma levels of calprotectin and DNaseI stratified by death-related disease status. (B) Kaplan-Meier analysis of survival according to calprotectin levels in all patients. (C) Kaplan-Meier analysis of survival according to calprotectin levels in HR group. *P<0.05. **P<0.01. AUC, area under the receiver operating characteristic curve; CI, confidence interval; HR, high-risk patient samples; LR, low-risk patient samples; PPV, positive predictive value; NPV, negative predictive value.
When NETosis biomarkers were analyzed in relation to survival, using the median values as cutoffs, Kaplan-Meier curves revealed that high calprotectin levels (≥1,590 ng/mL) were significantly linked to poorer overall survival (133 months vs. not reached, P=0.02) (Fig. 3B), suggesting a potential prognostic value. Multivariable analysis indicated that survival was related to risk classification. Focusing on the HR subgroup and again using the median values as cutoffs, higher (≥2,126 ng/mL) calprotectin levels were linked to worse prognosis (37 months vs. not reached, P=0.03) (Fig. 3C). These findings suggest that calprotectin may help identify a distinct subset of patients within the HR group who have particularly poor outcomes, potentially refining current risk stratification strategies.
4. Immunofluorescence staining of NETs in pediatric tumor tissue
We performed immunofluorescence staining of formalin-fixed, paraffin-embedded specimens from 64 cancer patients (29 HR and 35 LR) to confirm the occurrence of NETosis in the tumor microenvironment (TME). Most tissue samples (94%) were obtained at diagnosis, except for Wilms tumor, in which 60% of samples were from the initial biopsy and 40% from surgery, after receiving chemotherapy.
We observed the presence of NETosis in all tissues (Fig. 4A), as evidenced by the colocalization of DNA (Fig. 4B), neutrophil elastase (Fig. 4C), and citH3 in the tumor tissue (Fig. 4D). However, its presence was heterogeneous and not associated with risk classification or survival (P>0.05). Biopsies from HR neuroblastoma patients showed a nonsignificant trend toward higher levels of NETosis, followed by HR hepatoblastoma (P>0.05) (Fig. 4E).
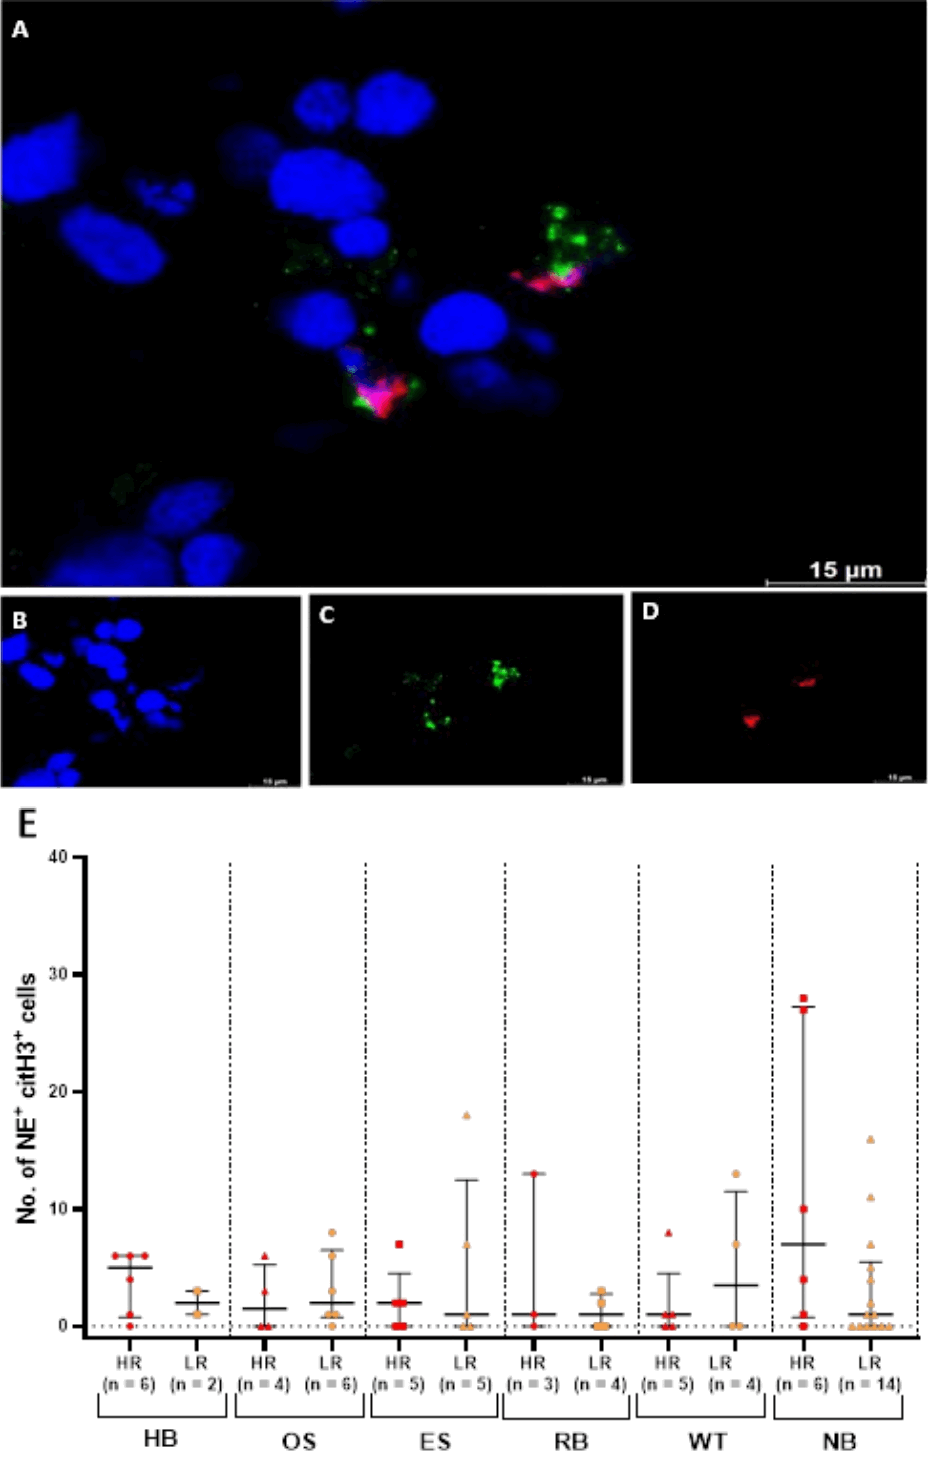
Immunofluorescence staining of neutrophil extracellular traps (NETs) in formalin-fixed, paraffin-embedded cancer tissue sections. (A) Colocalization of neutrophil elastase and citrullinated histone H3 (citH3) with DNA extracellular fibers in tumor tissue from a high-risk neuroblastoma patient. (B) DNA (Hoechst). (C) Elastase. (D) CitH3-DNA complexes. (E) Number of NETs formed in 10 fields in tumor tissue samples. Images obtained using a fluorescence microscope with a ×100 objective. ES, Ewing sarcoma; HB, hepatoblastoma; HR, high-risk tumor; LR, low-risk tumor; NB, neuroblastoma; OS, osteosarcoma; RB, rhabdomyosarcoma and nonrhabdomyosarcoma soft tissue sarcoma; WT, Wilms tumor
When comparing risk groups, no significant differences were found. There was a trend toward increased NETosis in tissue of HR hepatoblastoma, Ewing sarcoma, and neuroblastoma at diagnosis, compared with LR patients (Fig. 4E). In contrast, HR Wilms tumor biopsies showed a tendency for decreased NETosis compared to LR patients (P>0.05) (Fig. 4E).
5. Ability of plasma to degrade NETs and in vitro therapeutic performance of DNaseI
Isolated neutrophils were stimulated to form NETs in vitro (Fig. 5A) and incubated with plasma from a subset of 63 cancer patients (40 HR and 23 LR) and 10 controls to assess the ability of plasma to degrade NETs, as evaluated by fluorescence microscopy and by measuring DNA fluorescence. Incubation with plasma degraded elongated NETs (extracellular DNA fibers) but did not eliminate nuclear DNA dots. Interestingly, plasma from HR patients showed an impaired ability to degrade NETs compared with plasma from LR patients or controls (Fig. 5B, C, and E). Indeed, compared to NETs formed in vitro, the DNA fluorescence after the incubation with plasma from HR patients decreased to 83.57%, while it decreased to 77.44% with LR plasma and to 74.76% with control plasma (Fig. 5G).
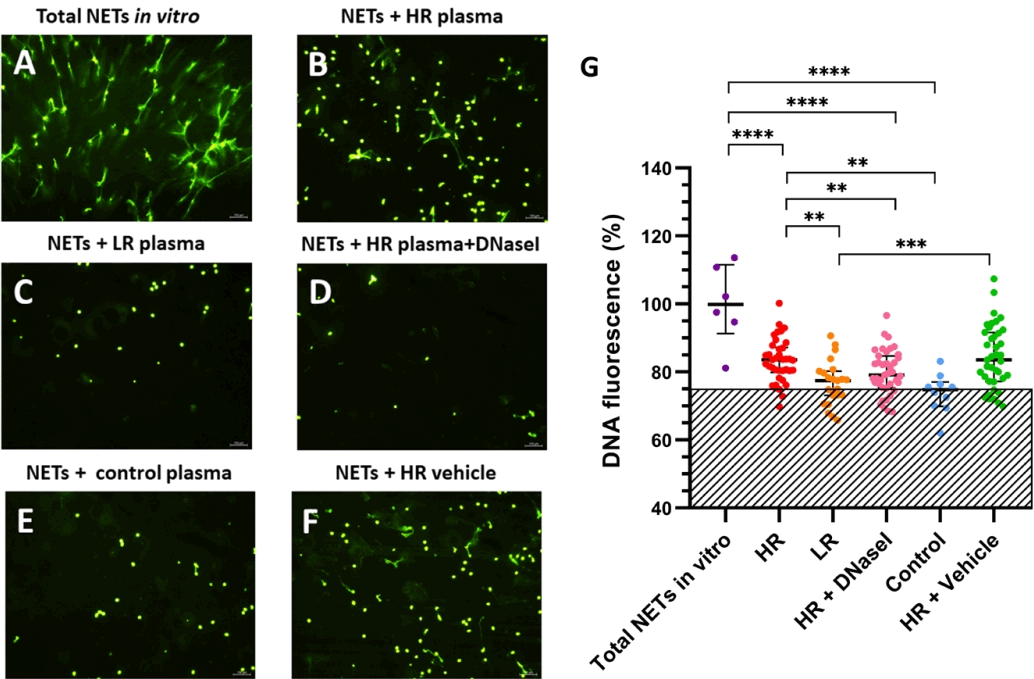
Neutrophil extracellular traps (NETs) degradation in vitro. (A) NETs generated in vitro. Remaining NETs after incubation with: (B) Plasma from a HR patient with cancer (neuroblastoma); (C) Plasma from an LR patient with cancer (neuroblastoma); (D) Plasma from a HR patient with cancer supplemented with rhDNaseI (Dornase alfa, Pulmozyme, Roche, Switzerland) in 1 × PBS + 0.1% BSA; (E) Plasma from a healthy control; (F) Plasma from a HR patient with cancer supplemented with vehicle (1 × PBS + 0.1% BSA) (neuroblastoma). Green fluorescence was obtained by the addition of Sytox Green, and images were obtained using an inverted fluorescence microscope with a 10 × objective. (G) DNA fluorescence after NET degradation in vitro. The shaded area depicts the median DNA fluorescence of the controls. % fluorescence was calculated in each well by considering 100% fluorescence that of total NETs generated in vitro. **P<0.01. ***P<0.001. ****P<0.0001. BSA, bovine serum albumin; HR, high-risk tumor; LR, low-risk tumor; PBS, phosphate-buffered saline; rhDNaseI, recombinant human deoxyribonuclease I.
Next, we evaluated the potential therapeutic restoration of the DNaseI deficiency observed in HR plasma using rhDNaseI. Remarkably, its supplementation restored the NET degradation capacity (Fig. 5D) to levels comparable to those of LR patients (Fig. 5G).
Supplementary Fig. 5 illustrates the individual variations observed in each sample upon DNaseI supplementation. The 2 patients who exhibited the most significant decreases in DNA fluorescence following rhDNaseI supplementation were both classified as HR neuroblastoma cases that subsequently died due to disease progression after multiple lines of therapy.
Discussion
In this study, we observed a significant increase in NETosis biomarkers in the plasma of pediatric patients compared with healthy controls, particularly calprotectin and cfDNA.
Differences in neutrophil counts could be the source of variation in plasma activation markers. However, no differences were observed between patients with cancer and controls. Although cfDNA showed strong diagnostic performance, it could have a different cellular origin other than neutrophils through NETosis. Nonetheless, a significant correlation was found between all NETosis-related markers studied, thus suggesting a common origin. An increase in cfDNA may reflect multiple biological processes including cell death through apoptosis or necrosis, or systemic inflammation. In our patients, tumor risk or treatment-related tissue injury did not contribute to cfDNA variation. Therefore, its interpretation should be made in the context of complementary NETosis-associated biomarkers rather than as an isolated marker.
Our findings align with reports in adult cancer patients, where increased NETosis biomarkers have been documented in metastatic colorectal cancer [13,29], ovarian cancer [27], bladder cancer [28], and acute leukemia [30], supporting the hypothesis that NETosis contributes to tumor progression and clinical outcomes. Evidence in pediatric oncology remains scarce [15]. Previous studies in acute leukemia [31] and small cohorts of solid tumors [15,16,18] have suggested similar trends, but lacked statistical power and generalizability. More recently, genomic analyses linking NET-related signatures to prognosis in neuroblastoma [17,32], Ewing sarcoma [33] and osteosarcoma [34] further reinforce the relevance of NETosis biology in pediatric cancer. Our results indicate that the dysregulation of systemic NETosis is detectable across a broad spectrum of pediatric tumors and risk groups. This difference may reflect unique biological features of childhood, including immune system development and maturation, which may influence neutrophil function, inflammatory signaling, and NETosis dynamics. Notably, as neutrophils constitute the most abundant circulating leukocyte population and represent the first line of innate immune defense, they likely play a central role in early-life inflammatory processes, including those potentially involved in tumor-host interactions.
We demonstrated that cfDNA achieved high diagnostic accuracy for distinguishing children with cancer from healthy controls (AUC up to 0.89), consistent with recent biomarker studies in pediatric oncology [35,36]. This suggests that cfDNA could serve as a triage biomarker to support early diagnostic suspicion, particularly in settings where invasive procedures are challenging. On the other hand, calprotectin and active DNaseI concentration stratified risk groups (AUC up to 0.94 in neuroblastoma), a finding not previously reported. A calprotectin threshold of ≥2,126 ng/mL was associated with poorer overall survival in HR patients, suggesting potential utility as an add-on biomarker to existing risk stratification frameworks (e.g., International Neuroblastoma Risk Group in neuroblastoma). However, this threshold was derived from our dataset rather than prespecified, introducing risk of optimism. Internal validation and external replication are essential before clinical implementation. Although no consensual single specific marker of NETosis has been revealed, calprotectin is clinically considered to be neutrophil-specific [37] and higher levels in plasma or feces are found in diseases associated with increased neutrophil activity and NETs [38]. Thus, the increase in plasma calprotectin may capture upstream inflammatory processes closely linked to NET formation.
Additionally, NETosis biomarker levels varied across tumor types, reflecting distinct biological mechanisms. This highlights the need for continued investigation to better understand tumor-specific mechanisms and improve clinical outcomes in pediatric oncology, focusing on hepatoblastoma, Ewing sarcoma, Wilms tumor, and neuroblastoma.
NETosis within the TME appeared heterogeneous and generally limited in our cohort, particularly when compared to plasma samples. Despite that, NETosis was slightly higher in the TME of aggressive tumor types, consistent with previous observations in adult bladder cancer [28] and pediatric sarcomas [16]. This observation is consistent with the inherent constraints of tissue-based assessment [39]. Tumor biopsies provide a spatially restricted and potentially nonrepresentative snapshot of a highly heterogeneous microenvironment, particularly in pediatric settings where sample size is often limited. Moreover, neutrophil infiltration and NETs formation are dynamic and spatially heterogeneous processes, likely generating complex and transient inflammatory patterns that are difficult to capture and quantify in routine pathological specimens.
In this context, the variability in tissue-based NETs detection among tumor types should not be interpreted as a lack of biological relevance, but rather as a reflection of tumor-specific mechanisms. Instead, our findings support the concept that NETosis in pediatric cancer may be more robustly reflected at the systemic level. Circulating NETosis-related biomarkers integrate signals from both tumor and host inflammatory responses, potentially providing a more comprehensive readout of NETosis activity than localized tissue sampling.
Our in vitro experiments demonstrated that recombinant DNaseI (dornase alfa) restored the ability of plasma from HR patients to degrade NETs, supporting biological plausibility for exploring future NET-driven therapeutic intervention. This observation aligns with findings in other diseases [28,40] and ongoing cancers trials in adults (e.g., NCT05203224, NCT07121322, NCT06723717, NCT0588 0524, NCT07361224). However, these results do not imply clinical efficacy and should be considered as proof-of-concept evidence supporting the biological plausibility of targeting impaired NET clearance. Translation to clinical practice will require early-phase pediatric trials with rigorous design, including biomarker-guided enrichment, prioritizing patients with confirmed DNaseI deficiency, prespecified endpoints, and safety monitoring. Such trials should clarify whether DNaseI supplementation can improve outcomes beyond standard therapy and quantify its net clinical benefit.
Strengths of our study include the large and clinically diverse pediatric cohort, which enables evaluation across multiple tumor contexts. We also highlight the comprehensive biomarker panel and the integration of diagnostic, prognostic and mechanistic analyses. In addition, we propose a novel therapeutic strategy to limit NETosis in HR pediatric tumors, offering broader insight into the involvement of NETosis in pediatric oncology. However, several limitations should be acknowledged. The relatively small number of healthy controls, inherent to pediatric studies due to ethical and logistical constraints, may limit the robustness of control-based comparisons. Another limitation is the absence of race and ethnicity data, which restricts generalizability. In addition, biological tumor heterogeneity complicates interpretation of biomarker performance. The long accrual period (2006–2024) may introduce batch effects despite standardized storage and assay protocols. Verification and incorporation biases were minimized by using independent reference standards, but blinding and handling of indeterminate results should be clarified in future work. Generalizability may be limited to similar tertiary care settings. Finally, multicenter validation and decision-curve analyses are needed to quantify net clinical benefit.
Future studies should aim to include these variables to improve applicability across sociocultural contexts. Additionally, given the emerging evidence of DNaseI deficiency contributing to impaired NET clearance, it is important to consider initiating pediatric clinical trials that evaluate DNaseI supplementation, especially in patients with confirmed deficiency. Such approaches could open new therapeutic avenues to mitigate NET-driven pathology in HR pediatric cancers.
In conclusion, our study, comprising the largest pediatric oncology cohort to date analyzing NETosis, demonstrates a dysregulation in the NETosis process, partially mediated by decreased DNaseI levels that impair NET degradation. It also identifies cfDNA as a potential triage biomarker and calprotectin as an add-on marker to refine risk stratification. Importantly, our data provide a strong rationale for exploring DNaseI supplementation as a therapeutic approach, particularly in HR patients. These findings require validation in independent multicenter cohorts and evaluation of clinical utility through reclassification and decision-curve analyses.
Supplementary materials
Supplementary Material, Supplementary Tables 1-2, and Supplementary Figs. 1-5 are available at https://doi.org/10.3345/cep.2026.01004.
Tumor types, guideline-based staging and adapted risk classification for pediatric oncology patients
Spearman correlation coefficient matrix of the NETs biomarkers, DNaseI and analytical parameters measured in plasma of pediatric tumor patients and controls
Levels of neutrophil extracellular traps markers and deoxyribonuclease I (DNaseI) in plasma of patients with hematological and solid tumors according to risk. (A) Calprotectin. (B) Cell-free DNA (cfDNA). (C) Neutrophil elastase. (D) Citrullinated histone 3 (CitH3)-DNA complexes. (E) DNaseI. Only significant comparisons within the same tumor type, between similar risk groups or with controls are depicted. HR, high-risk; LR, low-risk. *P<0.05, **P<0.01, ***P<0.001, ****P<0.0001.
Levels of NETosis biomarkers and deoxyribonuclease I (DNaseI) in plasma across different tumor types and controls. (A) Calprotectin. (B) Cell-free DNA (cfDNA). (C) Neutrophil elastase. (D) Citrullinated histone 3 (CitH3)-DNA complexes. (E) DNaseI. *P<0.05, **P<0.01, ***P<0.001, ****P<0.0001. ALL, acute lymphoblastic leukemia; BT, brain tumors; C, controls; ES, Ewing sarcoma; HB, hepatoblastoma; L, lymphoma; NB, neuroblastoma; OS, osteosarcoma; OT, other tumors; RB, rhabdomyosarcoma and nonrhabdomyosarcoma soft tissue sarcoma; RBM: retinoblastoma; WT, Wilms tumor.
Levels of neutrophil extracellular traps markers and deoxyribonuclease I (DNaseI) in plasma across different tumor types, stratified by clinical risk. Only significant differences are included. (A) Cell-free DNA (cfDNA) in Wilms tumor. (B) Calprotectin in neuroblastoma tumor. (C) Cell-free DNA (cfDNA) in neuroblastoma tumor. (D) DNaseI in neuroblastoma tumor. *P<0.05, **P<0.01, ****P<0.0001. HR, high risk; LR, low risk; NB, neuroblastoma; WT, Wilms tumor.
Levels of NETosis biomarkers and deoxyribonuclease I (DNaseI) in plasma of pediatric cancer patients before treatment, during treatment and controls. (A) Calprotectin. (B) Cell-free DNA (cfDNA). (C) Neutrophil elastase. (D) Citrullinated histone 3 (CitH3)-DNA complexes. (E) DNaseI. *P<0.05, ***P<0.001.
Restoration of neutrophil extracellular trap (NET) degradation ability of plasma HR patients after the supplementation with rhDNaseI (Dornase alfa, Pulmozyme, Roche, Germany). Changes in DNA fluorescence in NET degradation experiments in vitro after the incubation with plasma from a cohort of HR patients and with plasma from the same patients supplemented with rhDNaseI. ALL, acute lymphoblastic leukemia. HR, high risk; rhDNaseI, recombinant human deoxyribonuclease I.
Notes
Conflicts of interest
No potential conflict of interest relevant to this article was reported.
Funding
This research was supported by research grants from Instituto de Salud Carlos III (ISCIII) (FI21/00171, PI23/00449, FORT23/00021) co-funded by the European Union, Fundación SEHOP (TKNDV), Sociedad Española de Trombosis y Hemostasia (SETH), Asociación Española Contra el Cáncer (AECC- CLJUN223424BENA and 00320 0007) and the European Union through the AECC Talent Programme (GA101081298, TALEN246729HERR).
Author contribution
Conceptualization: NB, JO, BA, PM, AC; Data curation: NB, JO, PV, RH; Formal Analysis: NB, JO, PV, AHP, RH, PM; Funding acquisition: NB, AHP, SB, PM, AC; Methodology: NB, JO, PV, RH, PM; Project Administration: NB, JO, SB; Visualization: NB, JO, AHP, BA, JB, AJR, PM, and AC; Writing – Original Draft: NB, JP, PV, RH; Writing – Review & Editing: NB, JO, PV, AHP, RH, BA, JB, AJR, SB, PM, AC
Acknowledgments
The authors recognize the Microscopy, Cytomics and Cell Culture Units of IIS La Fe for their grateful collaboration and technical support. We would like to express our appreciation to David Climent Navarro (Department of Informatics, IES La Vereda, La Pobla de Vallbona, Valencia, Spain) for his assistance with the R programming language, which contributed to the preparation of one of the figures included in this article.