


Graphical abstract
Introduction
Infantile colic (IC) is a functional gastrointestinal disorder that affects one in 5 infants in the first 3 months of life, peaks at about 6 weeks of age, and resolves spontaneously before 6 months [1]. Although IC is a benign neonatal problem characterized by uncontrollable crying spells, it is an excruciating process for parents and infants [2,3].
IC has a multifactorial etiology; various treatments have been tested to manage and alleviate its symptoms [4]. Recent studies suggest that changes in the gut microbiota may contribute to the development of colic [2,3] since studies have reported lower microbial diversity and impaired microbial colonization (dysbiosis) in the intestinal microbiota of infants with IC [5,6].
Scientists speculate that dysbiosis may play a role in the pathogenesis of IC and that modulation of the gut microbiota, including probiotics, may work for its management [7,8]. Many studies have evaluated probiotic supplements in treating IC and have shown positive results in their effectiveness [9-11]. However, the effects and safety of probiotics vary according to the probiotic strain [7,8].
In studies, probiotic products were generally used in infant nutrition, and there are hardly any studies that add probiotics to maternal nutrition. Several existing studies have shown that probiotic products added to maternal nutrition positively affect colic [5,12]. The Bifidobacterium strain was added to the maternal diet in the infant probiotic category in these studies.
This study aims to evaluate the effect of probiotic products (containing the strain Actiregularis subsp. (5×10⁶ colony forming unit [CFU]mL) added for 15 days to the diet of mothers whose infants were diagnosed with IC on infants’ daily crying frequency, severity, and fecal bacterial microbiota content.
Methods
1. Study design
The study population consisted of cases diagnosed with IC in the pediatric polyclinic of a training and research hospital in Istanbul between 1 August 2020 and 1 June 2021. The present study is planned as a single-blind, randomized controlled clinical trial to evaluate the effect of a probiotic product containing Actiregularis subsp strain added to the diet of mothers of infants diagnosed with IC daily crying frequency, severity, and fecal bacterial microbiota content of infants. The study design was defined according to the international recognized guidelines for clinical studies (www.ClinicalTrials.gov, Identifier NCT 04374955).
2. Patients and methods
Eligible participants were mothers of all infants aged 0–6 months who applied to the pediatric outpatient clinic of Istanbul Haseki Sultangazi Hospital with the complaint of crying. Inclusion criteria of the cases in the study were: (1) being between 30–60 days of postnatal age, (2) vaginal delivery, (3) feeding the baby with breast milk more than 8–10 times a day (more than 50%), (4) the newborn was born at 37–42 weeks of gestation, (5) getting a score of 10 or less from the Beck Depression Inventory, and (6) diagnosing with colic (a week before the start of the study, the baby’s crying periods last more than 3 hours a day, at least 3 days in a week).
Exclusion criteria from the study were: (1) acute or chronic disease in the mother and infant, (2) gastrointestinal diseases and gastro-oesophageal reflux, (3) mother and infant used probiotics or antibiotics 1 week before or during randomization. Mothers were discluded from the study when they did not take the probiotic product twice in a row, started drug therapy for IC, stopped breastfeeding, or used formula.
A detailed physical examination and history were taken by a single pediatrician (DO) responsible for each infant who applied to the clinic with the complaint of crying. First of all, conditions such as food allergy and lactose intolerance were excluded in infants. Parents of infants diagnosed with IC by the physician and meeting the inclusion criteria were given a 7-day questionnaire. They evaluated the infants’ crying times, sleep, wakefulness, or feeding. Seven days later, an appointment was made for the diagnosis, and the infants and their mothers who met the colic criteria (150 mothers and infants) were sent to the researcher (AYK).
All mothers included in the study filled in the “Data Collection Form-A, B, C, D” (on day 0), and stool samples were taken from their infants. Stool samples were collected from diapers into sterile plastic tubes and stored at -80°C until analysis. Stool samples were collected into 2 separate falcon tubes with the help of a spoon and at least one spoonful (250 mg) in each tube (total 500 mg). A “Baby Diary Form” was given to the mothers, and they were asked to record the crying intensity (out of 10) and frequency (increased, decreased, unchanged) of the baby from day 0 to day 15 and bring the form when coming to the control on the 15th day.
The mothers in the experimental group were asked to use the standard policy of the institution and the prebiotic product given by the researcher (AYK) for 15 consecutive days from day 0 to manage IC symptoms. While using probiotic products, mothers were warned not to take other commercial products containing probiotics and a treatment method during the research period, and no special dietary restrictions were recommended [5,12]. Fifteen follow-ups were carried out with the mothers during the study period (for daily probiotic use and filling out the daily baby cry form). Follow-up was in the form of daily phone calls of the researcher to the mothers. Probiotic products were given to the mothers in a box of 15 products—the empty boxes were asked to be delivered to the researcher on the 15th day.
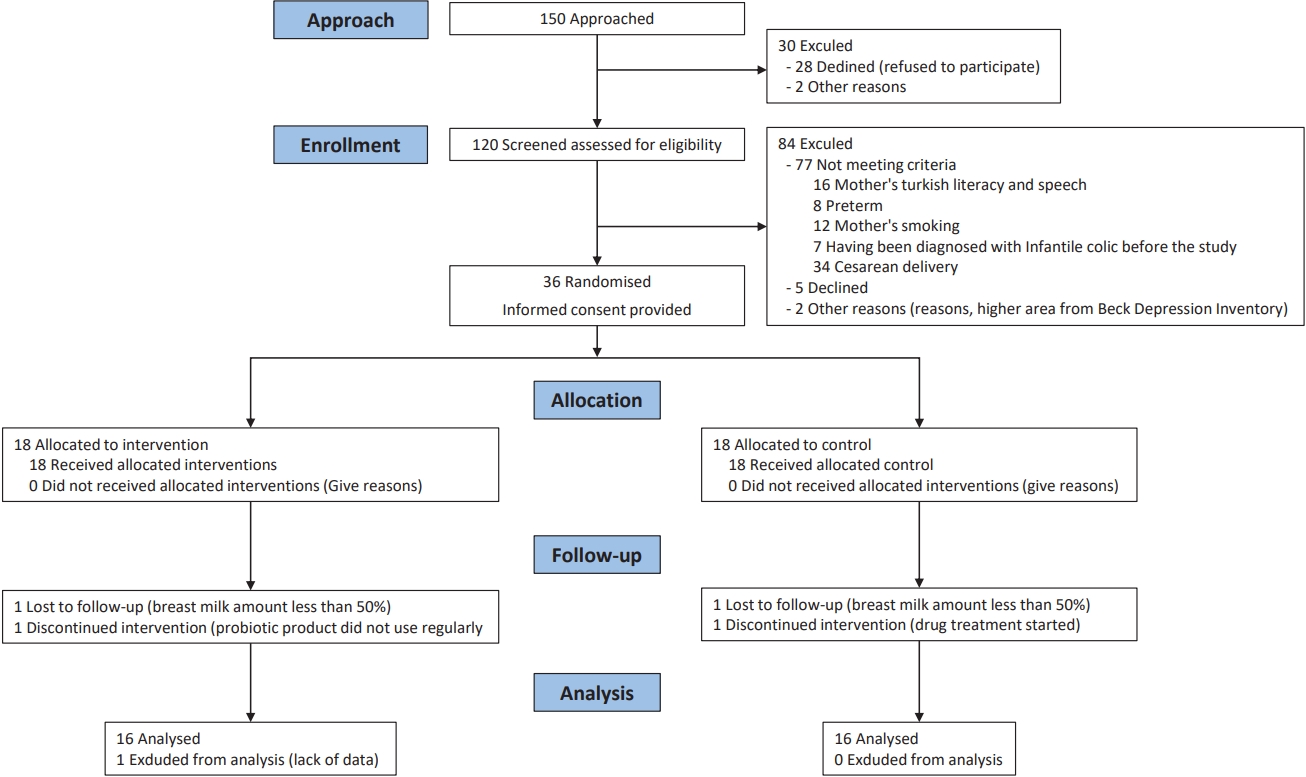
The institution’s standard policy for IC symptoms was offered to mothers in the control group. They were warned not to take any treatment method, and an appointment was made for all mothers 15 days later. The “Baby Diary Form,” which they filled out for 15 days, was collected from all mothers who came for the control on the fifteenth day. Afterward, 2nd stool samples were taken from all infants (Fig. 1).
The probiotic product used in the current study, containing the Actiregularis (5×10⁶ CFUmL) strain, is sold in the markets, and no sponsorship was received from the company for the supply of the product.
Ethics Committee (No:2020-85) approval was obtained from the Clinical Research Ethics Committee (10.06.2020) for the ethical suitability of the study. Further, written consent was obtained from the institution where the study was conducted and the mothers participating.
3. Randomization and blinding
All mothers included in the study were randomized into 2 groups as experimental and control. The website (www.randomizer.org) was used for randomization. The lottery result was named experimental group A and control group B, and the randomization codes and all data were kept confidential until they were analyzed. All participants and the statisticians evaluating the research results were blinded to the group assignment—the researcher (AYK) did not participate in any statistical analysis step to avoid bias.
4. Statistical analysis
Primary outcome measures were reduction in crying duration and intensity in colic and rate of species diversity in microbial colonization. The success rate was defined by ≥50% reduction in mean daily crying time (intensity less than 5 out of 10) expressed in duration and severity and increased bacterial species diversity. 16 S NovaSeq Scanning Panel and Illumina NovaSeq 6000 Device were used for microbiota analysis of stool samples. Stool samples, DNA extraction, polymerase chain reaction amplification, and sequencing were evaluated by bioinformatics analyses.
The data obtained in the study were analyzed using IBM SPSS Statistics ver. 25.0 (IBM Co., Armonk, NY, USA). Normally distributed quantitative variables were compared using the Independent t test. The Mann-Whitney U test was used for the not normally distributed variables. The analysis of variance was used in repeated measurements when it had a normal distribution. The Friedman test was used when it did not have a normal distribution. Bonferroni was used to find the time that made a difference when there was a difference, and the ratios were compared using the chi-square test or the fisher exact test, as appropriate. A P value of <0.05 was considered significant for all tests.
The sample size was calculated by power analysis, and a 50% reduction in the daily crying time of the infants in the intervention group was considered sufficient in its calculation. The analysis was performed using SAS 9.3 (SAS Institute Inc., Cary, NC, USA). According to this calculation, it was sufficient to include 30 mothers and babies, 15 mothers and babies in each group, with a 95% confidence interval, alpha 0.05, and 80% power. However, considering the case losses, the sample size would be 36 mothers and babies, 18 in both groups. After the data collection process, 5 mothers were excluded from the sample for various reasons (Fig. 1); thus, the study was completed with 31 mothers.
Results
The study excluded 114 of the 150 mothers and infants diagnosed with IC, and referred them to the investigator. Of those excluded, 84 were excluded because they did not meet the criteria, 28 refused to participate, and both received high scores on the Beck Depression Inventory. Thirty-six mothers and infants were included in the study and were randomized as control (n=18) and experimental (n=18). The study was completed with 31 infants (16 in the control group and 15 in the experimental group) as 5 infants failed after a 15-day follow-up (Fig. 1).
Sociodemographic and obstetric characteristics of the mothers and babies in the experimental and control groups are given in Supplementary Table 1. There was no significant difference between the sociodemographic data of the 2 groups in the parameters such as the mother’s age, the weight gained during pregnancy, smoking and the sex of the baby, birth weight, postnatal age, and diet.
The decrease in mean crying frequency was similar for the 2 groups at baseline. There was a statistically significant decrease in the crying frequency of infants in the group where mothers used probiotics compared to the control group on the seventh day, and the degree of significance of this decrease continued to increase on the 15th day (Table 1).
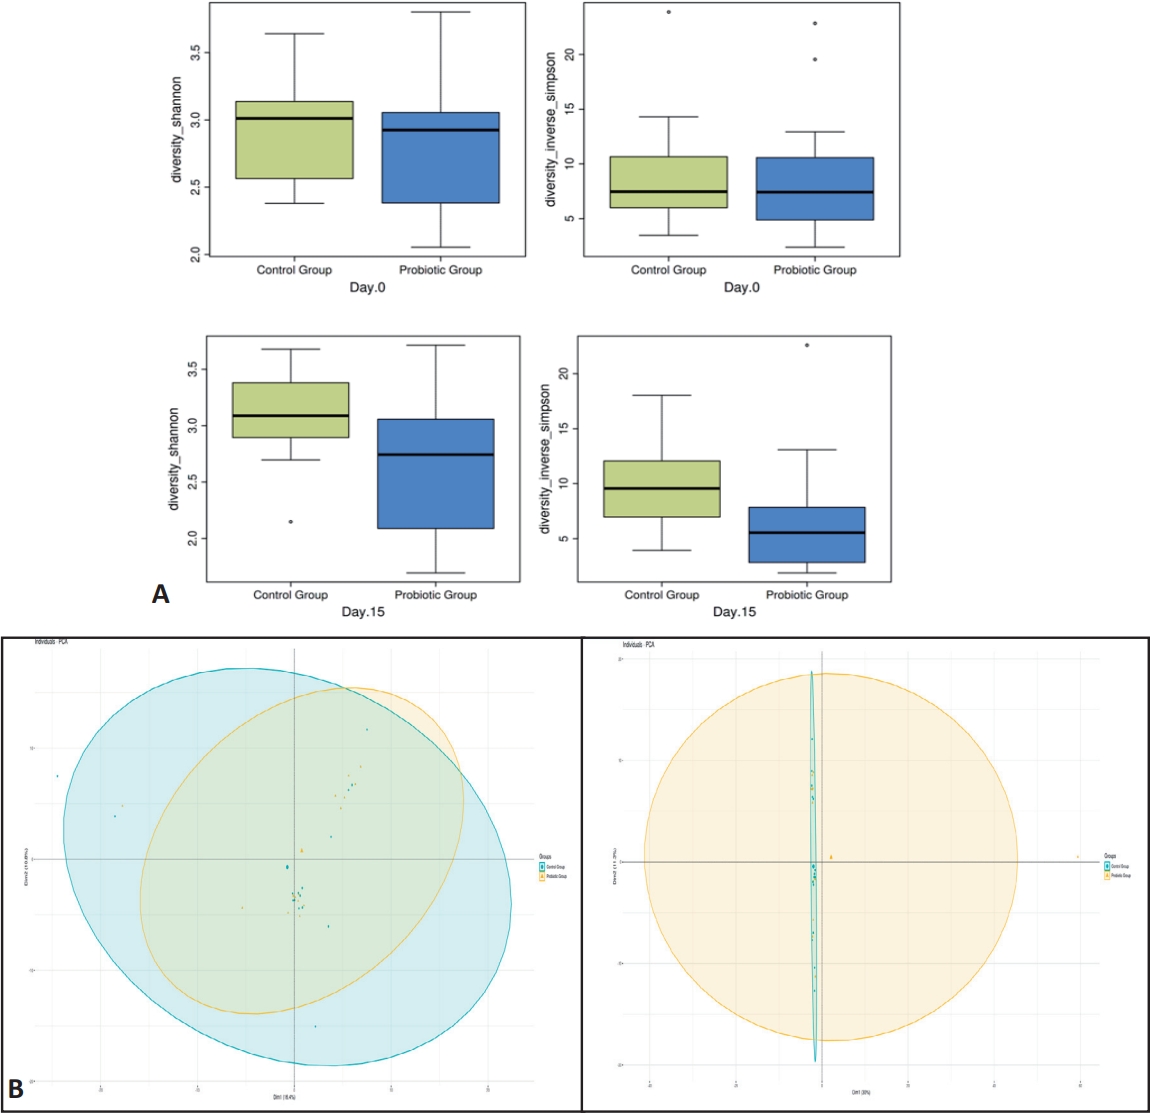
Sequencing (sequencing) of PCR amplified 16S rRNA genes from 31 stool samples from infants yielded sequencing results at an average read depth of 170,000. Each sample had at least 11,647 readings. The bacterial species diversity (alpha and beta) profile of the microbes on the 0th and 15th days of the stool samples of the experimental and control group infants participating in the study are given in Fig. 2.
The species diversity (alpha) of bacteria found in stool samples between the experimental and control groups did not differ significantly at day 0 (Shannon, P=0,30; Simpson, P=0,63). There was a significant difference in species diversity on the 15th day (Fig. 2A). In all indices evaluating diversity between groups, especially Shannon and Simpson diversity indices, on day 15, the experimental group was significantly different from the control group. The greatest diversity based on species was seen in the experimental group, while the lowest diversity was found in the control group (Shannon, P=0.0043; Simpson, P=0.0017) (Fig. 2B). In the present study, the difference between the experimental and control groups (on the 0th and 15th days) and the difference between the groups were evaluated, and a significant difference was found in terms of alpha diversity (P=0.017). Unweighted UniFrac distance was used to assess beta variation among stool samples. Differences between groups were evaluated using a nonparametric analysis of molecular variance. In the examination of the results, it was observed that the stool microbiota (yellow dotted area) of infants with probiotics on day 0 is similar to the composition of control infants (blue dotted) (Fig. 2B) yet significantly different in comparison at day 15 (P=0.022, r2=0.027) (Fig. 2B).
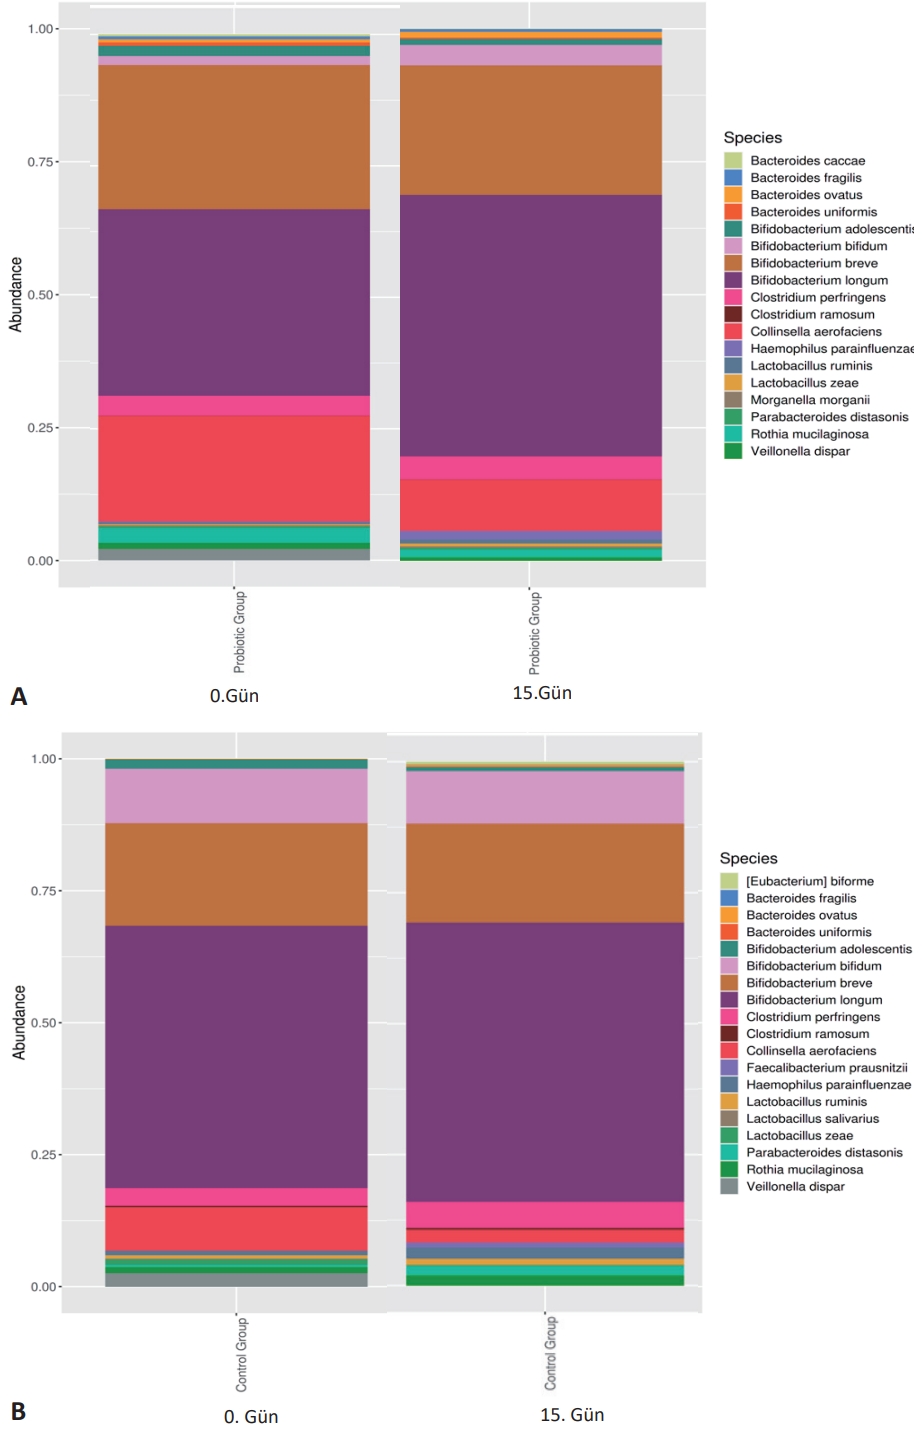
In the study, the microbiota profile of the 0 and 15-day stool samples of experimental and control group infants is shown in Fig. 3A and B.
The study examined 99.99% of the most abundant operational taxonomic units, which reduced the stool samples of babies in the experimental and control groups to 4 different classes (Actinobacteria, Bacteroidetes, Firmicutes, and Proteobacteria). When stool samples of infants in the experimental group were compared with the control group, the most common bacterial class was Actinobacteria (P=0.039). A statistically insignificant decrease (P=0.84) (Fig. 3B) in Proteobacteria characterized it. The variation of class abundances between the groups did not show much significance at the end of the 15th day. It was observed that the density of Actinobacteria class bacteria in the experimental group was higher than the control group (P=0,039), and there was a statistically insignificant decrease (P=0,84) in Proteobacteria. The study determined that the microbiota profiles of both the experimental and control groups were different from each other within the group. There was no statistically significant difference in microbial diversity due to the DNA analysis in which the difference between the groups was evaluated (P>0.05).
Discussion
In the current study, it was observed that the Actiregularis subsp. (5×10⁶ CFUmL) strain added to the mother’s diet decreased significantly in the crying intensity of the babies in the experimental group compared to the babies in the control group (Table 1). The different findings in the literature can be explained by the fact that the microbiota is affected by many factors, and the probiotic strains used are different. It may be recommended to conduct studies with larger samples and probiotic strains with more homogeneous groups.
In recent years, scientists have thought that dysbiosis may play a role in the pathogenesis of IC [13-16]. The use of probiotics for its management will prevent dysbiosis in the gut microbiota [17]. In particular, probiotic strains such as Lactobacillus and Bifidobacterium have been shown to positively affect the composition of the intestinal microbiota and the immune system’s function, reduce crying times, and provide microbial change [18,19]. In a study by Baldassarre et al. [5] it was shown that oral probiotic supplementation to mothers during the perinatal period might also have positive results on inconsolable crying in the first month of life and the mother’s feeling of inadequacy. However, there was no significant difference in neonatal gut microbiota composition between the placebo and experimental groups. In a randomized controlled study where Roos et al. [20] evaluated stool samples of infants with colic, it was found that the Lactobacillus reuteri DSM17938 strain added to the experimental group reduced colic symptoms compared to placebo, and the decrease was associated with an increase in Bacteroidetes.
In the present study, the species diversity of bacteria in stool samples between the experimental and control groups did not differ between the groups on day 0. Still, it increased significantly on day 15 (Fig. 2A). As a result of the DNA analysis in which the difference between the groups was evaluated, there was a significant difference in alpha diversity (P=0.017). The study data are similar to studies in the literature.
Studies report that microbial colonization varies depending on the type and amount of probiotic product, and the density of bacterial species increases [21,22]. In the study of Baldassarre et al. [23] which included 4 different Lactobacillus strains added to infant nutrition, no difference was found between the groups in total bacterial diversity and density of stool samples taken from infants. In the current study, it was observed that the beta diversity of the groups differed and was well affected by the probiotic species (P=0.037) (Fig. 3A). The control group (Fig. 2B) showed a constant spread in the existing bacterial species; the probiotic group (Fig. 2B) spread by increasing the species density between the groups.
Increasing evidence suggests that the gut microbiota may be related to colic. Studies in recent years have found higher amounts of Coliform bacteria and lower quantities of Lactobacillus in the microbiota contents of infants with colic [24,25]. Bifidobacterium and Lactobacillus, which are found in low amounts in the intestinal microbiota of babies with colic, increased after probiotic supplementation [26,27]. A study found that the total bacteria and Lactobacillus spp levels of stool samples increased after the probiotic product was added to the diet of infants with colic [28].
The current study has pointed out that the amounts of Lactobacilli and bifidobacteria in the probiotic group, species diversity, and fecal molecular profile differed in the probiotic intervention. Bifidobacterium longum and Bifidobacterium bifidum increased especially in the probiotic group compared to the control group. The study data are similar to the literature, supporting the hypothesis that probiotics have an effect on the gut microbiota and may play an important role in gut bacterial composition.
The limitations of this study are that only infants with IC who applied to a hospital were included in the study, the use of an infant crying diary whose validity and reliability were not verified. Thus, the parents’ statements about the recorded crying frequency and severity were correct. Yet to minimize recall bias, mothers were asked to fill in this information every hour of the day. The exclusion of formula-fed infants from the study is another limitation. All these points limit the generalizability of this study.
The study’s strengths are that it is the first study to assess the effect of probiotics given to mothers of infants with IC on infant microbiota. Further, the analysis of 16 Sr RNA and the evaluation of stool samples of infants in terms of bacterial species diversity in the pre-and postprobiotic period by solid analysis are also the study’s strengths.
The present study has included Actiregularis subsp. strain (daily supplementation) positively affected the symptoms of IC, decreased crying frequency and severity, and significantly increased bacterial community composition and diversity compared to the control group. Since a specific probiotic strain was used in this study, these findings cannot be generalized to other probiotic strains. A larger sample and double-blind placebo-controlled studies are needed to confirm that this specific strain of probiotic can be used to treat IC.

 PDF Links
 PubReader
 ePub Link
 PubMed
 Download Citation


