Article Contents
| Clin Exp Pediatr > Volume 62(8); 2019 |
|
Abstract
Purpose
Methods
Results
Acknowledgments
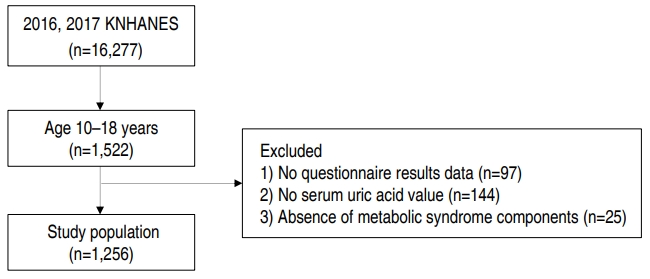
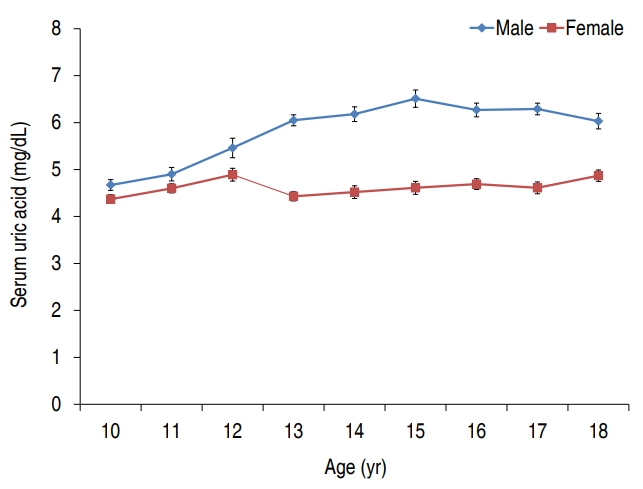
Fig. 1.

Table 1.
| Variable | Total (n=1,256) | Hyperuricemia (n=115) | No hyperuricemia (n=1,141) | P value |
|---|---|---|---|---|
| Serum uric acid (mg/dL) | ||||
| Male | 5.9±0.1 | 8.3±0.1 | 5.7±0.1 | <0.001 |
| Female | 4.6±0.1 | 6.3±0.1 | 4.4±0.0 | <0.001 |
| Overall | 5.3±0.1 | 7.3±0.1 | 5.1±0.1 | <0.001 |
| Prevalence | 0.281a) | |||
| Male | 655 | 55 (8.4) | 600 | |
| Female | 601 | 60 (10.5) | 541 | |
| Overall | 1,256 | 115 (9.4) | 1,141 |
Table 2.
Values are presented as weighted mean±standard error or number of cases (weighted percent).
WC, waist circumference; BMI, body mass index; SBP, systolic blood pressure; DBP, diastolic blood pressure; TC, total cholesterol; TG, triglycerides; HDL-C, high-density lipoprotein cholesterol; LDL-C, low-density lipoprotein cholesterol; FPG, fasting plasma glucose.
Boldface indicates a statistically significant difference with P<0.05.
Table 3.
| Variablea) | Total (n=1,256) | Hyperuricemia (n=115) | No hyperuricemia (n=1,141) | P value |
|---|---|---|---|---|
| BMI status | ||||
| Normal | 988 (78.9) | 59 (55.0) | 929 (81.3) | <0.001 |
| Overweight | 128 (9.5) | 20 (17.3) | 108 (8.7) | |
| Obesity | 140 (11.6) | 36 (27.7) | 104 (10.0) | |
| Metabolic syndrome | 30 (2.5) | 7 (6.3) | 23 (2.1) | 0.034 |
| Metabolic components | ||||
| Abdominal obesity | 143 (11.5) | 38 (30.4) | 105 (9.5) | <0.001 |
| High TG | 106 (8.1) | 16 (14.4) | 90 (7.4) | 0.030 |
| Low HDL-C | 190 (15.5) | 31 (28.5) | 159 (14.2) | 0.001 |
| High BP | 46 (3.8) | 9 (6.1) | 37 (3.5) | 0.178 |
| High SBP | 34 (2.5) | 9 (6.1) | 25 (2.2) | 0.022 |
| High DBP | 16 (1.6) | 1 (0.7) | 15 (1.6) | 0.358 |
| Impaired FPG | 154 (11.8) | 10 (9.7) | 144 (12.0) | 0.496 |
Values are presented as number of cases (weighted percent).
BMI, body mass index; TG, triglycerides; HDL-C, high-density lipoprotein cholesterol; BP, blood pressure; SBP, systolic blood pressure; DBP, diastolic blood pressure; FPG, fasting plasma glucose; WC, waist circumference.
Boldface indicates a statistically significant difference with P<0.05.
a) BMI status was defined by sex- and age-specific percentiles: normal (BMI< 85th percentile), overweight (85th percentile≤BMI<95th percentile), and obesity (BMI≥95th percentile). Abdominal obesity (WC≥90th percentile in those aged 10–15 years, ≥90 cm in males and ≥80 cm in females aged 16–18 years), high TG (≥150 mg/dL), low HDL-C (<40 mg/dL in males aged 10–18 years and females aged 10–15 years, and <50 mg/dL in females aged 16–18 years), high BP (SBP≥130 mmHg or DBP≥85 mmHg), and impaired FPG (≥100 mg/dL). WC≥90th percentile for age and sex was estimated using reference data from the 2007 Korean National Growth Charts.
Table 4.
| Variablea) |
Univariate |
P value |
Multivariate model 1b), 2c) |
P value |
Multivariate model 3d) |
P value | |||
|---|---|---|---|---|---|---|---|---|---|
| OR | 95% CI | OR | 95% CI | OR | 95% CI | ||||
| Age | 1.13 | 1.05–1.23 | 0.002 | 0.95 | 0.82–1.09 | 0.448 | 0.95 | 0.81–1.10 | 0.478 |
| Female sex | 1.29 | 0.81–2.04 | 0.281 | 1.31 | 0.83–2.08 | 0.244 | 1.31 | 0.82–2.11 | 0.261 |
| Residential regions (rural) | 1.15 | 0.61–2.19 | 0.659 | 1.22 | 0.63–2.39 | 0.555 | 1.17 | 0.57–2.42 | 0.669 |
| Household income | |||||||||
| Low | ref | ref | ref | ||||||
| Middle-low | 0.82 | 0.38–1.78 | 0.615 | 0.95 | 0.41–2.20 | 0.907 | 0.88 | 0.37–2.08 | 0.771 |
| Middle-high | 0.85 | 0.42–1.75 | 0.663 | 0.88 | 0.40–1.94 | 0.741 | 0.95 | 0.41–2.19 | 0.902 |
| High | 0.81 | 0.40–1.63 | 0.548 | 0.95 | 0.43–2.08 | 0.894 | 0.92 | 0.41–2.06 | 0.842 |
| Smoking status | |||||||||
| None | ref | ref | ref | ||||||
| Passive | 1.08 | 0.67–1.75 | 0.747 | 0.84 | 0.48–1.44 | 0.516 | 0.83 | 0.47–1.46 | 0.520 |
| Current | 0.88 | 0.32–2.48 | 0.814 | 0.49 | 0.15–1.64 | 0.247 | 0.53 | 0.16–1.82 | 0.315 |
| Drinking status | |||||||||
| None | ref | ref | ref | ||||||
| Drinker | 1.55 | 0.74–3.24 | 0.247 | 1.55 | 0.67–3.61 | 0.308 | 1.66 | 0.68–4.06 | 0.266 |
| Sitting time (hr/day) | 1.00 | 0.90–1.11 | 0.997 | 1.01 | 0.91–1.11 | 0.899 | 1.01 | 0.91–1.11 | 0.890 |
| BMI z scores | 1.65 | 1.42–1.90 | <0.001 | 1.59 | 1.34–1.89 | <0.001 | |||
| BMI status | |||||||||
| Nonobesity | ref | ref | ref | ||||||
| Obesity | 3.47 | 2.12–5.69 | <0.001 | 1.17 | 0.59–2.36 | 0.650 | |||
| Metabolic syndromeb) | 3.16 | 1.21–8.26 | 0.019 | 3.05 | 1.17–7.92 | 0.022 | |||
| Metabolic components | |||||||||
| Abdominal obesity | 4.14 | 2.58–6.67 | <0.001 | 3.38 | 1.72–6.63 | <0.001 | |||
| High TG | 2.09 | 1.12–3.90 | 0.021 | 1.61 | 0.83–3.14 | 0.159 | 1.63 | 0.84–3.18 | 0.152 |
| Low HDL-C | 2.41 | 1.46–3.98 | 0.001 | 1.42 | 0.80–2.52 | 0.234 | 1.23 | 0.66–2.30 | 0.515 |
| High BP | 1.76 | 0.81–3.84 | 0.153 | 1.04 | 0.39–2.77 | 0.935 | 1.00 | 0.36–2.76 | 0.997 |
| Impaired FPG | 0.78 | 0.38–1.61 | 0.507 | 0.61 | 0.25–1.51 | 0.287 | 0.60 | 0.25–1.44 | 0.249 |
OR, odds ratio; CI, confidence interval; BMI, body mass index; TG, triglycerides; HDL-C, high-density lipoprotein cholesterol; BP, blood pressure; FPG, fasting plasma glucose; WC, waist circumference.
Boldface indicates a statistically significant difference with P<0.05.
a) Obesity (≥95th percentiles, sex- and age-specific), abdominal obesity (WC≥ 90th percentile in those aged 10–15 years, ≥90 cm in males and ≥80 cm in females aged 16–18 years), high TG (≥150 mg/dL), low HDL-C (<40 mg/dL in males aged 10–18 years and females aged 10–15 years, and <50 mg/dL in females aged 16–18 years), high BP (systolic BP≥130 mmHg; diastolic BP≥85 mmHg), and impaired FPG (≥100 mg/dL). WC≥90th percentile for age and sex was estimated using reference data from the 2007 Korean National Growth Charts.
b) Adjusted for age, sex, residential regions, household income, smoking status, drinking status, and sitting time. Only the results of metabolic syndrome are shown.


 PDF Links
 PubReader
 ePub Link
 PubMed
 Download Citation


