Article Contents
| Korean J Pediatr > Volume 61(5); 2018 |
|
Abstract
Growth charts are curves or tables that facilitate the visualization of anthropometric parameters, and are widely used as an important indicator when evaluating the growth status of children and adolescents. The latest version of the Korean National Growth Charts released in 2007 has raised concerns regarding the inclusion of data from both breastfed and formula-fed infants, higher body mass index (BMI) values in boys, and smaller 3rd percentile values in height-for-age charts. Thus, new growth charts have been developed to improve the previous version. The 2006 World Health Organization Child Growth Standards, regarded as the standard for breastfed infants and children, were introduced for children aged 0–35 months. For children and adolescents aged 3–18 years, these new growth charts include height-for-age, weight-for-age, BMI-for-age, weight-for-height, and head circumference-for-age charts, and were developed using data obtained in 1997 and 2005. Data sets and exclusion criteria were applied differently for the development of the different growth charts. BMI-for-age charts were adjusted to decrease the 95th percentile values of BMI. Criteria for obesity were simplified and defined as a BMI of ≥95th percentile for age and sex. The 3rd percentile values for height-for-age charts were also increased. Additional percentile lines (1st and 99th) and growth charts with standard deviation lines were introduced. 2017 Korean National Growth Charts are recommended for the evaluation of body size and growth of Korean children and adolescents for use in clinics and the public health sector in Korea.
Growth charts are curves or tables that allow the visualization of anthropometric parameters and are widely used to evaluate growth and health status of children and adolescents.1,2) They play an essential role in the detection and evaluation of abnormalities in growth and development.3,4) Several countries have developed and used their own growth charts.5,6,7,8,9) Growth charts in Korea were produced and released in collaboration with the Ministry of Health and Welfare and the Korean Pediatric Society in 1967, 1975, 1985, 1998, and 2007.10,11,12,13,14)
Growth Charts in Korea between 1967 and 1997 acted as a growth reference and derived from the most recent large-scale anthropometric measurement data obtained. However, the latest growth charts, i.e., the 2007 Korean National Growth Charts (KNGC2007), were developed as a standard in part by using advanced statistical methods, such as data smoothing and the Lambda-Mu-Sigma (LMS) method, which had been used in the 2000 Centers for Disease Control and Prevention (CDC) Growth Charts15) and the World Health Organization (WHO) Child Growth Standards (WHO-CGS).16)
However, growing concerns have been raised about the KNGC 2007. First, the KNGC2007 was not suitable for evaluating the growth of breastfed infants, even though breastfeeding is recommended as the ideal nutritional supply for infants. Because KNGC2007 was compiled from the anthropometric data of both breastfed and formula-fed infants and children, a difference was observed in the growth pattern between breastfed and formula-fed infants.17) The WHO published the WHO-CGS in 2006, which was developed using data of healthy breastfed infants and children in an optimal environment, obtained from the WHO Multicentre Growth Reference Study (MGRS) undertaken between 1997 and 2003. The WHO-CGS was regarded as the standard for infants and children among the currently used growth charts.18) Thereafter, the WHO-CGS was adopted as growth charts for infants and children aged 0–24 months in the United States of America (USA) and aged between 2 weeks and 48 months in the United Kingdom (UK).19,20) A second concern was the possibility of underestimating the prevalence of overweight children and obesity using KNGC2007 because the 95th percentile values of the weight-for-age and body mass index (BMI)-for-age charts in the KNGC2007 were higher in boys than their counterparts in other western countries. The KNGC2007 was developed using data from the National Anthropometric Survey in 1997 (NAS1997) and 2005 (NAS2005), when the prevalence of obesity in Korea had already begun to increase. In the USA and UK, data sources, which were obtained before the prevalence of obesity increased, were used for the development of the growth charts to prevent weight-for-age and BMI-for-age percentiles from shifting upward.5,15) In the USA, several weight data sets were excluded from the development of the 2000 CDC Growth Charts, which were collected when the prevalence of obesity increased. The median value (50th percentile) of BMI-for-age in Korean children and adolescents increased between 1997 and 2005 and has plateaued since 2005.21) However, the 95th percentile values of BMI-for-age had increased between 1997 and 2015 (Fig. 1). Early intervention for obesity prevention became a worldwide issue due to the increasing prevalence of obesity and its related comorbidities. In Korea, the continuous increase in values belonging to the higher BMI percentile advocates taking preventive measures for obesity. As a final concern, the prevalence of short stature in children and adolescents might have been underestimated. The height of Korean children and adolescents increased between 1997 and 2005 and has plateaued since 2005, which reflects the secular trends of weight for age. However, the final height at the age of 18 years has remained unchanged since 1997 (Fig. 2).22) The KNGC2007 was developed using data from NAS1997 and NAS2005, which is unsuitable for the current population.
The Korean Centers for Disease Control and Prevention (KCDC) and the Korean Pediatric Society started a project to produce new growth charts in 2015, to address the concerns described above. The suitability of the KNGC2007 for the assessment of physical growth and development of present-day Korean children and adolescents has been reviewed extensively. The introduction of the WHO-CGS was evaluated and validated. Finally, the new 2017 Korean National Growth Charts (KNGC2017) were established using nationwide anthropometric measurement data. The present review focuses on the process of the elaboration of the new growth charts and the comparison of the major features of the KNGC2017 with its previous version.
The process of developing the KNGC2017 was undertaken between 2015 and 2017, in cooperation with the Committee for School Health and Public Health Statistics of the Korean Pediatric Society and the Division of Health and Nutrition Survey, Korea Centers for Disease Control and Prevention. The Committee for the Development of Growth Standards for Korean Children and Adolescents (the Committee) was organized to guide the development and production of the KNGC2017. The members of the Committee were composed of 11 experts specialized in pediatrics, family medicine, preventive medicine, statistics, and nutrition, who reviewed and commented every process of the KNGC2017 development including setting a goal for the elaboration, statistical methodology, and results.
During 2015 and 2016, the standardized model of the new growth charts was developed and the new growth charts were proposed by the Korean Pediatric Society through KCDC-sponsored policy-making research. In 2017, the final version of the growth charts based on this research was constructed and validated. Instructions and a user guidebook for the new growth charts were also prepared. During this process, the Committee meetings were held on 7 occasions. A public hearing for the growth charts was held for gathering opinions in July 2017.
The KNGC2017 was updated to overcome the limitations of the KNGC2007 version. The major changes included the adaptation of the WHO-CGS for infants and young children, upward adjustment of height-for-age growth charts, and downward adjustment of BMI-for-age growth charts.
The WHO released the WHO-CGS in 2006. The WHO-CGS was a prescriptive standard that presented “how children should grow”rather than a descriptive reference that presented “how children are growing.” WHO-CGS is used as a global standard for growth of children younger than 6 years of age. Numerous countries including the USA and the UK, have introduced the WHO-CGS as growth charts for infants and children.19,20,23)
The WHO performed a MGRS to produce growth standards. The data of healthy breastfed infants and children in a favorable condition were collected from 6 countries (Brazil, Ghana, India, Norway, Oman, and the USA) between 1997 and 2003. Data from approximately 8,500 children were collected longitudinally from birth to 24 months or cross-sectionally from 18 to 71 months of age. Among the participants, infants and children exclusively/predominantly breastfed for at least 4 months from birth in optimal health conditions were selected for the development of the growth charts. The WHO-CGS consist of height-for-age, weight-for-age, BMI-for-age, and weight-for-height charts.
Adoption of the WHO-CGS in Korean infants and children was reviewed and evaluated using 2 datasets: height, body weight, and head circumference data obtained from the National Health Screening Program for Infants and Children from 2007 to 2014 and birth weight from the birth registration data of Statistics Korea, a national statistics information service. Data were transformed to z scores using the WHO-CGS. Adoption of WHO-CGS was regarded as acceptable, when the mean z scores of Korean infants and children were within the range of mean height z scores from participating countries in WHO MGRS, which was between −0.33 and +0.49 in children aged <2 years and between −0.41 and +0.46 in children aged 2 years or more (MGRS range).24)
The z scores of the birth weight of Korean infants ranged from −0.21 to −0.06, which was within the MGRS range. The height z score was taller at 4−24 months, and shorter afterwards. Weight was heavier at 4–71 months. The height and weight z score was out of the MGRS range from birth to 12 months and within the MGRS range afterwards. The BMI and head circumference were within the MGRS ranges, despite higher values in all age groups.
Based on the aforementioned results, the Committee decided to adopt the WHO-CGS for Korean infants and children. Before the age of 30 months, height and weight were taller and heavier, respectively, although the difference decreased at older ages. Systematic errors during anthropometric measurement were also considered. Moreover, because data sources were lacking for use as a standard for breastfed infants and children in Korea, the adoption of the WHO-CGS was necessary, as this would contribute the increase in prevalence of breastfeeding. In the USA and the UK, the WHO-CGS have been introduced as growth standards to reflect the increase of breastfeeding practices, to mitigate the concerns regarding the slower weight gain observed in breastfed babies, and to reduce the proportion of infants classified as underweight.19,20)
The WHO-CGS provides growth charts for children up to 60 months of age. The countries, where the WHO-CGS has been introduced, decide individually on the age of adoption of the standards according to their specific circumstances. In the USA, the use of the WHO-CGS was recommended for children aged <24 months, because a longitudinal study was used to develop the WHO-CGS at this age group and changes in the methods used for height measurement caused a disjunction at the age of 24 months.19) In the UK, the WHO-CGS were adopted for infants and children aged between 2 weeks and 48 months, because there was a gap between the UK growth charts and those of the WHO-CGS from birth to 2 weeks of age, and the National School Entry Surveillance survey is performed at around 5 years of age.20)
For the KNGC2017, the WHO-CGS was adopted up to the age of 35 months, which was the age indicating a smoother transition between growth curves. Twenty-four months of age was considered a transition point from the WHO-CGS to the KNGC2017 guidelines, as the method for measuring height changed at this age from supine to standing position. However, 24 months of age was not accepted for transition because the supine height in the KNGC2017 is taller than standing height in the WHO-CGS.
The NAS1997 and NAS2005 were used for the development of the KNGC2017 (Table 1). These were the most recently measured data available with a sufficient number of participants for the development of the growth charts. The NAS2005 data represented the current height of Korean adolescents, because the final height has not changed since 2005. Moreover, BMI has increased since 1997; however, additional anthropometric measurements for the development of new growth charts were not necessary.
Data from the National School Health Examination (NSHE) and the Korea National Health and Nutrition Examination Survey (KNHANES) were also considered as potential data sources for growth charts, which were not suitable for the following reasons. The NSHE data were available from 2006, when the prevalence of obesity had already increased. For the development of the growth charts, data was needed from the period prior to the increase in the prevalence of obesity. Moreover, the KNHANES data consisted of smaller numbers of children and adolescents for the development of growth charts.
For the KNGC2017, height-for-age charts were developed based on the NAS2005 data, to represent the current growth status of children and adolescents. For weight-for-age, BMI-for-age, and weight-for-height charts, both the NAS1997 and NAS2005 data were used. For head circumference-for-age charts, the NAS2005 data was used because age was recorded at a monthly basis.
Similarly, the growth charts in the USA and the UK used the data source from the period before the increased prevalence of obesity, namely, before the year 2000. In the 2000 CDC Growth Charts of the USA, data sources were applied differently with regard to height-for-age, weight-for-age and BMI-for-age according to the direction of the growth charts.
During growth chart development, inclusion of data with extreme values resulted in skewing of the curve. Therefore, several exclusions for the removal of outliers were to be made before chart creation.
Height was grouped by 2-cm intervals, and then the median and standard deviation (SD) of weight-for-height were calculated. Because the distribution of weight-for-height was skewed to the right, data was divided into 2 groups according to values above or below the median. The SD for the weight-for-height values above and below the median was calculated respectively, after symmetric values to the median were generated.
Then, data exclusion was applied differently in accordance with the charts. In cases of height-for-age and head circumference-for-age charts, data with weight-for-height values below −3 SD or above +3 SD were excluded. For weight for age, BMI-for-age and weight-for-height charts, data with weight-for-height values below −3 SD or above +2 SD were excluded. However, for boys aged 5–18 years, weight-for-height data over the 95th percentile in the NAS2005 was removed first; then weight-for-height values below −3 SD or above +2 SD were excluded. This process was performed to uniform the 95th percentile values of the BMI for age between the NAS1997 and NAS2005. For boys aged 5–18 years, weight and BMI values from the KNGC2007 were higher than those of other countries. Moreover, in the KNGC2007, the difference in BMI data between 1997 and 2005 among boys in this age group was larger than that of girls and of other age groups.
In the WHO-CGS, weight-for-height values below −3 SD and above +3 SD during the longitudinal follow-up in children aged 0–24 months were excluded, although weight-for-height values below −3 SD or above +2 SD for those aged 2 years or more were removed due to skewness of data to the right. In the USA, for the development of weight-for-age and BMI charts in the 2000 CDC Growth Charts, weight data of children aged ≥6 years from the National Health and Nutrition Examination Survey III were excluded due to the increased prevalence of obesity.15)
Age in the KNGC2017 was grouped by 1-month intervals. In the NAS2005, the exact age (month) could be calculated using the birth date and measurement date. However, because no data were available on the dates of birth and measurements in the NAS1997 version, age was grouped at 6-month intervals between 2–6 years of age and at 1-year intervals at 6–20 years. Thus, the age of children aged ≤6 years was grouped as follows: 2–2.5 years corresponded to 24 months, 2.5–3 years corresponded to 30 months, etc. For the development of the weight-for-height chart, height was grouped by 1-cm intervals.
Percentile values of height-for-age and head circumferences-forage charts were calculated from the NAS2005 only. For weight-for-age, BMI-for-age, and weight-for-height charts, percentile values were calculated from the NAS1997 and NAS2005, respectively. Then, the mean percentile values were calculated as follows:
Values at the 1st, 3rd, 5th, 10th, 15th, 25th, 50th, 75th, 85th, 90th, 95th, 97th, and 99th percentiles were calculated. SDs were calculated at the point of −3 SD, −2 SD, −1 SD, 0 SD, +1 SD, +2 SD, and +3 SD.
The use of calculated percentile values per se made it difficult to reflect the trend for growth due to fluctuations of age and height. Therefore, the curve smoothing process was necessary to reduce the fluctuation of percentile values. A large sample size of ≥300 was necessary for each age group and sex for precise curve fitting.25) In the NAS1997 and NAS2005 versions, over 1,000 participants were assessed for each age group and sex.
For curve smoothing, nonparametric methods were used for the application of the intrinsic tendency of data, because the function of trends for growth was difficult to define. In the KNGC2017, for each growth chart, percentiles and SD were calculated and smoothed using the Loess regression analysis in SAS 9.4 (SAS Institute, Cary, NC, USA). Loess stands for locally weighted regression, which is a nonparametric method for estimating smoothed curves from scattered plots.26) Detailed methods for calculating smoothed means and graphs have been described elsewhere.27)
In the KNGC2007, smoothing methods such as locally weighted regression models and polynomial regression were used to appropriately demonstrate the measuring values for each growth chart.28) However, in the KNGC2017, the Loess regression model was applied to all growth charts because of the lack of significant differences between the results of the KNGC2007, the relative ease of calculations, and an adequate reproducibility.
To evaluate the growth status for the same sex and age in children and adolescents, the z score for the standardized normal distribution was necessary. Calculation methods of the z score and percentile values were developed by Cole using Box-Cox transformation, to eliminate skewness, and the LMS technique29,30,31): “L” stands for Power of Box-Cox transformation, “M” for the median, and “S” for the coefficients of variation. Using the LMS method, the z score, or percentile values for certain ages and sex could be estimated. For example, the z score (z) for certain anthropometric data (y) at the age of a certain month (t) was calculated as follows32):
Percentile values (α) with corresponding SD were calculated as follows:
For the estimation of the L, M, and S parameters for the LMS method, a nonlinear least square analysis was used. It is a numeric estimation method that repeatedly adjusts for randomly given values similar to the original data. For the initial values of L, M, and S, random values within the data sets might be used. However, initial values in the extreme range might cause inconsistent results.33) In the KNGC2017, the “Colelms” command in Stata 14.2 (StataCorp LP, College Station, TX, USA) was used to determine the initial L, M, and S values for each growth chart (Table 2). Using the calculated L, M, and S values, the “Proc Nlin” command, a default setting of the Gauss-Newton method based on the initial L, M, and S values for nonlinear least square analysis in the SAS 9.4 software, was applied to obtain the final L, M, and S values and to estimate the anthropometric measurements at each age (months).
Growth charts were produced as growth curves and corresponding tables (Table 3). The age on the growth charts was presented according to month of age. All anthropometric measurements were presented by rounding off to the nearest tenth. For example, for the age of 72 months and 15 days and a height of 110.77 cm, these were expressed as 72 months and 110.8 cm. Percentile values of growth charts were calculated at the 1st, 3rd, 5th, 10th, 15th, 25th, 50th, 75th, 85th, 90th, 95th, 97th, and 99th percentiles. Z scores, which indicated the distance of the value from the mean, were estimated at of −3 SD, −2 SD, −1 SD, 0 SD, +1 SD, +2 SD, and +3 SD.
Growth charts (curves and tables) were divided into 2 charts due to the introduction of the WHO-CGS: infants and children under the age of 3 years (0–35 months) and children of 3–18 years. However, BMI-for-age charts were integrated from age 2 to 18 years, because the BMI was used as a screening tool for obesity starting at the age of 2 years. In the BMI-for-age charts, an indication of the transition from the WHO-CGS to the KNGC2017 was presented at the age of 3 years (36 months). Weight-for-height charts were prepared for ages between 0 and 23 months, because weight-for-height was used as a screening tool for overweight infants and children under the age of 2 years. Growth tables were presented according to the height measuring methods and the introduction of the WHO-CGS: supine height at 0–23 months using the WHO-CGS; standing height at 24–35 months using the WHO-CGS; and standing height at 3–18 years of age using the KNGC2017.
Too many curve lines in a chart would make it difficult to differentiate the lines in the younger age group. Therefore, the 3rd, 5th, 10th, 25th, 50th, 75th, 90th, 95th, and 97th percentiles were displayed in the growth charts for height-for-age, weight-for-age, weight-for-height and head circumference-for-age. In the BMI-for-age charts, the 85th percentile line, which was a cutoff point for the diagnosis of overweight children, was also included. Other percentile values were displayed in another data tables.
Percentile-based cutoff points for short stature, underweight, overweight, obesity, and microcephaly were presented as recommended criteria by the Korean Pediatric Society (Table 4). The WHO-CGS used SD scores as cutoff criteria, although these might cause confusion because percentile values are used for the cutoff criteria in children aged 3 years or over. In the WHO-CGS, the 2.3rd (−2 SD) and 97.7th percentiles (+2 SD) were used as the screening cutoffs for abnormal growth. Therefore, all cutoff criteria were set as percentile-based values. Most criteria are similar to those in the KNGC2007. However, overweight criteria consisted of weight-for-height instead of weight-for-age due to the introduction of the WHO-CGS in infants and children aged 0–2 years. Obesity criteria for children aged 2 years or over have changed from a BMI ≥95th percentile for age and sex or BMI ≥25 kg/m2 into the BMI ≥95th percentile for age and sex.
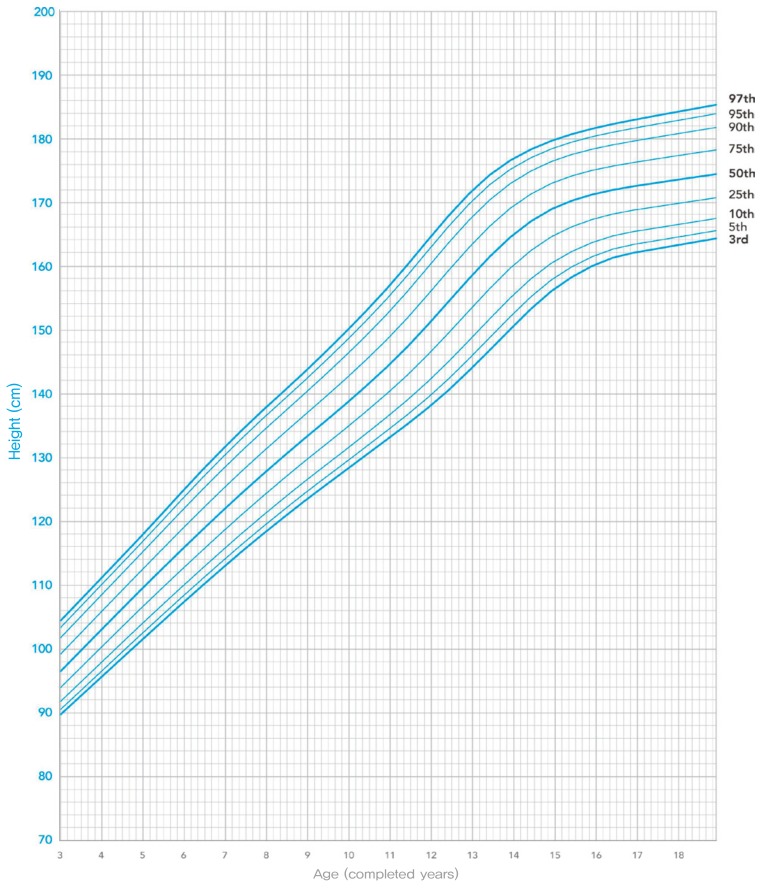
The finalized versions of the KNGC2017 are presented in Figs. 4, 5, 6, 7, 8, 9, 10, 11, 12, 13, 14, 15, 16, 17. Height-for-age charts for boys and girls aged 0–35 months are shown in Figs. 4, 5; height-for-age charts for boys and girls aged 3–18 years in Figs. 6, 7; weight-for-age charts for boys and girls aged 0–35 months in Figs. 8, 9; weight-for-age charts for boys and girls aged 3–18 years in Figs. 10, 11; BMI-for-age charts for boys and girls aged 2–18 years in Figs. 12, 13; weight-for-height charts for boys and girls with heights between 45 and 110 cm in Figs. 14,15; and head circumference-for-height charts for boys and girls in Figs. 16, 17. All growth curves and tables are available on the webpages of the KCDC (https://cdc.go.kr).
Percentile values of height-for-age and weight-for-height in the KNGC2017 decreased compared to that of the KNGC2007 due to the introduction of the WHO-CGS under the age of 3 years. In case of the height-for-age chart, the 95th percentile values of height-for-age decreased between 0 and 35 months in both sexes (Fig. 18). The 50th percentile value of height-for-age decreased between the ages of 0 and 27 months and increased between 28 and 35 months for boys, and decreased for girls except for 35 months. The 3rd percentile values, which were used as a cutoff for short stature, decreased between 0 and 13 months and increased between 14 and 35 months for boys, and decreased between 0 and 28 months and increased between 29 and 35 months for girls. For weight-for-age charts, the 5th, 50th, and 95th percentile lines of the KNGC2017 were below those of the KNGC2007 for most ages between 0 and 35 months (Fig. 19).
With regard to head circumference, the majority of the percentile values decreased, although the 3rd percentile values for boys aged 3–20 months increased. The height-for-age value increased for all percentile values at the age of 3 years or more compared with the KNGC2007 (Fig. 20).
The 95th percentile values of the BMI, which were used as the criteria for obesity, decreased. However, there is an interruption in the growth charts because the 5th and 50th percentile values of the BMI increased at the age of 3 years due to the removal of additional outliers of upper values of height-for-weight (Fig. 21).
Using data from the 2015 National Health Screening Program for Infants and Children, the proportion of short stature, underweight, and overweight children was compared by applying both the KNGC2007 and the WHO-CGS. On adopting the WHO-CGS, the proportion of infants and children aged 0–23 months with short stature was similar in boys and lower in girls compared to that observed on adopting the KNGC2007. Furthermore, the proportion of underweight infants was lower in boys and girls on adopting the WHO-CGS compared to the KNGC2007 (Table 5).
The proportion of short stature, underweight, and overweight children and adolescents was compared using data from the KNHANES 2011–2015 (2–18 years) applying the KNGC2007 and the KNGC2017. The KNHANES provides the ages of children and adolescents on a monthly basis between 2 and 6 years and on a yearly basis over 6 years. Therefore, when comparing data, age was applied differently according to the KNHANES data set (e.g., 7 years old in the KNHANES corresponds to 84 months in the growth charts). On applying the KNGC2017 in children and adolescents aged 2–18 years according to the KNHANES data, the proportion of short stature, underweight and obese children and adolescents increased in both sexes compared to that observed on applying the KNGC2007 (Table 6). However, when different criteria for obesity were applied for the KNGC2007 and KNGC 2017, the prevalence of obesity was lower in boys (11.7% vs. 11.4%) and higher in girls (8.7% vs. 9.1%).
The major features of the updated KNGC2017 are as follows: introduction of the WHO-CGS for infants and children aged 0–35 months, adjustment of BMI-for-age charts, simplification of criteria for obesity, adjustment of height-for-age charts, introduction of additional percentile lines (1st and 99th), and growth charts with SD lines.
The application of the KNGC2017 require several considerations. The WHO-CGS was introduced at the age of <3 years, because breastfeeding is ideal for the growth and development of infants and children and the WHO-CGS was defined using data from infants who were breastfed. This might cause an increase in the prevalence of overweight infants among those who are formula-fed and show relatively rapid growth.34) The proportion of overweight cases in the 2015 National Health Screening Program for Infants and Children data doubled when the KNGC2017 was applied compared to the KNGC2007. In contrast, fewer infants were classified as underweight (Table 5). Breastfeeding is recommended as a physiological norm, although a relatively small proportion of babies are breastfed in Korea.35) Therefore, careful consideration is essential when interpreting growth status in formula-fed infants. Moreover, the importance of breastfeeding should be emphasized for the ideal growth of infants and children.
In the KNGC2017, there were two disjunctions. The first disjunction occurred between 23 and 24 months of age because there is a change in the method of height measurement. The second disjunction occurred located between the ages of 35 and 36 months because the WHO-CGS was applied to those aged <3 years (0–35 months) and the newly developed growth charts were applied to individuals aged 3–18 years. For example, in the case of the BMI, the 95th percentile values for 35 and 36 months were similar, although the 5th and 50th percentile values of 35 and 36 months showed differences. Therefore, children at the ages of transition in the growth charts deserve careful interpretation. Longitudinal follow-up is recommended in the case of growth abnormalities such as short stature, overweight, and obesity at ages around 23–24 and 35–36 months.
In the KNGC2017, the 3rd percentile values of height increased because height corresponding to criteria of short stature in the KNGC2007 was inappropriately short for current-day children and adolescents. This might lead to an increased number of subjects directed towards growth hormone therapy, which would be covered by the National Health Insurance. Application of growth hormone therapy should only be performed, when indicated, after longitudinal follow-up for growth and careful consideration of growth status.
Criteria for obesity in the KNGC2017 were a BMI ≥95th percentile for age and sex, as recommended by the Korean Pediatric Society. In the KNGC2007, obesity was defined as a BMI ≥95th percentile for age or a BMI ≥25 kg/m2. A difference would be observed for statistical reports by applying different growth charts. The 95th percentile values of the BMI for age were decreased, which might result in an intensification of the diagnosis of obesity. Intensive prevention of childhood obesity is a global issue, because childhood obesity leads to adulthood obesity. These global trends were applied during the development of KNGC2017. Interventions for childhood obesity include increasing physical activity and healthier eating habits with the active participation of all family members. Optimal stature growth should also be considered. In children and adolescents, growth patterns of height and weight have a wide range of variation, which needs close monitoring and frequent follow-up.
Growth charts depict “how children should grow.” Therefore, growth charts need not represent the current status of growth of children and adolescents. Although growth charts have been revised every 10 years in Korea, application of the same growth chart each year is necessary in epidemiological studies assessing the trends of growth.
The new growth charts were developed to provide better estimation of growth of Korean children and adolescents, which might represent “how Korean children and adolescents should grow.” To overcome limitations of the KNGC2007, the new growth charts include several important features. First, the WHO-CGS was introduced for infants and children aged 0–35 months. For children and adolescents aged 3–18 years, new growth charts were developed using previously measured large data sets. Second, BMI charts were adjusted and the 95th percentile values of the BMI were decreased. The criteria for obesity were simplified as a BMI ≥95th percentile for age and sex. Third, the 3rd percentile values for the height-for-age charts were increased. Moreover, the KNGC2017 also include an instruction and guidebook for users that is available on the web page of KCDC (http://cdc.go.kr). The KNGC2017 are recommended for the evaluation of body size and growth of Korean children and adolescents in clinics and the public health field. Continuous evaluation is needed for further improvement of the growth charts. Application of the KNGC2017 in various fields will help all users understand the growth patterns among Korean children and adolescents.
Acknowledgments
This study was supported by a grant from the Ministry of Health and Welfare (No. 2016-E34004-00). The authors thank everyone who helped and supported the development of the 2017 Korean National Growth Charts, especially the members of the Committee for the Development of Growth Standards for Korean Children and Adolescents, the Committee for School Health and Public Health Statistics of the Korean Pediatric Society, and the Division of Health and Nutrition Survey, Korea Centers for Disease Control and Prevention.
The Committee for the Development of Growth Standards for Korean Children and Adolescents: Sei Won Yang (Chair, Seoul National University, College of Medicine), Sochung Chung (Konkuk University, School of Medicine), Hyojee Joung (Seoul National University, Graduate School of Public Health), Young-Ho Khang (Seoul National University, College of Medicine), Kyung Mo Kim (University Ulsan, College of Medicine), Soon Young Lee (Ajou University), Jin Soo Moon (Seoul National University Children's Hospital), Chung Mo Nam (Yonsei University, Graduate School of Public Health), Kyungwon Oh (Center for Disease Control and Prevention, Division of Health and Nutrition Survey), Kyung Hee Park (Hallym University Sacred Heart Hospital), Kye Shik Shim (Kyung Hee University Hospital at Gangdong), Choong Ho Shin (Seoul National University, College of Medicine).
The Committee for School Health and Public Health Statistics, the Korean Pediatric Society: Jin Soo Moon (Seoul National University Children's Hospital), Hyun Wook Chae (Yonsei University Gangnam Severance Hospital), Ky Young Cho (Hallym University Kangnam Sacred Heart Hospital), Hyun Jin Choi (Seoul National University Children's Hospital), Ji Whan Han (The Catholic University of Korea, Yeouido St. Mary's Hospital), Seung-sik Hwang (Graduate School of Public Health, Seoul National University), Jae Hyun Kim (Seoul National University Bundang Hospital), Hea Kyoung Lee (Veterans Health Service Medical Center), Jin A Lee (Seoul Metropolitan Government-Seoul National University Boramae Medical Center), Young-Il Rho (Chosun University Hospital), Eell Ryoo (Gachon University Gil Medical Center), Jung Ok Shim (Korea University Guro Hospital), Son Moon Shin (Cheil General Hospital & Women's Health Care Center, Dankook University).
Notes
Conflicts of interest:
No potential conflict of interest relevant to this article was reported.
References
2. Wright CM, Williams AF, Cole TJ. Growth Chart Expert Group. Advances in growth chart design and use: the UK experience. World Rev Nutr Diet 2013;106:66–74.


3. Styne DM, Arslanian SA, Connor EL, Farooqi IS, Murad MH, Silverstein JH, et al. Pediatric obesity-assessment, treatment, and prevention: an endocrine society clinical practice guideline. J Clin Endocrinol Metab 2017;102:709–757.


4. Grimberg A, DiVall SA, Polychronakos C, Allen DB, Cohen LE, Quintos JB, et al. Guidelines for growth hormone and insulin-like growth factor-i treatment in children and adolescents: growth hormone deficiency, idiopathic short stature, and primary insulin-like growth factor-i deficiency. Horm Res Paediatr 2016;86:361–397.


5. Freeman JV, Cole TJ, Chinn S, Jones PR, White EM, Preece MA. Cross sectional stature and weight reference curves for the UK, 1990. Arch Dis Child 1995;73:17–24.


6. Ogden CL, Kuczmarski RJ, Flegal KM, Mei Z, Guo S, Wei R, et al. Centers for Disease Control and Prevention 2000 growth charts for the United States: improvements to the 1977 National Center for Health Statistics version. Pediatrics 2002;109:45–60.


7. Isojima T, Kato N, Ito Y, Kanzaki S, Murata M. Growth standard charts for Japanese children with mean and standard deviation (SD) values based on the year 2000 national survey. Clin Pediatr Endocrinol 2016;25:71–76.


8. Zong XN, Li H. Construction of a new growth references for China based on urban Chinese children: comparison with the WHO growth standards. PLoS One 2013;8:e59569.


9. Rosario AS, Schienkiewitz A, Neuhauser H. German height references for children aged 0 to under 18 years compared to WHO and CDC growth charts. Ann Hum Biol 2011;38:121–130.


10. Kim DU, Rie KC. Studies on height, sitting height and relative sitting height of Korean primary school children in urban areas. J Korean Pediatr Soc 1967;10:585–598.
11. Moon HR, Yun DJ. Height and weight (and other measurements) of children in Korea 1975. J Korean Pediatr Soc 1978;21:183–197.
12. Shim TS, Ko KW. Physical growth of children in Korean, 1985. J Korean Pediatr Soc 1986;29:1–22.
13. Lee DH, Hong YM, Lee KY. The Committee for Public Health Statistics. The Committee for Nutrition. 1998 Korean National Growth Charts. Seoul: The Korean Pediatric Society, 1999.
14. Moon JS, Lee SY, Nam CM, Choi JM, Choe BK, Seo JW, et al. 2007 Korean National Growth Charts: review of developmental process and an outlook. Korean J Pediatr 2008;51:1–25.

15. Kuczmarski RJ, Ogden CL, Guo SS, Grummer-Strawn LM, Flegal KM, Mei Z, et al. 2000 CDC Growth Charts for the United States: methods and development. Vital Health Stat 11 2002;(246): 1–190.
16. WHO Multicentre Growth Reference Study Group. WHO Child Growth Standards based on length/height, weight and age. Acta Paediatr Suppl 2006;450:76–85.


17. Cole TJ, Paul AA, Whitehead RG. Weight reference charts for British long-term breastfed infants. Acta Paediatr 2002;91:1296–1300.


18. WHO Multicentre Growth Reference Study Group. Enrolment and baseline characteristics in the WHO Multicentre Growth Reference Study. Acta Paediatr Suppl 2006;450:7–15.


19. Grummer-Strawn LM, Reinold C, Krebs NF. Centers for Disease Control and Prevention (CDC). Use of World Health Organization and CDC growth charts for children aged 0-59 months in the United States. MMWR Recomm Rep 2010;59(RR-9): 1–15.
20. Scientific Advisory Committee on Nutrition. Application of WHO growth standards in the UK. Report prepared by the Joint SACN/RCPCH Expert Group on Growth Standards. London, UK: The Stationery Office, 2007.
21. Oh K, Jang MJ, Lee NY, Moon JS, Lee CG, Yoo MH, et al. Prevalence and trends in obesity among Korean children and adolescents in 1997 and 2005. Korean J Pediatr 2008;51:950–955.

22. Ryoo NY, Shin HY, Kim JH, Moon JS, Lee CG. Change in the height of Korean children and adolescents: analysis from the Korea National Health and Nutrition Survey II and V. Korean J Pediatr 2015;58:336–340.


23. de Onis M, Onyango A, Borghi E, Siyam A, Blössner M, Lutter C, et al. Worldwide implementation of the WHO Child Growth Standards. Public Health Nutr 2012;15:1603–1610.


24. WHO Multicentre Growth Reference Study Group. Assessment of differences in linear growth among populations in the WHO Multicentre Growth Reference Study. Acta Paediatr Suppl 2006;450:56–65.


25. Guo SS, Roche AF, Chumlea WC, Johnson C, Kuczmarski RJ, Curtin R. Statistical effects of varying sample sizes on the precision of percentile estimates. Am J Hum Biol 2000;12:64–74.


26. Cleveland WS. Robust locally weighted regression and smoothing scatterplots. J Am Stat Assoc 1979;74:829–836.

27. Hur MH. Applied data analysis using R. Seoul: Freedom Academy, 2014.
28. Korea Centers for Disease Control and Prevention, Division of Chronic Disease Surveillance, Committee for the Development of Growth Standard for Korean Children and Adolescents. Korean Pediatric Society, Committee for School Health and Public Health Statistics. 2007 Korean children and adolescents growth standard (commentary for the development of 2007 growth chart). Cheongju: Korea Centers for Disease Control and Prevention, Division of Chronic Disease Surveillance, 2007.
30. Cole TJ. The LMS method for constructing normalized growth standards. Eur J Clin Nutr 1990;44:45–60.
31. Fenton TR, Sauve RS. Using the LMS method to calculate z-scores for the Fenton preterm infant growth chart. Eur J Clin Nutr 2007;61:1380–1385.


32. Cole TJ, Green PJ. Smoothing reference centile curves: the LMS method and penalized likelihood. Stat Med 1992;11:1305–1319.


33. Strutz T. Data fitting and uncertainty: a practical introduction to weighted least squares and beyond. 2nd ed. Wiesbaden (Germany): Springer Veiweg, 2016.
Fig. 1
Secular trends for body mass index for age in Korean children and adolescents. (A) Boys, (B) Girls. NSHE2015, 2015 National School Health Examination; NAS2005, National Anthropometric Survey in 2005; NAS1997, National Anthropometric Survey in 1997; KNGC2007, 2007 Korean National Growth Charts.
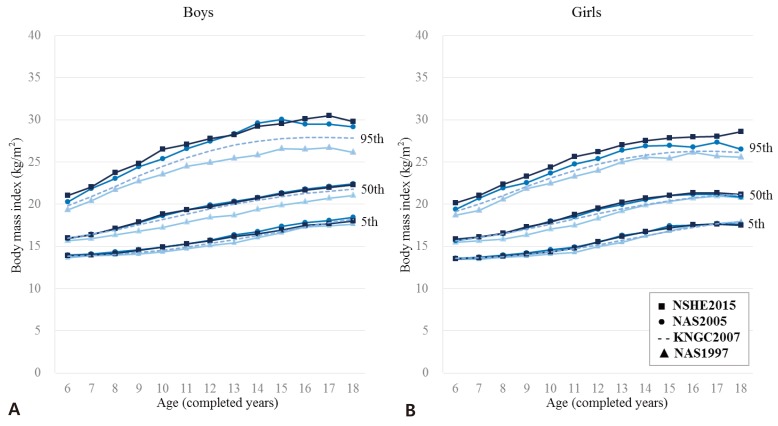
Fig. 2
Secular trends for height for age in Korean children and adolescents. (A) Boys, (B) Girls. NSHE2015, 2015 National School Health Examination; NAS2005, National Anthropometric Survey in 2005; NAS1997, National Anthropometric Survey in 1997; KNGC2007, 2007 Korean National Growth Charts.

Fig. 3
Process involved in the elaboration of the growth chart for children and adolescents aged 3–18 years. LMS, Lambda-Mu-Sigma.

Fig. 4
The 2017 Korean National Growth Charts: Height-for-age percentiles, from birth to 36 months, boys.
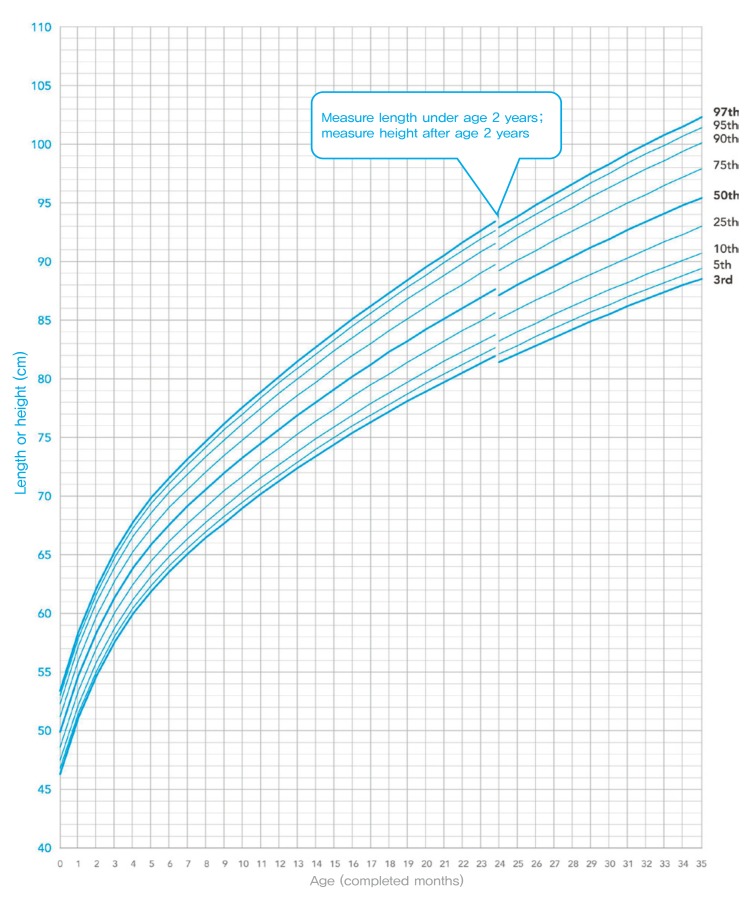
Fig. 5
The 2017 Korean National Growth Charts: Height-for-age percentiles, from birth to 36 months, girls.
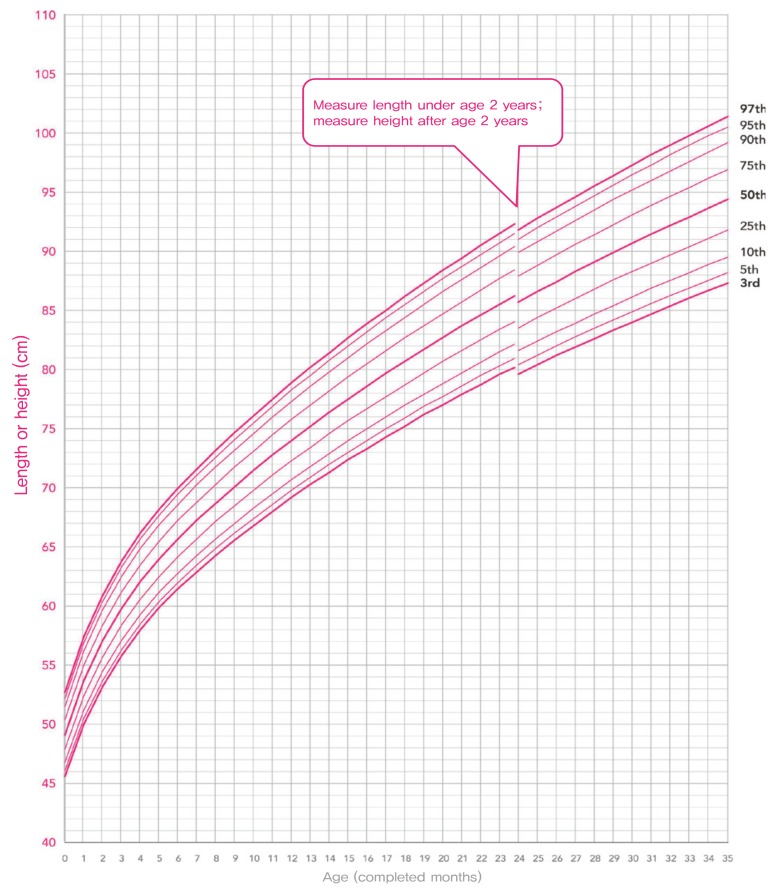
Fig. 7
The 2017 Korean National Growth Charts: Height-for-age percentiles, from 3 to 18 years, girls.
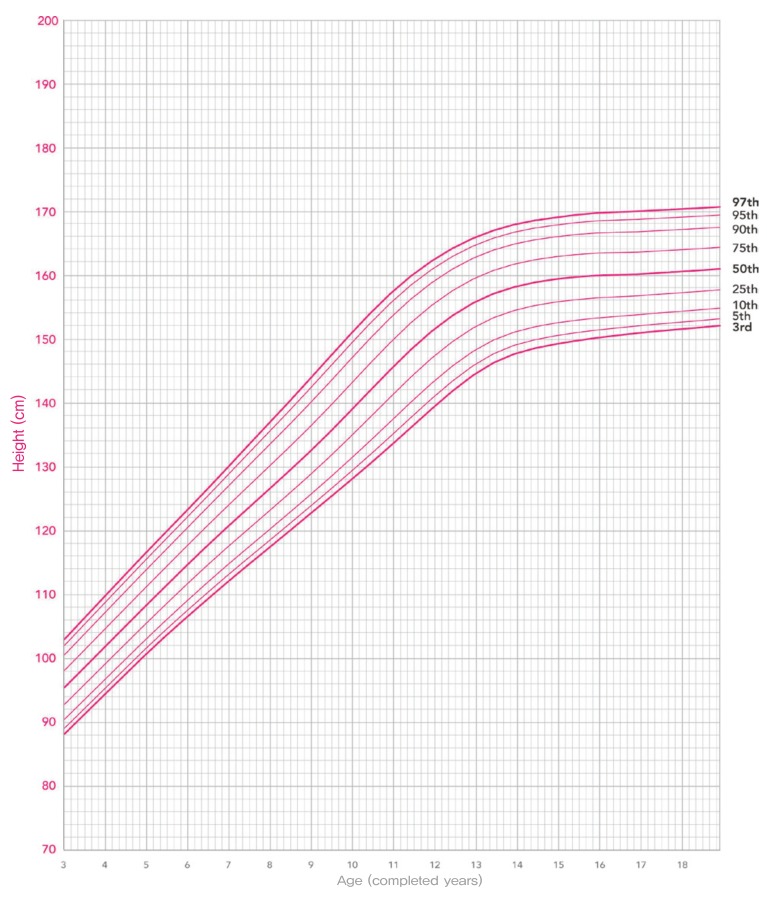
Fig. 8
The 2017 Korean National Growth Charts: Weight-for-age percentiles, from birth to 35 months, boys.
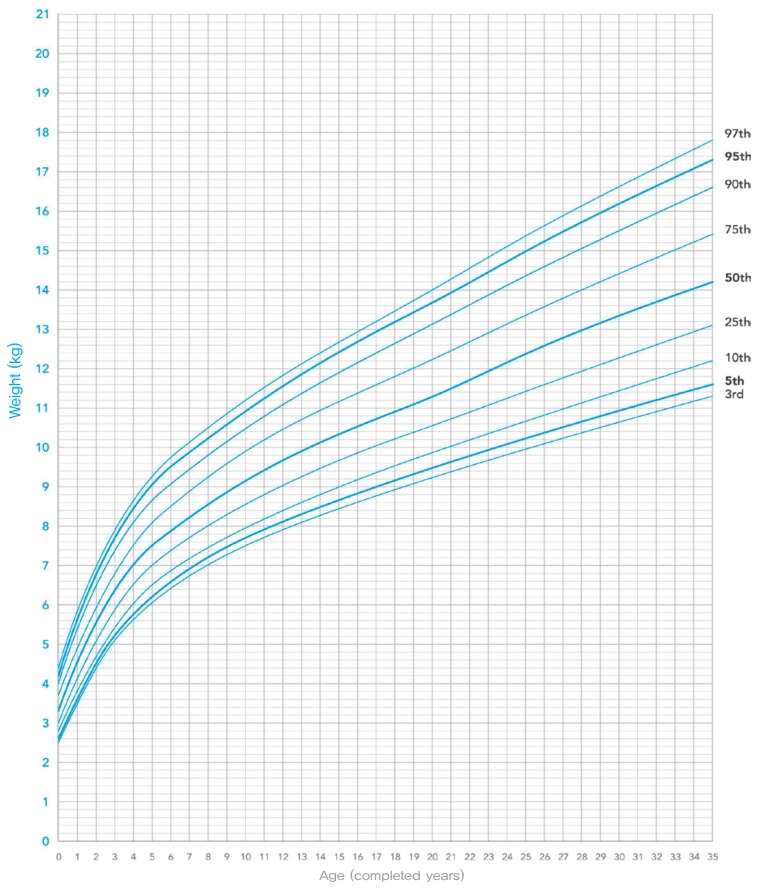
Fig. 9
The 2017 Korean National Growth Charts: Weight-for-age percentiles, from birth to 35 months, girls.
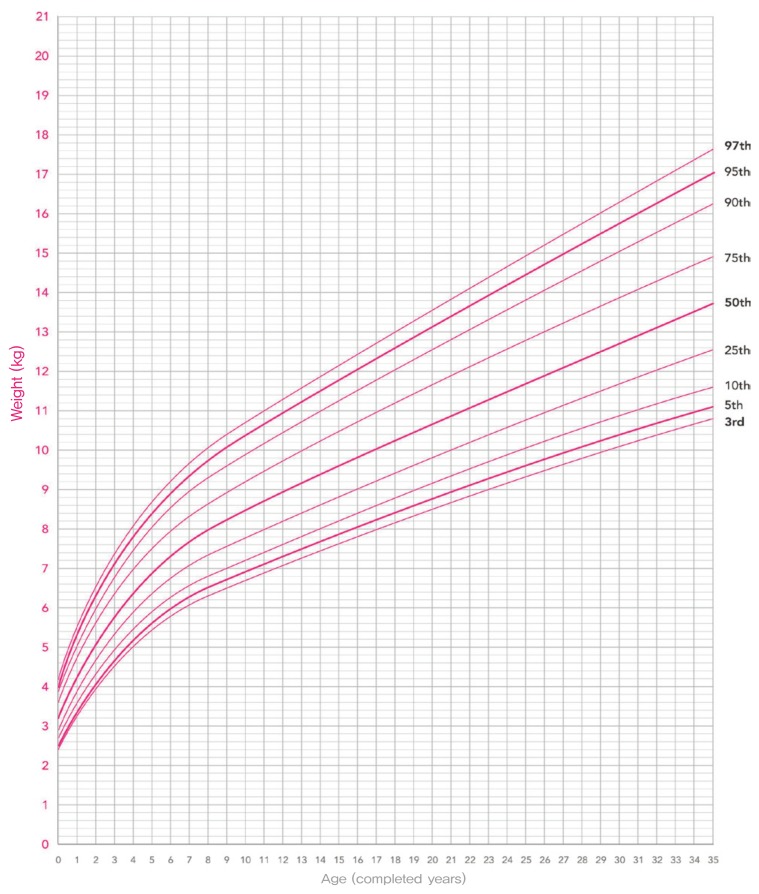
Fig. 10
The 2017 Korean National Growth Charts: Weight-for-age percentiles, from 3 to 18 years, boys.
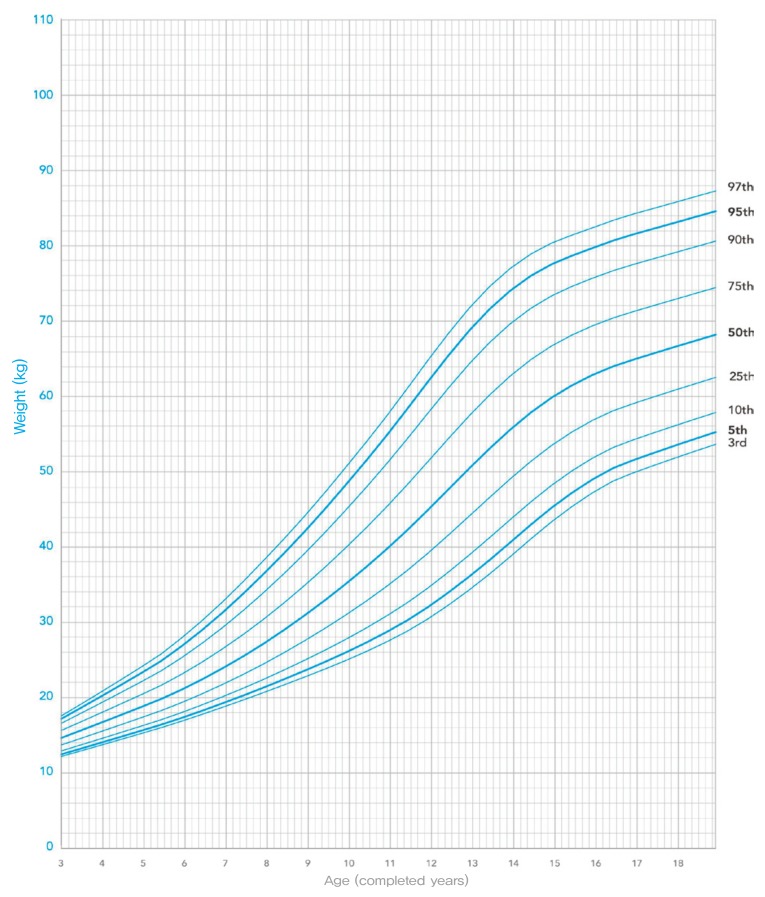
Fig. 11
The 2017 Korean National Growth Charts: Weight-for-age percentiles, from 3 to 18 years, girls.
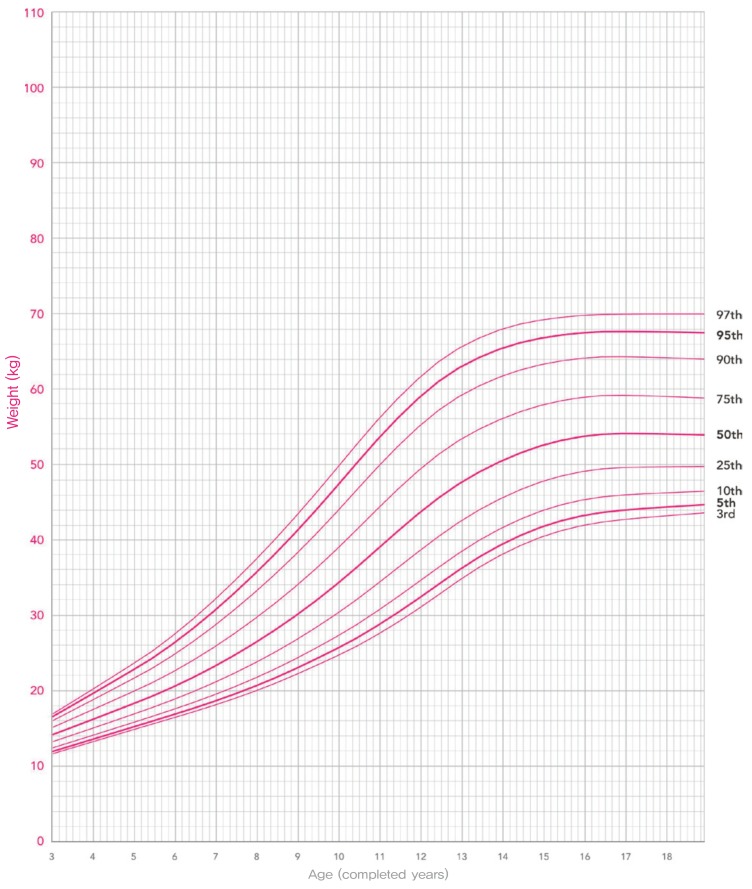
Fig. 12
The 2017 Korean National Growth Charts: Body mass index-for-age percentiles, from 2 to 18 years, boys.
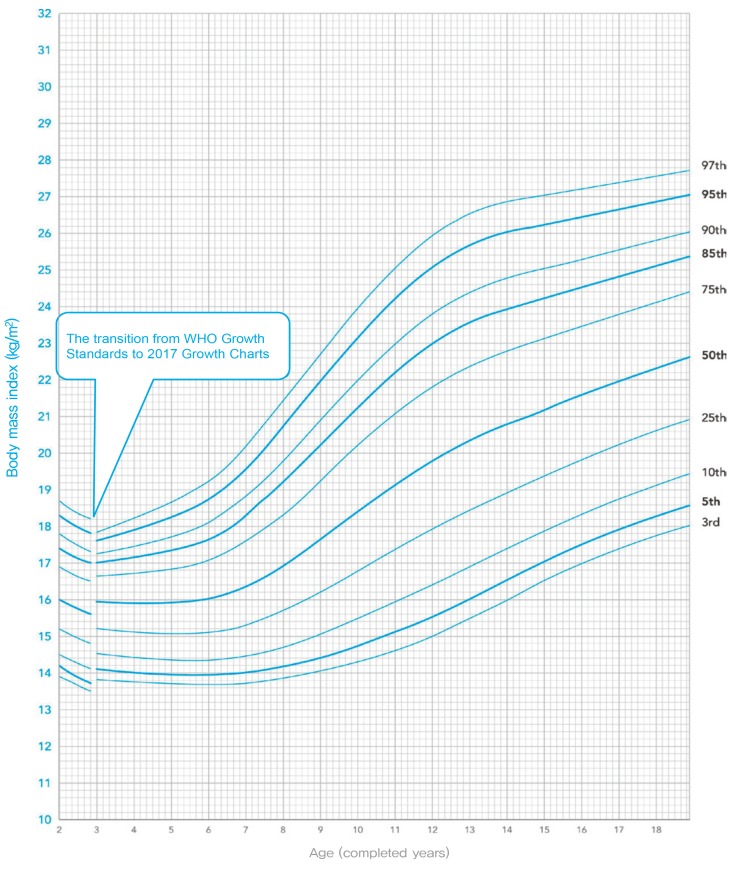
Fig. 13
The 2017 Korean National Growth Charts: Body mass index-for-age percentiles, from 2 to 18 years, girls.
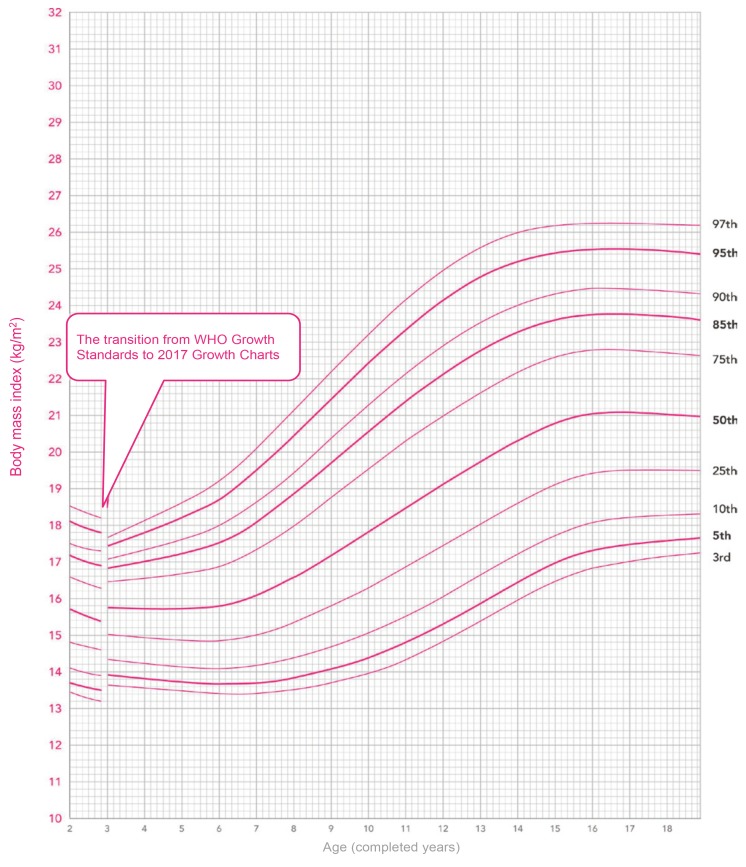
Fig. 14
The 2017 Korean National Growth Charts: Weight-for-height percentiles, from birth to 23 months, boys.
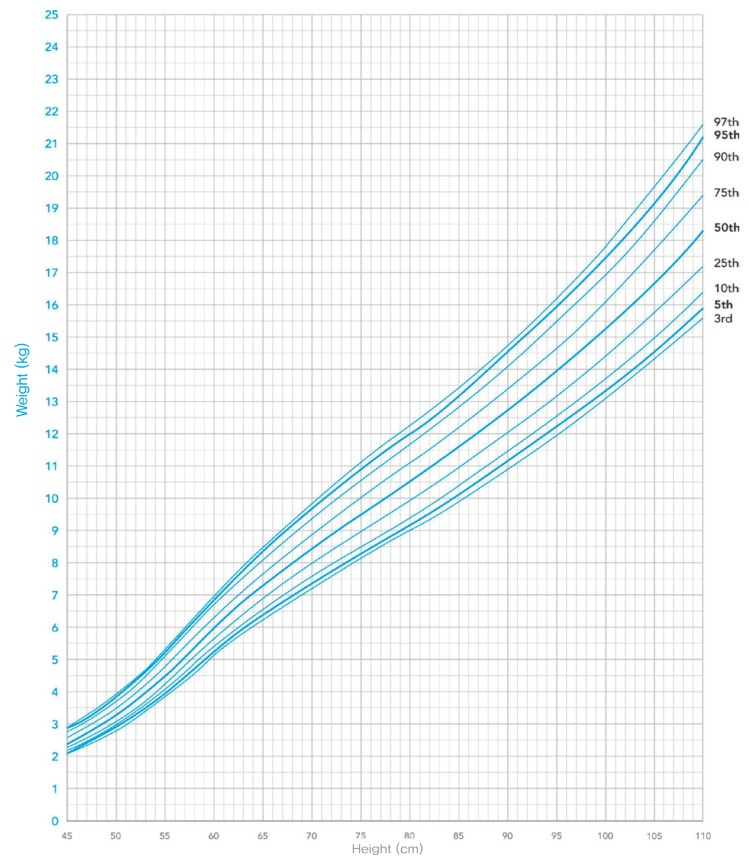
Fig. 15
The 2017 Korean National Growth Charts: Weight-for-height percentiles, from birth to 23 months, girls.

Fig. 16
The 2017 Korean National Growth Charts: Head circumference-for-age percentiles, from birth to 35 months, boys.

Fig. 17
The 2017 Korean National Growth Charts: Head circumference-for-age percentiles, from birth to 35 months, girls.
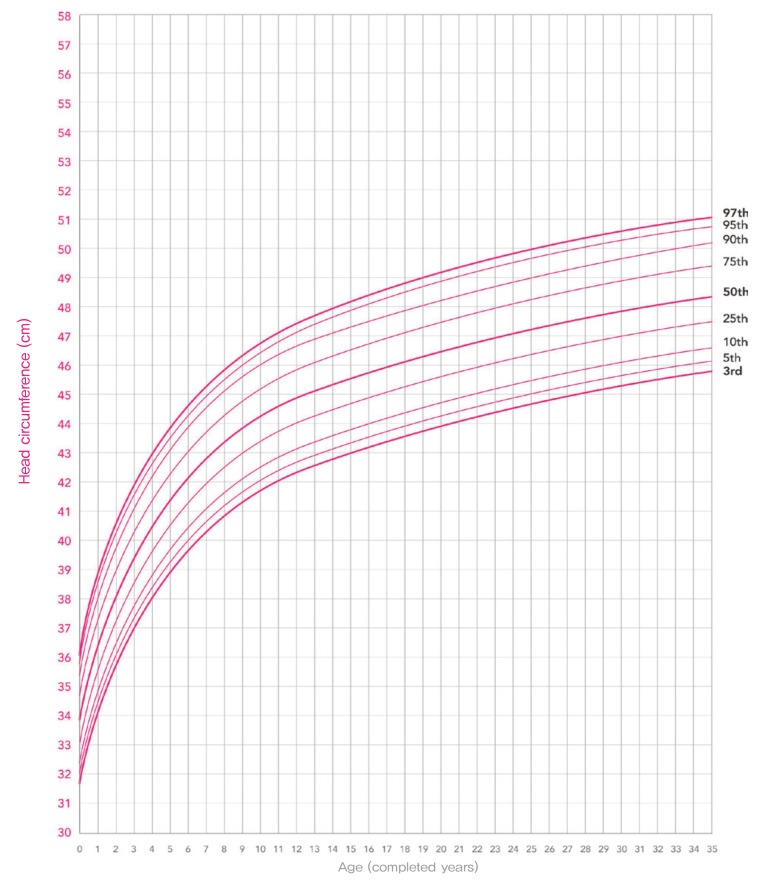
Fig. 18
Comparison of height-for-age charts for infants and children aged 0–35 months in the Korean National Growth Charts 2007 (KNGC2007) and 2017 (KNGC2017). (A) Boys, (B) Girls.

Fig. 19
Comparison of weight-for-age charts for infants and children aged 0–35 months in the Korean National Growth Charts 2007 (KNGC2007) and 2017 (KNGC2017). (A) Boys, (B) Girls.

Fig. 20
Comparison of height-for-age charts for children and adolescents aged 3–18 years in the Korean National Growth Charts 2007 (KNGC2007) and 2017 (KNGC2017). (A) Boys, (B) Girls.

Fig. 21
Comparison of body mass index-for-age charts for children and adolescents aged 3–18 years in the Korean National Growth Charts 2007 (KNGC2007) and 2017 (KNGC2017). (A) Boys, (B) Girls.

Table 1
The National Anthropometric Survey of 1997 and 2005
Table 2
Comparison of methods used for the development of growth charts
Table 3
Composition of the 2017 Korean National Growth Charts
Table 4
Screening criteria for growth abnormalities in the 2007 and 2017 Korean National Growth Charts
Table 5
Prevalence (%) of short stature and underweight status among infants and children aged 0–23 months
| Growth problem | Total (n=951,994) | Boys (n=488,548) | Girls (n=463,446) | |||
|---|---|---|---|---|---|---|
| KNGC2007 | KNGC2017 | KNGC2007 | KNGC2017 | KNGC2007 | KNGC2017 | |
| Short stature | 0.9 | 0.6 | 0.8 | 0.8 | 1.0 | 0.4 |
| Underweight | 2.2 | 0.5 | 2.0 | 0.6 | 2.4 | 0.3 |


 PDF Links
 PubReader
 ePub Link
 PubMed
 Download Citation


