


Introduction
An increase in childhood obesity and related complications have been one of the greatest causes for concern worldwide for the past 30 years [1,2]. Insulin resistance in obese children could play a pivotal role as a ‘driving force’ behind the association of metabolic syndrome with other conditions, such as dyslipidemia and hypertension [3,4]. Childhood obesity is an important cardiovascular risk factor and is associated with increased rates of premature death [5]. Abdominal obesity has also been reported as a risk factor for cardiovascular and metabolic disease in younger children [6-8]. Thus, the issue of prevention and control of obesity in younger individuals is increasing in importance.
Body mass index (BMI) and waist circumference (WC) have been used as traditional diagnostic tools to measure obesity and central adiposity. Both BMI and WC are considered useful parameters to identify cardiometabolic risks. However, there are some limitations to these currently used measures of adiposity. BMI and WC are strongly linked with ethnicity, age, and sex in children and adolescents. Age- and sexspecific reference tables are required to assess an individuals’ status of adiposity [9]. Although BMI is usually well related to body fat, BMI cannot fully reflect body composition and sometimes cannot distinguish fat tissues from muscle mass, because BMI contains information for height and weight only [10]. WC is a commonly used index to diagnose abdominal obesity, defined as 90th percentile or more by age and sex. WC is height-dependent, which might lead overor underestimation of abdominal obesity according to the height of children. In recent years, the waist-height ratio (WHR), which divides the WC by height, is also being used as an alternative index for the assessment of abdominal obesity. WHR has the advantage of being both a simple and convenient measurement. It has been reported the WHR is more accurate than BMI and WC in identifying cardiometabolic risk in adults [11]. In a prior systematic review, studies from 14 different countries including Caucasian, Asian, and Central American subjects showed that a WHR of ≥0.50 covers all cardiometabolic outcomes in both men and women [12]. In children and adolescents, there are reports that WHR is more suitable than WC and BMI for indicating the percent body fat in the United States [13] and some studies demonstrate that WHR and BMI produce similar results in identifying cardiometabolic risk worldwide [14-17]. Some studies using WHR have been reported in Korea. The results of these studies showed that WHR is a similar or better index for screening abdominal obesity with or without overweight or obesity, when compared with BMI. WHR is helpful in determining children at higher cardiometabolic risk [18-21]. Some of these studies presented the cutoff values obtained [19,22].
Although previous studies of WHR have been published, the distribution of WHR by sex and age in Korean children and adolescents has not been examined. In addition, there is a lack of analysis as to whether a WHR value of 0.5 is an appropriate cutoff of abdominal obesity and cardiometabolic risk in the pediatric population. Thus, the aims of this study were (1) to identify the secular changes of WC and WHR, (2) to compare WC with the prior Korean reference, (3) to confirm the distribution of mean WHR values by age and sex, and (4) to determine if WHR cutoff value of 0.5 is an appropriate predicting factor of cardiometabolic risk in childhood, using nationally representative data in children and adolescents.
Materials and Methods
1. Study population
Data from children and adolescents aged 6–18 years were used, which were obtained from the Korea National Health and Nutrition Examination Survey (KNHANES) (2005–2015). The KNHANES, a nationwide survey, is performed annually to collect data cross-sectionally and to assess the health and nutritional status of the Korean population by using a multistage clustered probability sampling study design. In this study, the cross-sectional data was composed of 4 waves, consisting of the 3rd (2005), 4th (2007–2009), 5th (2010–2012), and 6th (2013–2015) wave.
Of the 107,498 participants (male, 49,693; female, 57,805) in KNHANES, 18,916 children and adolescents aged 6–18 years (boys, 9,920; girls, 8,996) were selected. Finally, 13,257 subjects (boys, 6,987; girls, 6,270) were included for the analysis after excluding children and adolescents without any record of height, weight, or WC (n=5,659) (Supplementary Table 1). For the subgroup analysis, 5,267 participants aged 13–18 years (boys, 2,781; girls, 2,486) fasted for at least 8 hours prior to laboratory tests were included.
The Institutional Review Board of the Korea Centers for Disease Control and Prevention approved the KNHANES. All participants gave informed consent before data collection. The protocol of the present study was approved by the Institutional Review Board of Bundang Jesaeng General Hospital (approval number: PD18-02). All methods were performed according to the Declaration of Helsinki.
2. Anthropometric measurements and laboratory tests
All anthropometric measurements were conducted by trained individuals according to the prescribed protocol. Height measurement was used a stadiometer (Seca 225, Seca, Hamburg, Germany) and recorded to the nearest 0.1 cm. Weight measurement was performed using an electronic balance (GL-6000-20, G-tech, Seoul, Korea) and recorded to the nearest 0.1 kg. WC was measured with the end expiratory state of subjects at his/her midpoint between lower end of the last rib cage and the upper rim of the iliac crest using a tape measure (Seca 200, Seca) and recorded to nearest 0.1 cm. WHR was calculated by dividing WC (cm) by height (cm). Blood pressure (BP) was measured with subjects resting in a sitting position over 5 minutes and using a mercury sphygmomanometer (Baumanometer Desk Model 3020, WA Baum, Co., Copiague, NY, USA).
Blood tests were performed after 8 hours or more fasting. Fasting plasma glucose (FPG), triglyceride and high-density lipoprotein (HDL) cholesterol levels were measured using a Hitachi Automatic Analyzer 7600 (Hitachi, Tokyo, Japan). Glycated hemoglobin (HbA1c) was measured using high performance liquid chromatography (HLC-723G7; Tosoh, Tokyo, Japan), which is the method certified by the National Glycohemoglobin Standardization Program.
Abdominal obesity was defined as WC≥90th percentile for age and sex using Korean reference data from the 2007 Korean National Growth Charts [23]. Elevated BP was defined as systolic or diastolic BP≥90th percentile for age and sex using the 2007 reference [24]. Hyperglycemia was defined as FPG≥100 mg/dL. Elevated HbA1c was defined as HbA1c≥5.7%. High triglyceride was defined as triglyceride≥150 mg/dL. Low HDL cholesterol was defined as HDL cholesterol<40 mg/dL for boys aged 10–18 years, <40 mg/dL for girls aged 10–16 years and <50 mg/dL for girls aged ≥16 years.
3. Statistical analysis
All statistical analyses were performed using Stata 14.2 software (StataCorp LP, College Station, TX, USA) and GraphPad Prism version 7.04 for Windows (GraphPad Software, La Jolla, CA, USA). For the statistical analysis, an appropriated sample weight was applied to each participant assigned for the design of KNHANES. Continuous variables were expressed as weighted mean±standard error and categorical variables as weighted percentage.
Differences in WC and WHR by sex were compared using a Student t test. Differences in WC and WHR by KNHANES waves were compared using linear regression analysis. Percentile values of WC and WHR were generated according to sex and age. Receiver operating characteristic (ROC) curve analysis was used to identify the optimal threshold of WHR in predicting the cardiometabolic risk factor including abdominal obesity, elevated BP, hyperglycemia, elevated HbA1c, High triglyceride, and low HDL cholesterol. The areas under the ROC curves (AUC) were obtained for each parameter. The point at which the sum of sensitivity and specificity is maximized was defined as optimal cutoff. The sensitivity, specificity, positive predictive value, and negative predictive value at the optimal cutoff were obtained and compared with the values at WHR 0.5 to validate usefulness as universal predictive marker in children and adolescents. P<0.05 was considered to statistically significant.
Results
1. Lack of secular changes of WC and WHR from the 3rd to 6th waves of KNHANES
The WC and WHR trends of mean values according to age in boys and girls were similar between all 4 waves of KNHANES from 2005 to 2015. There were no statistically significant differences in mean WC, except in 17-year-old boys (P=0.032) and 9- and 14-year-old girls (P=0.046 and P=0.025, respectively) (Supplementary Table 2). Mean WHR values for age do not have any significant difference between 4 waves, apart from mean WHR of 17 years old boys (P=0.019) (Supplementary Table 3).
2. Comparison of mean WC with 2007 Korean National Growth Charts
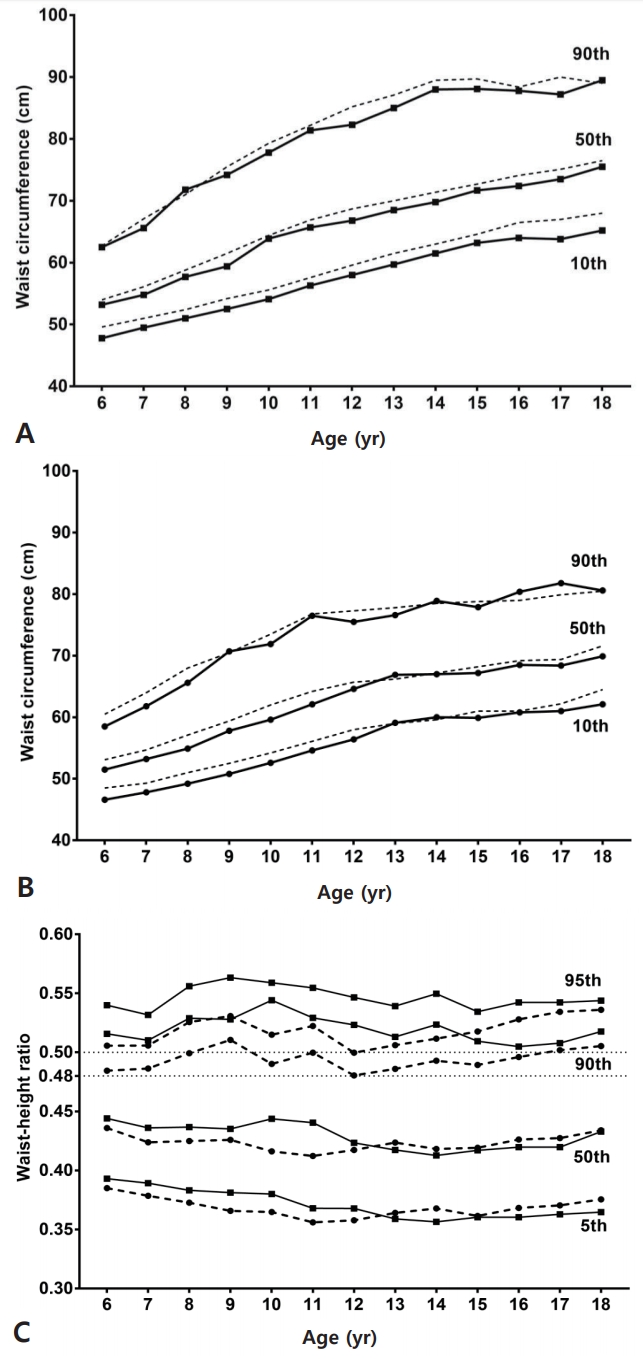
Age- and sex-specific mean values of WC and WHR were obtained (Table 1). Mean WC increased with age in both boys and girls. Mean WC of boys in all ages was significantly higher than of girls and showed a clear difference between sexes (P<0.001) (Table 1). Compared with the 2007 Korean National Growth Charts, the mean WC and percentile for 10th, 50th, and 90th curves of boys enrolled in KNHANES tended to be lower for all ages (Fig. 1). In girls, the percentile curves from KNHANES appear to be lower than the 2007 reference, but the differences seem to be less than in boys. Based on data from the 3rd to 6th KNHANES, we were able to express WC percentile values, as shown in Table 2 for both boys and girls.
3. Distribution of WHR values by sex and age
Mean WHR falls within the range of 0.421–0.451 for each sex and age (Table 1). Mean male WHR was significantly greater than that of females aged 6 to 12 years (P<0.001). In particular, the peak difference is most obvious in boys at the age of 10 years compared with girls (boy, 0.456±0.003 vs. girls, 0.426±0.002; P<0.001). Consequently, the mean WHR decreases steadily from 10 to 14 years in boys and decreases from 9 to 12 years in girls. However, there was no statistical difference between WHR of boys and girls from 13 to 18 years of age (Table 1, Fig. 1). The percentile values for the age in boys and girls are shown in Table 3.
4. WHR cutoff values
Table 4 present the results of the ROC curve analysis used to determine optimal WHR cutoff values between 13 to 18 years of age for cardiometabolic risk factors, including abdominal obesity, high fasting glucose, high HbA1c, high triglyceride, low HDL cholesterol and elevated BP. The optimal WHR cutoff values capable of predicting all cardiometabolic risk factors were under 0.5 with higher sensitivity and negative predictive values as shown in Table 4. The optimal cutoff value for abdominal obesity was the highest as 0.480 with an AUC of 0.985 (sensitivity, 97.6%; specificity, 91.3%). The optimal WHR cutoff value for high triglyceride was 0.462 with an AUC of 0.735 (sensitivity, 59.0%; specificity, 78.4%). The other optimal WHR cutoff values for cardiometabolic risk factors ranged from 0.442 to 0.462 with AUC from 0.545 to 0.645.
Discussion
This is the first study evaluating change over time in WC and WHR in Korean children and adolescents. Mean of WC and WHR in Korean children and adolescents have been maintained without significant change between 4 waves of KNHANES over 10 years, in contrast to the previously reported trend of increasing obesity and metabolic syndrome in Korea [25]. Mean WC was lower than in the 2007 Korean National Growth Charts. Mean WHR was similar between boys and girls aged 13 years or more. Based on this, the obtained cutoff value to determine abdominal obesity was 0.48, independent of sex, which was lower than 0.5.
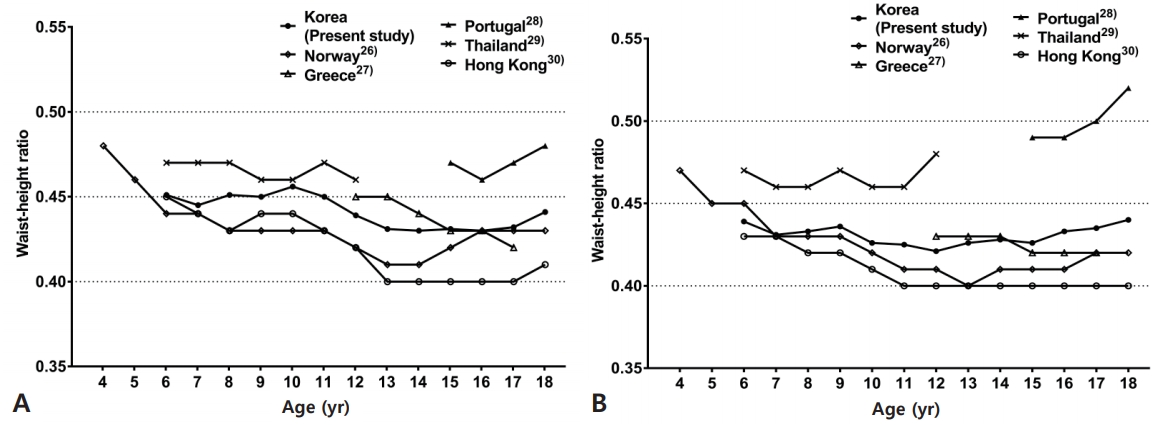
As interest in WC and WHR has increased, a search for reference index measurement representing the populations of specific countries has been conducted worldwide. Fig. 2 compares the mean of previously published worldwide WHR data with the data generated in this study. According to a Norwegian study [26], 6- to 8-year-old girls have longer mean WC than the Korean girls presented in this paper and the mean WC of girls aged 9 years or more were shorter in the Norwegian study. This implies that Norwegian girls have similar or higher mean WHR in age 6–8 year and lower mean WHR in age after 9 years. Compared with Norwegian boys, mean WC and WHR was greater in Korean boys at all ages except for 7 and, 16–18 years. Data from a Greek study of 12- to 17-year-old adolescents [27] showed that mean WC is longer in both sexes aged 12–14 years than in Korean adolescents and similar or shorter in Greek adolescents aged 15–18 years. Mean WHR is higher in Greek boys aged under 14 years, similar in those aged 15, 16, 18 years, and shorter in those aged 17 years. The mean WHR of Greek girls is higher in 12 years old, similar in 13–14 years old, and shorter in 15–18 years old than Korean girls. Mean WC and WHR were greater in Portuguese adolescents aged 15–18 years than in Korean adolescents [28]. Data from Thailand shows 6–12 years old girls have longer mean WC than Korean and Thai boys have similar or shorter WC except at 7 years old. Mean WHR of Thai adolescents were higher than Korean adolescents in all ages [29]. In the report for Hong Kong Chinese children aged 6–18 years, mean WC and WHR were much lower than values shown than Korean children [30]. Except for Portugal, in many countries, the WHR fluctuation does not appear to be largely significant after 13 years for men and after 11 years for women. The WHR pattern of the adolescent period seems to be similar, although there may be national and ethnic differences.
According to the results of this study, WC is lower overall than the reference data obtained from the 2007 Korean National Growth Charts, based on measurements form 1997 and 2005, when obesity in children and adolescents had already increased. The WC and WHR were not included on the 2017 Korean National Growth Chart which was established by using the data before the increase of obesity in consideration of the increase trend of obesity [31]. Therefore, considering the data showed that both mean WC and WHR have remained similar over 10 years, it may be necessary to make a new WC and WHR reference based on the 2017 Korean National Growth Charts.
The differences of WHR between boys and girls before 13 years of age exist through all 4 waves of KNHANES showing a peak at 10 years of age. Similar differences between sexes are seen in the WHR reference made using the previous 2007 growth chart [22]. These differences between sexes could be found in some other countries. In Hong Kong Chinese children, the differences between sexes were similar to those of Korean children, with a peak difference seen at 10–12 years of age [30]. Norwegian adolescents have similar differences to Korean children, and the peak difference is observed at 11 and 16 years of age [26]. WHR from Greek boys aged 12–17 years was higher than from girls [27]. In the study of Portuguese children and adolescents, 15–18 year old girls had higher WHR than boys [28]. WHR data from United Sates and Thailand did not show specific patterns or differences [29,32].
There are 2 opposing positions on the use of a universal cutoff of 0.5 for WHR. In a study by McCarthy and Ashwell, a WHR of 0.5 was proposed (‘Keep your WC to less than half your height’) as a unique cut-off to predict cardiovascular risk in individual of all ages including children [33]. Whereas, Inokuchi et al. [34] recommend age and sex specific reference values and preclude using a universal cutoff of 0.5. In previous studies in Korea, Gil et al. [22] suggested that the optimal WHR for determination of obesity was 0.51 in 6–18 year old boys and 0.48 in girls of the same age. In the study by Choi et al. [19], the optimal WHR cutoff for metabolic syndrome was 0.44 in 10- to 19-year-old boys and 0.43 in girls, which is less than the value of 0.5. These cutoffs are generated taking into account the ethnic and sex-specific features in order to improve accuracy. These studies are partially in line with Ashwell’s proposal to use a universal cutoff. We have also made efforts to find an appropriate cutoff based on the KNHANES data. In this study, the optimal WHR cutoff for abdominal obesity was 0.48 in Korean children and adolescents aged 13–18 years. The other cutoff values for cardiometabolic risk were not useful for practical clinical applications. All cutoff values obtained were lower than 0.5. Comparing with the cutoff value of 0.48 for abdominal obesity, 0.5 as candidate of universal value showed higher specificity in order to reduce false negative results. This data suggests that if WHR of a subject was 0.5 or higher, it would be more likely that the individual has abdominal obesity. However, it is necessary to detect obesity early and managed it efficiently. This is of particular importance, as abdominal obesity is strongly associated with many metabolic abnormalities, therefore, active interventions are required even at a lower WHR cutoff than 0.5.
There are several limitations on this study. First, this was a crosssectional study. Thus, it cannot provide enough evidence of predictive values of WHR for cardiometabolic risk. To compensate for these shortcomings, 4 KNHANES waves over a decade were collected and presented, but due to existing time intervals between waves, these data cannot fully explain the trends seen in children and adolescents during 2005–2015. Future prospective cohort studies are needed for more rigorous evaluations. Second, because the feature of differences between sexes on distribution of WHR, we only could not generate a reference for children between 6 to 18 years old. Additionally, to create optimal WC cutoff values for cardiometabolic risk, different reference values must be applied, depending on sex and age. Therefore, the numbers of subjects for each sex and age should be sufficient, but, present study did not provide enough numbers, and analysis was not conducted. Thus, larger-scale cohort studies should be performed. Finally, onset of puberty that could be associated with obesity and other cardiometabolic disease was not reflected in this study.
In conclusion, WC and WHR in Korean children and adolescents have shown no secular change over the past 10 years. The mean WC values of both sexes from the present study were lower than those from the 2007 Korean National Growth Charts. WHR was higher in boys than in girls but, there is no difference in adolescents over 13 years old. Considering the distribution of WHR by age and sex, the value of 0.48 as an optimal cutoff could be applied for Korean adolescents over 13 years old and be helpful to diagnose abdominal obesity. With regard to the lack of secular change in WC, it might be necessary to make a new WC and WHR reference based on 2017 Korean National Growth Charts.
 PDF Links
 PubReader
 ePub Link
 PubMed
 Download Citation


