


Introduction
Health care research using big data is regarded positively because of its easy access and ripple effect. Big data have been increasingly used to solve a variety of issues difficult to evaluate in basic or clinical research. There are various sources of data for medical research on children and adults in the Republic of Korea, including medical claims data of the Health Insurance Review and Assessment Service, the national health screening program for adults and the National Health Screening Program for Infants and Children (NHSPIC) of the National Health Insurance Service (NHIS) [1], death data of the National Statistical Office [2], cancer patient registration data of the National Cancer Center [3], and the electronic medical records of all hospitals throughout the country.
The NHIS was first established in Korea in 1989, achieving universal coverage after only 12 years and accumulating nationwide healthcare data [1]. The NHIS provides benefits for rehabilitation, births, deaths, and health promotion, and for prevention, diagnosis, and treatment of diseases and injuries. The NHIS also maintains records regarding healthcare utilization, prescriptions, and national health screening programs. The NHIS records are ideal for public health and medical research because they contain data for the whole nation [4]. Although several studies have been published utilizing the health screening and healthcare utilization database of the NHIS for adults [4-6], there are currently no comparable noteworthy studies for infants and children.
The health care database for children began to be established when the NHSPIC were conducted to health insurance subscribers in November 2007 and expanded to all of Korea in January 2008 [7]. The NHSPIC conducts 7 surveys of children, from the age of 4 months to 72 months, and includes a general health questionnaire, developmental screening, assessment of oral health, a physical examination, an anthropometric examination, and anticipatory guidance. Growth, development, and death are important health concern of children around the world. In particular, the NHSPIC makes it easy to determine the nutritional status at infancy, since nutritional information of the screening program includes breastfeeding and complementary feeding, reported to be relevant with growth [8,9], development [10,11] and clinical diseases [12,13] at childhood. Also, it is useful for analyzing the impact of infantile disease outcomes [14], nutritional status [15], and safety education [16,17].
This report describes the establishment of the National Investigation of birth Cohort in Korea study 2008 (NICKs-2008), a large-scale birth cohort study utilizing data from the NHSPIC, the most extensive database on health care in children in Korea, and from the NHIS, a database on the use of medical resources throughout the country. The purpose of this study was to provide basic data, including demographic data, arthrometric index, nutritional intake status, and developmental status for future research by integrating 2 large databases.
Methods
1. Cohort design and participants
The NICKs-2008 acquired data on the use of medical resources from the NHIS and data from the NHSPIC. The NICKs-2008 cohort consists of Korean children born in 2008 (n=469,248) and 2009 (n=448,459) who were followed up through 2017. The use of de-identified individual data for research purposes received ethical clearance under the current National Health Insurance Act. All participants of the cohort are still being tracked, provided they are still eligible for health insurance. Data from 2017 were collected and investigated in the present study. Personal information, including insurance copayment (which is based on income) and residential area were tracked in the eligibility database each year. The Public Information Sharing System, National Tax Service, and Ministry of Health and Welfare of Korea collected eligibility information, and these records are managed by the NHIS. Healthcare utilization information at all visits (inpatient, outpatient, and pharmacy visits) is monitored annually by the NHIS. Data for the cohort will be continuously updated by the NHIS. The protocol of this study was reviewed and approved by the Institutional Review Board of the Korea National Institute for Bioethics Policy (P01-201603-21-005).
2. National Health Screening Program for Infants and Children
The NHIS provides 7 NHSPIC screening surveys to all citizens from the age of 4 months to 71 months (first, age 4ŌĆō6 months; second, age 9ŌĆō12 months; third, age 18ŌĆō24 months; fourth, age 30ŌĆō36 months; fifth, 42ŌĆō48 months; sixth, 54ŌĆō60 months; seventh, age 66ŌĆō71 months). The NHSPIC survey includes a general health questionnaire, developmental screening, oral health questionnaire, oral exam and guidance, anthropometric exam, physical examination, and anticipatory guidance (Table 1). The parents also provided basic information such as birth date, birth weight, and prematurity status. The general health questionnaire was completed for all 7 surveys and included subcategories of safety, accident prevention, nutrition, vision, and hearing. The other subcategories were oral health guidance (second screening), toilet training (third screening), emotion (fourth screening), hygiene (fifth screening), preschool education (sixth screening), and passive smoking and infection (seventh screening). The subcategory of nutrition collected data about breastfeeding and complementary feeding based on answers to the following questions: ŌĆ£What did you feed your child mainly?ŌĆØ (with possible answers of breast milk, formula, or both); ŌĆ£What kind of water did you use for formula milk?ŌĆØ (with possible answers of tap water, bottled water, purified water, or barley tea); ŌĆ£When did you start complementary feeding?ŌĆØ (with possible answers of before 4 months, 4ŌĆō6 months, 7 months or later, or not yet started); and ŌĆ£How many times a day did your baby receive complementary feeding?ŌĆØ (with possible answers of 1, 2, 3, or 4 or more).
The developmental screening test is the major screening item of the NHSPIC, and was administered at the second through seventh screenings (Table 1) [18]. From 2008 to 2013, the developmental screening tool was the Korean-Ages and Stages Questionnaire (K-ASQ) or the Denver II. However, because the Denver II must be administered by a trained examiner and takes more time, the K-ASQ was recommended [19]. In 2014, the Korean Developmental Screening Test for Infants and children (K-DST), with results recorded by parents, was developed for preschool children (4ŌĆō71 months). The K-ASQ has 5 domains (communication, gross motor skills, fine motor skills, problemsolving, and personal-social interrelation) and the K-DST has 6 domains (gross motor skills, fine motor skills, cognition, language, sociality, and self-care). In addition, the K-ASQ interprets the results at 3 different levels (appropriate, need for follow-up, and recommendation for further evaluation) [19], and the K-DST interprets the results at 4 levels (advanced development, age-appropriate, need for follow-up, and recommendation for further evaluation) [18]. Parents of children with an evaluation of ŌĆ£need for follow-upŌĆØ may be encouraged to promote development of their children in that specific area prior to the next assessment, conduct a retest, or undergo further evaluation if interviews suggest a problem. An evaluation of ŌĆ£recommendation for further evaluationŌĆØ means that developmental delay is not confirmed, but careful examination is required. When a child is classified as having a developmental delay based on further evaluation (ŌĆ£recommendation for further evaluationŌĆØ), it was considered as a ŌĆ£need for consistent management.ŌĆØ
Anthropometric indices (weight, height, body mass index [BMI], and head circumference) were collected from physical measurements during each screening. Height was measured with the child in comfortable clothing while standing upright (for those over 2 years of age) or supine (for those less than 2 years of age) and recorded to the nearest 0.1 cm. If a child aged 2 years or older was measured while supine, 0.7 cm was subtracted from the measured value for calculation of BMI. An electronic scale was used to measure weight while children were dressed in simple clothes and was recorded to the nearest 100 g. The head circumference was measured using a rigid tape with a width of 0.7 cm. Measurements were performed by turning the head horizontally around the upper part of the left ear and the protruding part of the forehead while gently pressing the hair. The standardized scores (z scores) for height, weight, BMI, and head circumference in male and female children of different ages were obtained using the LMS (Lambda for the skew, Mu for the median, and Sigma for the generalized coefficient of variation) method with the 2017 Korean National Growth Charts for those 2 years or older [20,21], and using the World Health Organization (WHO) growth standards for infants and young children for those under 2 years of age [22].
3. National health insurance system database
The major variables of the NICKs-2008 cohort (Table 2) were from the NHIS database. The NHIS provides a public database of healthcare utilization, socio-demographic variables, and results from the NHSPIC. Healthcare utilization data are collected when an individual receives healthcare services and included on all inpatient and outpatient medical records. These data include International Classification of Diseases-10 (ICD-10) code, length of stay, treatment costs, services received, and prescription records (drug classification code, day prescribed) [18]. Economic status was classified by quintiles and was determined by the amount of insurance copayment (1, poorest quintile; 5, richest quintile). The residential status of the children was defined as ŌĆ£urbanŌĆØ if they resided in Busan, Daegu, Incheon, Gwangju, Daejeon, and Ulsan, and otherwise as ŌĆ£rural.ŌĆØ The healthcare provider database contains information about the types of healthcare institutions, healthcare human resources, and equipment that was used.
4. Statistical analysis
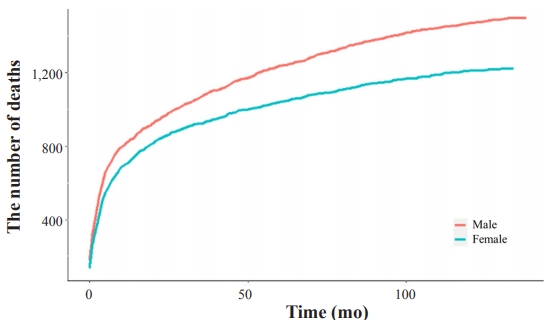
Absolute numbers with frequencies and means with standard deviations were used to express quantities and qualitative results. The Kaplan-Meier method was used to show the cumulative number of deaths by sex. In addition, we examined the association between the risk for death of children and economic status using the Cox proportional hazards model. All statistical analyses were performed using SAS 9.4 (SAS Institute Inc., Cary, NC, USA).
Results
1. Demographic characteristics
Basic demographic characteristics were shown in Table 3. A total of 51.5% of the children born in each year were boys. There were only minor differences in birth weight (3.19 kg vs. 3.18 kg) and prematurity (5.5% vs. 5.6%) for the 2 years. A total of 823 infants (0.1%) who weighed less than 1,000 g were born in 2008 and 2009 together. At birth, 3,177 infants (0.38%) weighed 1,000 to 1,500 g and 37,166 infants (4.39%) weighed 1,500 to 2,500 g. Most children were born in urban areas (2008, 35.6%; 2009, 39.9%) and most were also born in Seoul (2008, 31.5%; 2009, 19.3%). Mortality rates were 0.3% in 2008 and 0.28% in 2009. Most deaths (55.13%) occurred within the first 12 months, including 30.97% within the first 3 months. In addition, the risk of death was greater in males than females (hazard ratio [HR], 1.145; 95% confidence interval [CI], 1.061ŌĆō1.235; P=0.0005) (Fig. 1). Notably, relative to the richest economic quintile, the HR for death was significantly greater in the poorest quintile (HR, 1.233; 95% CI, 1.051ŌĆō1.447; P=0.01) and the second poorest quintile (HR, 1.402; 95% CI, 1.229ŌĆō1.599; P<0.001) (Fig. 2).
2. National Health Screening Program for Infants and Children
A total of 848,048 children (92.43%) participated in one or more of the 7 rounds of NHSPIC (Table 4). The highest participation rate was in the 4th session for children born in 2008 (n=256,085, 54.57%) and in the 5th session for children born in 2009 (n=280,319, 62.51%). In addition, 40,360 children born in 2008 and 55,686 children born in 2009 participated in all 7 screening programs.
We examined the z scores for height, weight, BMI, and head circumference at each of the screening sessions (Table 5). Children with height z scores of 1.63 or more were significantly more common in the first screening (22.79%) and the second screening (10.31%), followed by a slight decrease from the third screening (7.15%) to the fifth screening (5.0%), and slight increases at the sixth screening (6.3%) and seventh screening (8.43%). The z scores for weight and head circumference had trends similar to those for height.
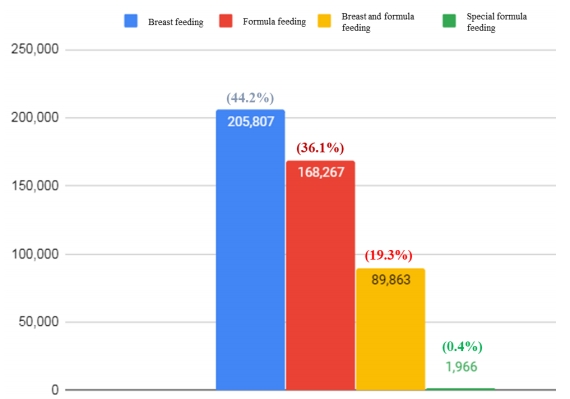
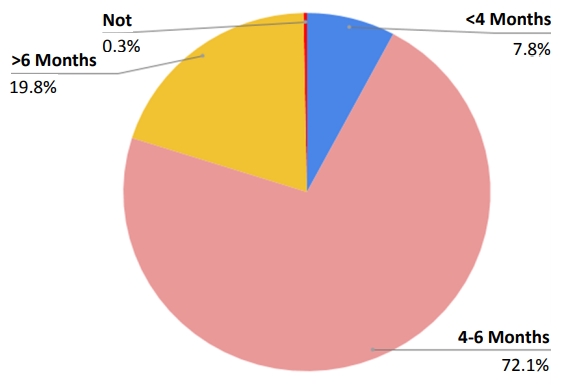
3. NHSPIC - The type of feeding and the time of the introduction of complementary feeding
The general health questionnaire of the NHSPIC collects data on breastfeeding and complementary feeding. A total of 44.2% of children received breastfeeding, 36.1% received formula, 19.3% received breastfeeding and formula, and 0.4% received a special formula (Fig. 3). Analysis of the timing of the introduction of complementary feeding (Fig. 4) indicated that most of children (72.1%) began complementary feeding within 4 to 6 months, 7.8% started before 4 months, 19.8% started after 6 months, and 0.3% started after 12 months.
4. NHSPIC - Developmental screening test
Our analysis of the results from the developmental screening test (Table 6) indicated the highest percentage of children who needed follow-up was at the first screening (4.1%), and the need for follow-up in the other screenings ranged from 1.2% (sixth screening) to 3.3% (seventh screening). The percentage of children with appropriate development ranged from 95.1% (first screening) to 97.8% (sixth screening). About 1% of the children received recommendations for further evaluation during each screening, and 0.1 to 0.4% of children were recommended for consistent management.
Discussion
The NICKs-2008 is a study of a nationwide birth cohort for infants and children based on 2 large national administrative databases. These basic data serve as a foundation for future analyses of this cohort. The present study describes the demographic characteristic information, nutritional patterns and the results of developmental screening of children in this birth cohort.
Our demographic results showed that the number of children born annually in Korea has decreased significantly from 636,780 born in 2000 to 469,248 and 448,459 born in 2008 and 2009, respectively [23]. Recent improvements in neonatal care have led to an increase in the percentage of low birth weight infants (<2,500 g), from 3.79% born in 2000 to 4.86% and 4.87% born in 2008 and 2009, respectively [23]. Consistent with results showing that child mortality rates are affected by the socioeconomic and educational statuses of parents [24], our study showed that the risk of death was higher in the poorest than in the richest economic quintile.
Growth is one of the most important health concerns at childhood. In particular, obesity is a common chronic inflammatory disease linked with metabolic diseases. Moreover, the increasing prevalence of obesity in children and the relationship between childhood and adult obesity indicate the importance of determining the prevalence of and risk factors for obesity in children [25]. We found that the prevalence of obesity, defined as a BMI z score >1.63 [26], was 7.85% at 6 years of age (NHSPIC seventh session) and increased from 3 to 6 years of age. The NICKs-2008 provides a useful database to analyze factors associated with the risk of childhood obesity. In contrast, the proportion of children with z scores >1.63 in height for age, weight for age, and head circumference for age decreased sharply between the second and third sessions. The finding about more elevated z scores in the first and second screenings is possibly due to the discrepancies between the z scores obtained from the WHO growth standards for infants and the actual growth of Korean children under 2 years of age [22]. We believe that future studies are needed to assess utility of this growth chart for assessments of the growth of Korean infants in this age range.
Nutrition has an important effect on growth and development in children [27]. Breastfeeding has many advantages, including reductions of respiratory infections, gastrointestinal infections, allergic disease, diabetes, obesity, and neurodevelopment disorders [28]. In addition, the early or late introduction of complementary feeding has been reported to be associated with growth in children, including rates of overweight and obesity [29-31]. The NHSPIC can provide easy access to national data about the type of feeding and the timing of the introduction of complementary feeding in infancy. By integrating these data with data from the NHSPIC and NHIS claim data, it may be possible to analyze the relationships of breastfeeding and the timing of the introduction of complementary feeding with various subsequent health problems.
There are several important differences between the NICKs-2008 database and other databases used to date for pediatric research. Table 7 summarizes the data resources that have been widely used for pediatric research in Korea. The Korean National Health and Nutrition Examination Survey database includes the results of blood tests, urinalysis and anthropometric measurements, but these studies were of cross-sectional design and included relatively few children and adolescents [32]. The Korean Youth Risk Behavior survey included a relatively large sized sample, but it was also of cross-sectional design and all survey results were obtained online [33,34]. The Panel study on Korean children was a prospective, longitudinal, follow-up cohort study. However, the sample size was relatively small and it included limited information about disease and healthcare utilization, as it utilized interviews and questionnaires to obtain results [35]. The National Health Insurance Service-national sample cohort had a wider database than the NICKs-2008, including blood test results and medications. However, since it is a representative 2% sample cohort, the sample size for each age group was relatively small due to the age-specific characteristics of children [4].
In contrast, the NICKs-2008 had several advantages, as it included all Korean children born in 2008 and 2009. The low attrition rate over a period of more than 10 years was likely due to the rigorous procedures used to collect nationwide data. A second advantage was that 92% of children completed the questionnaire survey and underwent physical examination, anthropometric examination, and developmental screening tests. Thus, these data can be reliably used to study the relationship of personal exposure to multiple factors with physical growth and developmental delay. A third advantage was that the data from the NHIS contained extensive information on healthcare utilization. Integration with the national health screening data makes it possible to analyze disease onset prior to hospitalization based on information such as lifestyle, eating habits, and exposure to risk factors.
However, the NICKs-2008 cohort also has certain limitations. Only limited information is available regarding health-related behaviors, because those data were from reports by parents at the nationwide health screenings. In addition, because recorded information is used for the Korean fee-for-service payment and reimbursement system, the ICD diagnosis code might not accurately reflect a patientŌĆÖs true health status. Also, in contrast to adults, there is a paucity of blood data for children and adolescents.
The NHSPIC was initially implemented in 2007, but the participation rate remained low over the next 6 years, during which the participation rate per session was only about 50%. Also, the NHSPIC does not include assessments of allergic disorders, which are common in children and of concern to their parents. The importance and validity of the NHSPIC should be communicated to the public and the shortcomings of the NHSPIC should be corrected to increase participation rates.
In conclusion, by integrating NHIS data with national health screening data, the NICKs-2008 could enable analysis of disease onset prior to hospitalization based on information such as lifestyle, eating habits, and exposure to risk factors. These findings may encourage the establishment of additional administrative cohorts for infants and children.

 PDF Links
 PubReader
 ePub Link
 PubMed
 Download Citation


