


Introduction
Immune thrombocytopenia (ITP) is an acquired thrombocytopenia that raises the risk of bleeding. Kohli et al. [1] define it as an isolated peripheral low platelet count of fewer than 100├Ś109/L with no clear secondary etiology. It may have no symptoms or manifest with varied degrees of bleeding, ranging from diffuse skin purpura to severe mucosal or internal bleeding [2]. Its pathophysiology is mostly linked to platelet destruction and impaired bone marrow platelet production [3,4].
ITP is an immune-mediated disease induced by autoantibodies against glycoproteins (GPs) IIb/IIIa and GPIb/IX found in platelet membranes [5]. B lymphocytes of the ill person generate antiplatelet antibodies, whereas T cells play a crucial part in etiopathogenesis [6]. The generation of autoantibodies by B cells, numerous dysfunctions in cellular immunity, and cytokine dysregulation are thought to play essential roles in the pathogenesis of ITP [7].
According to Cai et al. [8], cytokines have a significant role in controlling the balance between T helper 1 (Th1) and T helper 2 (Th2) cells. Th1 and Th2 imbalances in ITP lead to autoreactive B-cell differentiation; glucocorticoid therapy can assist in reestablishing Th1 and Th2 levels [9]. A proinflammatory response, including the production of autoreactive antibodies and increased levels of IL-2 and interferon-╬│, is triggered by the activation of CD4+ T cells [10].
On chromosome 2q14 are IL-1B and IL-1 receptor (IL-1R) antagonists. Macrophages produce the proinflammatory cytokine IL-1 beta during systemic inflammatory responses. 11) By increasing cytokines including IL-6 and IL-12, it regulates immune and inflammatory responses [12].
Three related genes make up the IL-1 family: IL-1A, IL1B, and IL-1Ra. Each of these genes functions differently in autoimmune diseases and ITPs [12]. An enhanced cytokine response brought on by cytokine network disruption is another documented aspect of ITP pathophysiology. ITP etiopathogenesis has been linked to genetic variations in cytokine genes. Additionally, aberrant T cell and cytokine function are linked to most autoimmune illnesses, including ITP, and play a crucial role in the development of the disease. Cytokines are linked to ITP's severity and chronicity in addition to its etiogenesis [6].
The etiology of ITP is influenced by polymorphisms in genes that encode cytokines, including IL-1, IL-4, human leukocyte antigen, tumor necrosis factors, and IL-10 [13]. Members of the IL-1 cytokine family,IL-1A,IL-1Ra, and IL-1B, are crucial to the pathogenesis of ITP [14]. Thus, this study investigated the association between the susceptibility and severity of primary ITP in children and the IL-1B and IL-1R antagonist gene polymorphisms.
Methods
The Hematology and Oncology Unit, Pediatric Department, Menoufia University Hospitals conducted comparative case-control research. Our research was conducted in partnership with the Biochemistry and Molecular Biology Department, Faculty of Medicine, Menoufia University, from August 2022 to September 2023. The children studied were divided into 2 groups: the patients' group, which consisted of 50 ITP cases (28 boys and 22 females) who got inpatient treatment and outpatient clinic follow-up. Their ages ranged from 1 year to 18 years, with a median age of 8 years. The control group consisted of 50 healthy children of similar ages and genders with no history of medical difficulties.
1. Ethical consideration
The study was authorized by the faculty ethical committee, and signed informed consent was supplied by each patient's legal guardian. Under Institutional Review Board clearance number 2/20222 PEDI59, the Menoufia University Faculty of Medicine's ethical scientific committee approved the study plan.
2. Inclusion criteria
Children diagnosed with primary ITP ranged in age from 1 year to 18 years old and were treated according to our pediatric hematology unit protocol.
Primary ITP was described as an isolated case of thrombocytopenia without bone marrow abnormalities and in the absence of other thrombocytopenia-causing factors. A platelet counts of less than 100,000/╬╝L was deemed abnormal [15].
3. Exclusion criteria
Children with other autoimmune or chronic diseases, thrombocytopenia caused by other conditions (e.g., leukemia, Fanconi syndrome), and patients who had undergone ITP-specific medication before hospitalization.
4. All enrolled children were subjected to the following points of evaluation
Careful history taking focusing on personal history including name, age, andsex,history ofdisease illness including time, onset, course, and duration, bleeding site and grade, association with fever, arthralgia, arthritis, weight loss, and bone ache, medication, history of previous bleeding, previous surgery, febrile illness and contact with coronavirus disease 2019 patients, history of drug intake and transfusion of blood products or hospital admission, family history of similar condition.
Thorough clinical examination with emphasis on general condition, including appearance, facies, mucosal membrane and limbs, bleeding symptoms, and severity of bleeding; grading was performed by Buchanan et al. [16]. Skin examination for purpura and ecchymosis, or color changes such as pallor, jaundice, and cyanosis; lymph node inspection for site, size, shape, and consistency; abdominal examination for hepatosplenomegaly and masses; and systemic examination for any abnormalities. Hematological investigations were performed on all patients at the time of presentation, after 7 days, and 1 month, as well as once for the control group that enrolled in the trial, including a complete blood count using automated Sysmex XN-1000 hematology analyzer (Sysmex America, Inc. Sysmex America, Lincolnshire, IL, USA) and inspection of the peripheral blood smear, platelet indices (mean platelet volume [MPV], platelet distribution width [PDW], and plateletcrit [PCT]). Platelet distribution curves were used to generate platelet indices, which were then acquired by automated hematology analyzers and reported alongside the platelet count.
A measure of platelet size, function, and activation is MPV, or MPV. 7.2ŌĆō11.7 fL is the typical mean cell volume [17]. PDW, which varies with platelet activation and captures the heterogeneity in platelet shape, is a direct indicator of platelet size variability. PDW typically ranges from 9.4% to 16.0% [18]. PCT is a percentage that represents the volume that platelets occupy in blood. It is computed using the following formula: PCT=platelet count├ŚMPV/10,000. PCT typically ranges between 0.11 to 0.29% [19].
5. Molecular genetic study
Real-time polymerase chain reaction was used to detect rs16944 of the IL1B single nucleotide polymorphism (SNP), which included genotyping for the SNP. Genomic DNA was extracted from all frozen whole blood samples using Quick-g DNA TM Miniprep Kit, USA (catalog No. D3024).
1) Principles
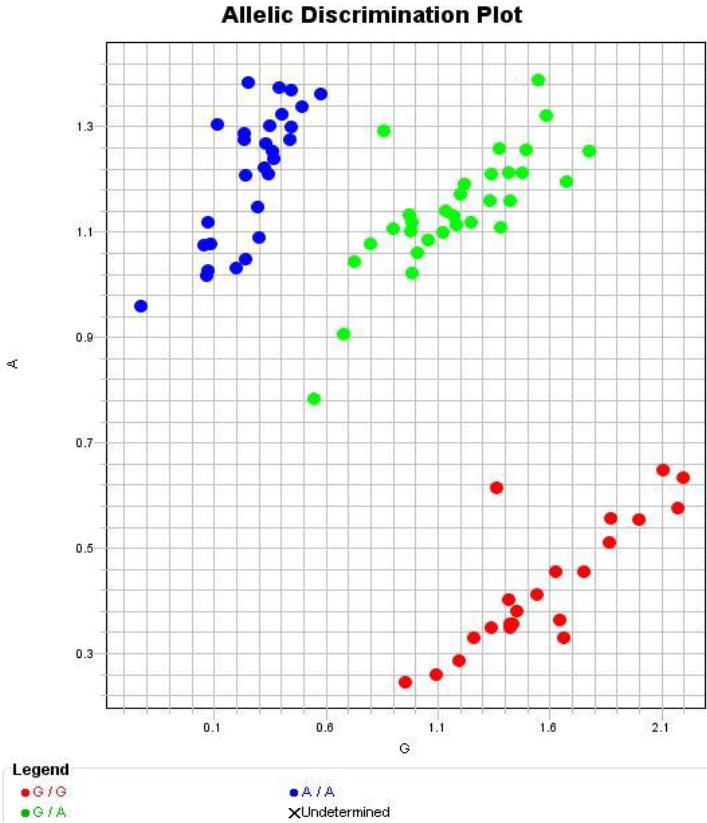
The allelic discrimination assay genotypes the 2 possible variants at a SNP site in a target template sequence using 2 primer/probe pairs in each reaction. There is no set target sequence quantity. Unknown samples are split into 2 groups using the allelic discrimination assay: homozygous (samples containing only one allele, or allele), and heterozygous (samples containing both alleles 1 and 2). IL1Ra 86bp detection by employing variable time number repeats.
Blue dots represent the wild genotype (AA), red spots represent the mutant genotype (GG), and green dots represent the heterozygous genotype (AG) (Fig. 1). Furthermore, Fig. 2 displayed the following from left to right: lane 1: DNA ladder (100 bp), lane 2: negative control, and lane 3ŌĆō10: patients' DNA sample products. In terms of interpretation, lanes 6, 7, 8 showed one band at 410 bp indicating wild (I/I) genotype, lane 10 showed one band at 240 bp indicating mutant (II/II) genotype, and lanes 3, 4, 5, 9 showed 2 bands at 410 bp and 240 bp suggesting heterozygous (I/II) genotype (Fig. 2).
6. Statistical analysis
With IBM SPSS Statistics ver. 22.0 (IBM Co., Armonk, NY, USA), the collected data was processed, tabulated, and statistically examined. The Shapiro-Wilk test was used to normalize quantitative data, which was then expressed as mean┬▒standard deviation and compared using the analysis of variance test. Fisher exact test for variables with minuscule, expected quantities and the chi-square test for numerical and percentage qualitative data were used for comparison. A statistical significance test called the Mann-Whitney test is used to compare 2 groups that have independent nonparametric data and quantitative factors. The Kruskal-Wallis test is utilized to compare more than 2 groups when employing independent nonparametric data and quantitative variables.In comparison to the odds of the event occurring in the absence of that exposure, the odds ratio shows the odds that an outcome will occur given a specific exposure. P values less than 0.05 were considered significant, while values more than that threshold were considered nonsignificant.
Results
Fig. 3 depicts a flowchart representing the study population. Of the 118 children, 18 were excluded from the study (7 patients declined consent and 11 patients did not meet the inclusion criteria), leaving 100 children who were divided into 2 groups: 50 children with ITP who received treatment at Menoufia University Hospital and outpatient clinic follow-up, and 50 healthy children of similar age and gender who served as controls (Fig. 3).
In this investigation, there was no significant difference in age, sex, or residence between the case and control groups (Table 1). Furthermore, skin bleeding (100% of instances) was the most common, followed by oral bleeding (92%), with epistaxis accounting for just 8%. The clinical grade of overall bleeding was moderate degree (grade 3) in most of the cases (92%). Also, mild grades range from 0ŌĆō2 was (4%), while moderate to severe grades range from 3ŌĆō4 (96%) (Fig. 4).
Also, the mutant homozygous GG genotype and mutant G allele of rs16944 of the IL1B gene were substantially greater in patients compared to controls (P<0.001) (Table 2). Furthermore, children carrying the mutant homozygous GG and heterozygous AG genotypes had a significantly increased risk of developing ITP (OR, 11.52 and 5.4, respectively). In addition, ITP sufferers are 4.6 times more likely than controls to carry the mutant gene (Table 3). Furthermore, the mutant homozygous II/II genotype and heterozygous I/II genotype of the IL-1R antagonist gene were considerably greater in cases compared to the control group. The mutant II allele was more significant in patients than controls (P<0.001) (Table 4).
Heterozygous form I/II genotypes have a significantly increased risk of developing ITP (OR, 25.43 and 13), respectively. ITP cases are also about 6.3 times more likely to carry mutant alleles than healthy children (Table 5). Furthermore, ITP cases with overall moderate to severe (grade 3ŌĆō4) bleeding were significantly associated with an increase in heterozygous AG (22/50) and mutant homozygous GG (18/50) genotypes compared to cases carrying wild-type homozygous AA genotypes (8/50). All cases with epistaxis (grade 1ŌĆō4) carried the mutant homozygous (GG) genotype of rs16944 of the IL1B genotype. There was no significant difference among the other parameters (Table 6). Furthermore, ITP patients with epistaxis (grade 1ŌĆō4) are substantially related to an increase in the mutant homozygous (II/II) genotype of the IL-1R antagonist gene. There was no significant difference among the other parameters (Table 7).
Furthermore, using univariate logistic analysis, we discovered that platelet count after 7 days and platelet count at presentation were significant protective factors affecting ITP development (OR, 0.25, 0.95, and 0.79, respectively), whereas mutant genotypes of IL1B and IL-1R antagonist appeared to be risk factors for ITP development (OR, 7.11 and 14.94). Using multivariate logistic analysis, only platelet count after 7 days was determined to be the most significant predictor of ITP (P=0.001, OR, 0.962) (Table 8).
Discussion
Bound to platelets and megakaryocytes, IgG autoantibodies cause ITP by targeting surface antigens such as GP ╬▒IIb╬▓3 (GPIIbIIIA) and GPIb-IX-V [20,21]. There is growing evidence that the pathophysiology of this disease involves faulty regulatory T cells (Tregs), imbalances in helper T cells, abnormalities in megakaryocyte maturation, inappropriate T-cell anergy, and cytotoxic T cells [22,23].
Cytokine gene polymorphisms in Egyptian ITP patients have not been extensively studied. Thus, we looked at cytokine gene polymorphisms and their relationship to ITP susceptibility and disease severity in the current study. We found that, with 56% of respondents being male and 44% being female, there was no discernible sex preference. However, Elalfy et al. [24] discovered no gender preference in acute ITP, although chronic ITP was more common in females. Also, Ahmed and Younies [25] discovered that males and females were equally affected. Tantawy et al. [26] discovered that out of the 40 patients, 17 were males and 23 were females. Moreover, Libert et al. [27] concluded that chronic ITP was more frequent in females as they are exposed to autoimmune disorders more than males but in children ITP is equal in both sexes.
The current study found that skin bleeding (100% of instances) was the most common, followed by oral bleeding (92%),with epistaxis accounting for just 8%.In most patients (92%), the total clinical grade of bleeding was moderate. These findings are consistent with those described by Zahran and Alam et al. [28], who found cutaneous symptoms in all 40 patients with acute ITP, including petechial bleeding and mild bruises. Only 9 patients suffered from mild epistaxis. Alam [29] discovered bruising in 85.3%, petechial rash in 79%, and epistaxis in24%.Neunert et al. [30] also found the intercontinental cooperative ITP Study Group examined the therapy of children with persistent and chronic ITP and found no incidences of cerebral hemorrhage. Following diagnosis and at 28 days, 6 months, 12 months, and 24 months, 1,345 participants were gathered. Skin bleeding was the most common site of bleeding,followed by epistaxis. These findings contradict Sabhan et al. [31], who found that epistaxis was present in 87% of newly diagnosed ITP patients.
Regarding the rs16944 IL-1B polymorphism, the results of this study suggest a link between the mutant homozygous (GG) and heterozygous (AG) genotypes of rs16944 IL-1B and susceptibility to ITP. Furthermore, offspring carrying the changed G allele had a 4.6-fold increased sensitivity to ITP. Yadav et al. [12] found a in primary ITP, there is a substantial correlation between the homozygous mutant genotype of IL-1B31 and severe ITP as compared to healthy controls (OR, 2.76; 95% CI, 1.076ŌĆō7.10). Moreover, a significant probability of severe ITP was linked to the IL-B-31 mutant allele (OR, 1.64; 95% CI, 1.046ŌĆō2.58), while neither severe nor non-severe ITP was linked to the IL-1B-511 genotype.
In this study, not only did individuals with the modified IL-1B polymorphism allele exhibit heightened vulnerability to ITP, but they also exhibited a more severe variant of the illness, where ITP cases presented with overall moderate to severe bleeding are significantly associated with an increase of mutant allele-containing genotypes: heterozygous AG (22/50) and homozygous GG (18/50) genotypes compared with cases carrying wild homozygous AA (8/50), also, all cases presented with epistaxis carried the mutant homozygous (GG) genotype of rs16944 of IL1B genotype. This indicates that the altered allele may affect the gene expression and/or alter the protein function resulting in more severe disease.
In terms of IL-1R antagonist, we discovered a substantial increase in mutant allele-containing genotype, heterozygous (I/II), and mutant homozygous (II/II) genotype variations ofthe IL-1R antagonist polymorphism in cases compared to the control group. Furthermore, the mutant II allele of the IL-1R antagonist polymorphism was considerably higher in patients compared to controls. Furthermore, ITP sufferers are around 6.3 times more likely to possess the mutant gene than healthy children. A previous Egyptian study by AlTawil et al. [11] found that interleukin-1 receptor antagonist gene polymorphisms in children and adolescents with primary ITP were associated with disease susceptibility, response to therapy, and outcome, with patients having significantly higher frequencies of the mutant allele and genotype than controls.
Moreover, our results agree with a previous study [32,33] that linked an IL-1R antagonist polymorphism to ITP. Additionally, a case-control study on both IL1B (IL-1B-511, IL-1B-31) and IL1RA polymorphisms was carried out by El Amawy and Shahin [34], which showed a significant correlation between ITP and the genotype distributions or alleles of IL-1B-31, IL-1Ra, and IL-1B-511, as well as the fact that mutant genotypes of IL-1B-31, IL-1B-511, and IL-1R carry a significant risk for ITP by (18.62, 3.5, and 5.76 folds, respectively). On the other hand, Elsaadany et al. [35] looked at how genetic variants in IL-1B affected Egyptian children's development of primary ITP.
The study's drawbacks were a single center design, a very limited sample size for polymorphism analysis, and the exploration of just 2 polymorphisms due to the high cost of the research.
In conclusion, the current investigation suggests that polymorphisms in the IL-1B and IL-1R antagonists may play a major role in the pathophysiology of ITP. Additionally, there is a correlation between the severity and susceptibility of primary ITP in children and polymorphisms in the genes encoding the IL-1B and IL-1R antagonist.


 PDF Links
 PubReader
 ePub Link
 PubMed
 Download Citation


