

Introduction
Over the past several decades, there have been remarkable improvements in the outcomes of pediatric acute lymphoblastic leukemia (ALL) patients, with cure rates achieving greater than 80%1). Nevertheless, significant issues are still to be solved. Relapse accounts for the main cause for treatment failure in the remaining 20% of patients. Other issues involve treatment-related morbidity and mortality due to over-treatment. The principle of a risk-adapted treatment has been at the core of childhood ALL therapy, and has contributed greatly to treatment outcome improvements. Besides conventional risk factors such as gender, age, white blood cell (WBC) count at diagnosis, and molecular cytogenetic aberrations, measurement of submicroscopic levels of residual leukemic blasts, minimal residual disease (MRD), has proven to be a powerful prognostic factor in predicting relapse, refining risk stratification schemes for childhood ALL2-7).
Currently established techniques for MRD monitoring involve multiparametric flow cytometry and polymerase chain reaction (PCR)-based methods8). Flow cytometric assay can detect the leukemic blasts expressing abnormal immunophenotypes, while PCR techniques can be used to detect tumor-specific fusion transcripts or clone-specific immunoglobulin (Ig) and T-cell receptor (TCR) gene rearrangements. Although these methods are sufficiently sensitive, specific, and quantitative, its accessibility is limited under resource-limited settings, because they are expensive, time consuming, and technically demanding9).
More simplified methods for MRD detection during the early period of treatment have been reported to help identify patients at a high risk of relapse10-12). The purpose of our study was to analyze the results of a simplified flow cytometric assay based on aberrant expression of myeloid antigens or expression of CD19/CD10/CD34, and to determine the prognostic significance of MRD detected by flow cytometry during induction chemotherapy in children with ALL.
Materials and methods
1. Patients and treatment
From June 2004 to December 2008, 98 patients were newly diagnosed as having precursor B-ALL at Asan Medical Center (Seoul, Korea). Among the 98 patients, 37 patients whose flow cytometric MRD data were available on day 14 of remission induction therapy were enrolled in the study. Data on demographics, diagnostic immunophenotyping, molecular cytogenetic risk factors, flow cytometric MRD assay, and treatment outcomes were retrospectively reviewed from the pediatric hematology/oncology database and electronic medical records at Asan Medical Center. The study was approved by the Institutional Review Board of the Asan Medical Center.
Patients were treated based on National Cancer Institute (NCI) age/WBC criteria and molecular cytogenetic risk factors. Patients were considered to have standard risk ALL if they were ≥1 and <10 years old with a leukocyte count lower than 50×109/L without molecular cytogenetic risk factors at presentation. Molecular cytogenetic abnormalities of TEL/AML1 rearrangement and hyperdiploidy were considered low risk features. All other patients were considered as having high risk ALL. Patients who had cytogenetic abnormalities of t(9;22), hypodiploidy, or t(4;11) were designated as very high risk patients irrespective of age and WBC count at presentation.
No significant differences were observed between patients who were included (n=37) and not included (n=61) in the present study for median age (P=0.314), age group (P=0.439), gender (P=1.000), WBC count group (P=0.272), NCI risk group (P=0.830) and molecular cytogenetic risk (P=0.951). The 3-year overall survival (OS) and relapse-free survival (RFS) of the patients included in the present study were 88.8%±5.3%, and 84.4%±6.5%, respectively, which was comparable to those of the patients not included in the present study with OS and RFS of 84.5%±4.8% (P=0.822) and 90.6%±4.0%, respectively (P=0.356).
The chemotherapy protocols were based on Children's Cancer Group (CCG)-1881, CCG-1882, and Children's Oncology Group (COG)-AALL0331 protocols. Induction chemotherapy consisted of glucocorticoids, vincristine, and L-asparaginase with intrathecal cytarabine and methotrexate for standard risk patients. For high risk and very high risk patients, induction chemotherapy consisted of glucocorticoids, vincristine, L-asparaginase, with the additional of daunorubicin with intrathecal cytarabine and methotrexate.
Morphological assessments of treatment response were performed on day 7, 14, and 28 with or without flow cytometric MRD assay at the physician's discretion. Flow cytometric MRD assays on day 7 and 28 were excluded from this study. The bone marrow status was graded as M1, M2, and M3 marrow, which were based on the percentages of residual blasts by morphological assessment (less than 5%, 5-25%, and greater than 25%, respectively). Patients were categorized as rapid early responder (RER, M1 marrow on day 7, or M2 or M3 marrow on day 7 and M1 marrow on day 14) and slow early responder (SER, M2 or M3 marrow on day 14 and M1 marrow on day 28) based on morphological response to chemotherapy. SER patients received intensified post-induction chemotherapy. Detailed treatment protocols were described previously13).
2. Flow cytometric MRD assay
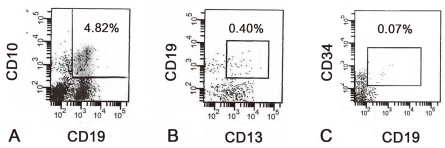
Combination of immunophenotypic markers for MRD detection was based on diagnostic immunophenotyping of leukemic blasts. When leukemic blasts expressed myeloid aberrant markers such as CD13 and/or CD33, 4-color antibody combinations of CD19/CD13/CD34/CD45 or CD19/CD33/CD34/CD45 were used. For patients with blasts which expressed no aberrant antigen on presentation, we determined the percentage of CD19-positive cells expressing CD10 and/or CD34 with combination of CD19/CD10/CD34/CD45. In the bone marrow samples of healthy subjects, expression of CD19 with CD10 and/or CD34 indicates normal B-lymphoid precursors or hematogones14). Since these cells are highly sensitive to glucocorticoids, bone marrow nucleated cells expressing CD19 with CD10 and/or CD34 on day 14 of induction chemotherapy can be considered as leukemic blasts rather than normal hematogones12). In contrast, since it is more likely that expression of CD19/CD10/CD34 represents regenerating hematogones at the end of induction, CD19/CD10/CD34 combination was not used to detect MRD on day 28 in our study.
Four-color flow cytometric analysis was done using peridinin chlorophyll protein (PerCP), allophycocyanin (APC), phycoerythrin (PE) and fluorescein isothiocyanate (FITC) (all from Becton Dickinson Biosciences, San Jose, CA). Cell staining was analyzed with FACScan and Cell Quest software or FACScanto and FACS Diva software (all from Becton Dickinson, San Jose, CA). Mononuclear cells between 1×10⁴ and 1×10⁵ were analyzed in each sample. CD45 blast gating method was used to discriminate leukemic blasts from the cells of various lineages and to facilitate the analysis of leukemic blasts present at low frequencies15). We subsequently divided the 37 patients into 3 MRD groups based on their MRD levels on day 14, which were the group of patients with MRD level of 1% or more, 0.1% to less than 1%, and less than 0.1% (Fig. 1).
3. Statistical analysis
OS was defined as the time between diagnosis and death from any causes. RFS was defined as the time between diagnosis and relapse, censored at date of last time of contact or death in remission. Differences in the distribution of clinicobiological features by MRD level were compared using the χ2 analysis or Fisher's exact test. The probability of OS and RFS was estimated using the Kaplan-Meier method. Univariate analysis was performed using the log-rank test to determine associations between risk factors and RFS. Multivariate analysis of the predictive value of MRD was performed by Cox-regression analysis. P values <0.05 were considered statistically significant. All statistical analyses were performed using SPSS (Statistical Package for the Social Science, version 15.0, SPSS Inc, Chicago, IL).
Results
1. Patient characteristics
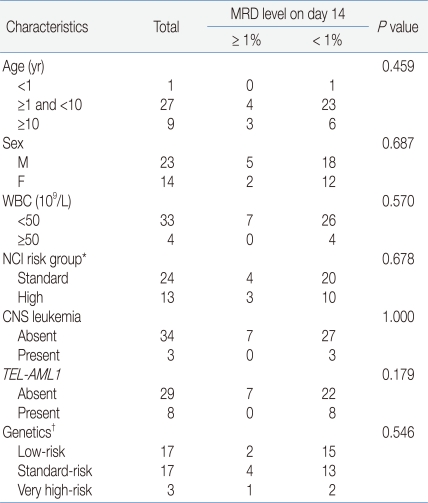
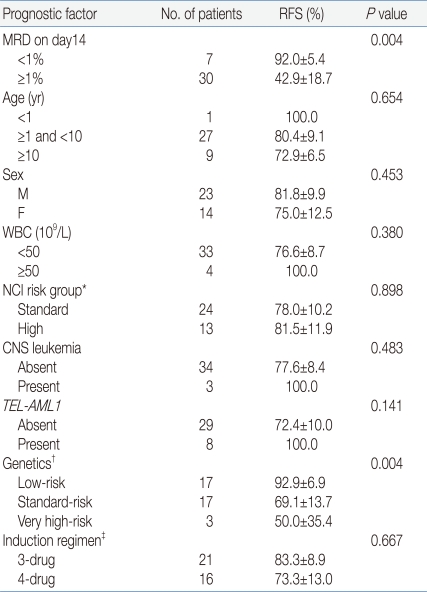
The clinical characteristics of the 37 patients are summarized in Table 1. Median patient age at diagnosis was 5.3 years (range, 0.5 to 15.8 years) and median follow-up duration was 43 months (range, 17 to 70 months). Seventeen patients had low risk molecular cytogenetics (hyperdiploidy in 9 and TEL/AML1 rearrangement in 8) and 3 patients had very high risk cytogenetics (hypodiploidy in 1 and t(9;22) in 2). Based on NCI criteria and molecular cytogenetic risk factors, 21 patients designated as standard-risk were treated with 3-drug induction, while 16 patients designated as high-risk or very high-risk were treated with the 4-drug induction with additional daunorubicin.
2. Prognostic significance of MRD assay
Among the 37 eligible patients, 35 (94.6%) had CD19-positive leukemic cells that also expressed CD10 and/or CD34, and 18 (48.6%) had leukemic cells with aberrant expression of myeloid antigens. Flow cytometric MRD assay was based on aberrant expression of myeloid antigens in the latter 18 patients and expression of CD19/CD10/CD34 combination for the remaining 19 patients. The levels of MRD were ≥1% in 7 patients (18.9%), ≥0.1% and <1% in 18 patients (48.6%) and <0.1% in 12 patients (32.4%) on day 14 of induction chemotherapy.
Table 1 shows the relation between levels of MRD on day 14 and the clinicobiological features of the disease. The presence or absence of residual lymphoblasts with MRD levels of ≥ 1% on day 14 was not significantly related to age, gender, WBC count at diagnosis, leukemic involvement of CNS, NCI risk status, or molecular cytogenetic risk factors. Of note, none of the 8 patients with TEL-AML1 rearrangement at initial diagnosis had MRD of ≥1%, although this failed to reach statistical significance due to small sample size (P=0.179). In addition, fluorescence in situ hybridization (FISH) on day 14 showed no evidence of TEL-AML1 rearrangement in 6 of 8 patients with TEL-AML1 rearrangement at initial diagnosis, which was consistent with the result of flow cytometric MRD assay. FISH data was not available in the remaining 2 patients.
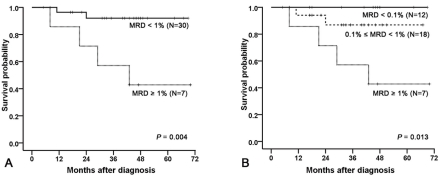
When comparing 2 groups of patients with MRD of ≥1% and of <0.1% on day 14, 7 patients with MRD of ≥1% had a significantly lower RFS than the 30 patients with lower levels of MRD (42.9%±18.7% vs. 92.0%±5.4%, P=0.004). Stratification into 3 MRD groups (≥1%, 0.1-1%, <0.1%) also showed a statistically significant difference in RFS (42.9%±18.7% vs. 86.9%±8.7% vs. 100%, P=0.013). Of note, no patient with MRD of <0.01% on day 14 experienced a leukemic relapse. On the other hand, MRD levels on day 14 appeared to have no significant influence on OS (Fig. 2).
Analysis of a subgroup of 21 patients who were uniformly treated with a 3-drug induction regimen of glucocorticoids, vincristine and L-asparaginase showed that MRD status on day 14 had no significant impact on RFS (66.7%±27.2% for MRD ≥1% vs. 87.2%±8.6% for MRD <1%, P=0.476). Analysis of a subgroup of 16 patients, who were uniformly treated with 4-drug regimen of vincristine, glucocorticoids and L-asparaginase and daunorubicin, showed a lower RFS in patients with MRD of ≥1% compared with those with MRD of <1%. (25%±21.7% vs. 100%, P=0.004). Notably, all relapsed patients who were treated with 4-drug induction regimen had a MRD of ≥1% on day 14.
In a univariate analysis of recognized prognostic factors of RFS, including age, gender, presenting leukocyte counts, CNS leukemia, the presence of molecular cytogenetic abnormalities and MRD status as listed in Table 2, molecular cytogenetic abnormalities and MRD levels on day 14 were identified as significant risk factors. Of note, among 17 patients with low risk cytogenetics, only 1 relapsed patient was documented to have a MRD level of ≥1% on day 14. When MRD status on day 14, molecular cytogenetic risk factors as well as all other clinicobiological parameters listed in Table 2 were evaluated by multivariate analysis, MRD status on day 14 retained borderline significance (OR 5.79, 95% confidence interval, 0.86-39.2, P=0.07).
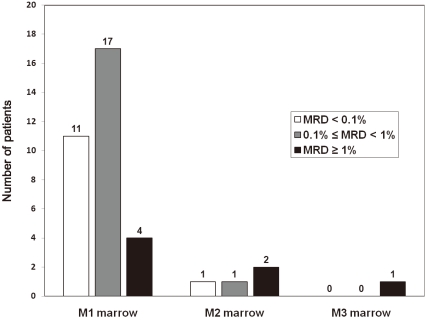
To determine if the flow cytometric MRD assay on day 14 provided additional information to that provided by conventional morphological assessment, we evaluated the concordance between morphological assessment and flow cytometric MRD assay (Fig. 3). Among 32 patients with an M1 marrow on day 14, 11 patients had MRD of <0.1%, 17 had MRD of ≥0.1% and <1%, and 4 had MRD ≥1%. Four patients with MRD of ≥1% had a lower RFS with borderline significance than the 28 patients with MRD of <1% (50.0%±25.0% vs. 91.6%±5.7%, P=0.07). Among 4 patients with an M2 marrow on day 14, 2 patients showed discordance between flow cytometric MRD assay and morphological evaluation, in that the flow cytometric assay showed MRD of <0.1%. Of note, 2 patients with an M2 marrow and MRD of <1% remained in remission after induction chemotherapy without relapse, whereas the other 2 patients with an M2 marrow and MRD of >1% experienced relapse during treatment.
Discussion
Measurement of blast clearance during initial treatment has been consistently shown to be a significant prognostic indicator for childhood ALL therapy8, 16). Complex and sophisticated methods such as PCR-based techniques or multiparametric flow cytometry have been developed and evaluated to detect MRD. Measurement of MRD levels during treatment have been adopted by several cooperative group studies for risk-adapted treatment of childhood ALL.
Our study has demonstrated that MRD levels detected by a simplified flow cytometric assay on day 14 of induction chemotherapy had significant impact on RFS, which confirms the results of previous studies6, 7, 17). Results of Total Therapy studies (XIIIA, XIIIB, XIV, XVA) at St. Jude Children's Research Center have shown that low levels of MRD (0.001% to <0.01%) at the end of remission induction therapy have prognostic significance in childhood ALL6). The large-scale, collaborative prospective study, Associazione Italiana di Ematologia Pediatrica and Berlin-Frankfurt-Műnster (AIEOP-BFM)-ALL 2000 study of childhood ALL included 3,184 children and demonstrated that quantitative assessment of MRD based on Ig and TCR gene rearrangements as PCR targets at 2 time points was highly predictive for relapse in childhood precursor B-ALL7). Of note, complementary measurement of flow cytometric MRD on day 15 bone marrow has been reported to be the most powerful early predictor of relapse in the AIEOP-BFM-ALL 2000 trial, which is consistent with our observation17).
Multivariate analysis suggested that the MRD level on day 14 was an independent prognostic factor with borderline significance (P=0.07). These results did not confirm the superiority of MRD levels over other risk factor probably due to the small sample size. Of note, only one relapsed patient with low-risk genetics had a high level of MRD on day 14. AIEOP-BFM-ALL 2000 trial has shown that PCR-based MRD assessment was superior over conventional risk factors such as WBC at presentation, age, early response to prednisone, and molecular cytogenetic risk factors in discriminating prognosis7). This means that MRD levels can help further stratify the group of patients defined by genetic risk factors such as TEL-AML1 rearrangement, favorable DNA index, or t(9;22) into different prognostic subgroups. Thus, MRD assessment during treatment should be incorporated into the treatment regimen to redefine the traditional risk stratification scheme. This may help better discriminate the patients who require more intensive treatments even when they present with low-risk features, and those who might be treated without allogeneic hematopoietic stem cell transplantation even with very high-risk cytogenetics.
Morphological assessment, albeit useful and applicable at any center, has proven to be subjective, of limited sensitivity and imprecise for the study of early response to treatment18, 19). As shown in our study, 32 patients with M1 marrow on day 14 could be stratified into MRD risk groups based on flow cytometry. It is also noteworthy that 2 patients with M2 marrow had MRD of <1% detected by flow cytometry. Those 2 patients remain in remission without relapse. It is possible that in these cases residual diseases might be overestimated by morphological assessment, although such discrepancy cannot be fully interpreted with the simplified assay alone. These findings suggest that early treatment response cannot be assessed successfully by morphological assessment alone, and MRD detection can be employed for the stratification of patients into early response groups. As well, the prognostic value for day 19 bone marrow status defined by flow cytometry has been reported to be superior to that defined by morphological evaluation20).
The 2 major methods that have been employed for MRD detection and monitoring include PCR-based methodologies which evaluate a leukemia-specific fusion gene or a clone-specific rearrangement of Ig or TCR genes, and quantitative flow cytometry which monitors abnormal immunophenotypic markers present on the cell surface of the leukemic blasts8). However, these methods are expensive, laborious, complex, and require considerable medical resources9, 11, 12). Thus, MRD detection is accessible only in large research hospitals, and usually unavailable in most treatment centers, especially in resource-poor settings such as developing countries or public health insurance setting which controls the use of expensive medical resources.
Our study has suggested the usefulness of the simplified flow cytometric MRD assay, which does not need extensive technical expertise, and requires a small number of antibody reagents which are reasonably affordable. In the present study, CD45 blast gating method was used to efficiently discriminate leukemic blasts form cells of various lineages and to facilitate the analysis of leukemic blasts present at low frequencies15). Subsequent MRD assays were based on either one of the following two combinations of immunophenotypic markers: expression of myeloid aberrant antigens or simultaneous expression of CD19, CD10, and CD34. Detection of aberrant myeloid expression is sensitive and easily accessible with a small number of markers, but has limited applicability because aberrant myeloid antigens are expressed only in some patients. In our study, half of the enrolled patients had leukemic blasts expressing aberrant myeloid antigens. However, actual frequency of aberrant myeloid expression might be lower in the original population, because patients with blasts expressing aberrant myeloid antigens tended to be enrolled in the study more frequently due to easy accessibility to MRD monitoring. CD13 has been reported to be expressed in 10-20% of patients with ALL, and CD33 in 5-10% in previous studies21). CD19/CD10/CD34 combination was used alternatively for the patients who lacked expression of aberrant myeloid antigens. The rationale for this strategy was described by Coustan-Smith et al12). Normal immature CD19-positive cells expressing CD10 and/or CD34 usually indicate benign B-cell precursors of the regenerating marrow, hematogones14). These cells have been shown to be consistently undetectable in bone marrow samples collected from children with T-lineage ALL after 2 weeks of remission induction chemotherapy, because of their high sensitivity to glucocorticoids and other anti-leukemic drugs12). Therefore, it is reasonable that any cells with this immunophenotype detected in patients with precursor B-ALL after 2 weeks of induction chemotherapy can be considered as residual leukemic cells rather than normal B-lymphoid precursors. Coustan-Smith et al. evaluated the correlation between levels of CD19-positive lymphoblasts after 2 weeks of induction chemotherapy and residual leukemic cells measured by 2 established MRD assays of multiparametric flow cytometric detection based on the abnormal immunophenotype of leukemic cells at diagnosis and PCR detection of Ig and TCR gene rearrangements. They have reported a remarkable concordance of results between the simplified assays based on CD19/CD10/CD34 expression and the more complex assays, and showed the applicability of the simplified flow cytometric MRD assay in the clinical setting. However, use of the combination of CD19/CD10/CD34 at other time points such as end of induction chemotherapy or during consolidation chemotherapy cannot be feasible because normal B-cell progenitors in regenerating bone marrow during those periods will necessarily produce false-positive results. High incidence of hematogones reaching 50.7% was reported in samples from precursor B-ALL patients under complete remission22). Thus, at these time points, aberrant myeloid antigen expression can be used for MRD detection. For the patients who lack expression of aberrant CD13/CD33, expression of other aberrant markers such as CD15, CD56, CD65, and CD66, or markers expressed at different stages of normal B-cell maturation can be used to detect MRD at various time points during treatment16). With all of these marker combinations, approximately 90% of B-lineage ALL cases can be studied at the 1 in 104 level of sensitivity, although complexity of analysis and high costs may restrict their use in resource-limited setting.
Previous studies have demonstrated that simplified MRD monitoring predicted treatment outcomes successfully. Coustan-Smith et al. analyzed 84 uniformly treated children using simplified flow cytometric assay on day 19 of induction chemotherapy in the St. Jude Total Therapy study XIIIB12). They reported that the 10-year incidence of relapse or remission failure was significantly higher for patients with 0.01% or more leukemic cells on day 1912). A simplified MRD PCR method with consensus primers for Ig and TCR gene rearrangements rather than standard PCR method using tailor-made reagents for each patient have been reported to have a significant value in discriminating between good and poor responders among children with ALL10, 11, 23). Our study provides supportive evidence for the feasibility of a simplified MRD assay using minimal immunophenotypic markers. Moreover, we used aberrant myeloid expression to supplement the simplified method. These strategies of MRD monitoring are applicable to nearly all patients with precursor B-ALL during induction chemotherapy with reasonable resource requirements.
Our study has several limitations: the sample size was small, and patient inclusion was not consecutive due to inconsistent data availability. In addition, our method is applicable only during induction chemotherapy. Current clinical trials usually adopt MRD monitoring strategy at 2 or more time points7, 24, 25), since analysis of MRD at one time point is less sufficient for predicting treatment outcomes4, 5). Moreover, MRD cut-off values of 0.1 to 1% in our study were higher than those of other clinical trials, because the event counts for flow cytometric analysis were relatively low. More flow cytometric events, usually between 1 and 5×10⁵, should be acquired to reliably increase sensitivity for MRD detection to 0.01 to 0.001% (i.e. at least 1 to 10 of 100,000 cells), which is the usual cut-off value for MRD detection in most clinical trials.
In conclusion, our study has demonstrated that MRD monitoring on day 14 of remission induction chemotherapy had a significant value in predicting relapse in childhood precursor B-ALL. Moreover, a simplified flow cytometric assay could provide additional information to that provided by morphological assessment. MRD quantitation has become a mandatory part of childhood ALL therapy. Among the issues faced in the clinical setting are development of simpler techniques at reasonable cost, and application of MRD monitoring to more extended groups of patients, especially those under the public health insurance system. We suggested the feasibility of the simplified flow cytometric assay which is applicable to nearly all patients and requires less medical resources. Further prospective trials are required because the validity of our findings is limited by its preliminary nature due to a small sample size and inconsistent enrollment. Also, serial monitoring of MRD by more sensitive methods such as multichannel flow cytometry or PCR-based technologies should be incorporated into cooperative group clinical trials to refine the delineation of treatment response groups and improve the treatment outcome.
 PDF Links
 PubReader
 PubMed
 Download Citation


