

Introduction
The prevalence and causative foods of food allergies might be different from region to region according to the culinary traditions and races. Rice is known to be a relatively low allergenic food and there are few reports of rice allergies in the West. However, cases of rice allergy have been reported in Japan from the 1990s. Since the report showing that the avoidance of rice results in clinical improvement in 76% of 25 atopic dermatitis patients with positive rice specific immunoglobulin (Ig)E, rice allergies have become an issue to the point of producing hypoallergenic rice in Japan1-3). In Korea, a report showed that 33 out of 240 children with suspected allergic disease had a positive skin reaction to rice4). However there is a few reports on the correlation of rice allergen sensitization and their clinical symptoms.
Some allergens have been mentioned as possible major allergens of rice. One study reported that globulin in the embryonic bud of rice has strong allergenicity. Another study reported that albumin with protein bands of 14-16 kDa is the major allergen of rice5,6). There are some reports about the protein bands of 26, 33, 56 kDa as the major IgE-binding components in rice7-10). However, few studies identified the rice allergen relating to the clinical symptom. The immunologic characteristics of rice allergen are unclear. Previous studies reported that rice becomes less allergenic after heating. However, heat- and acid-stable protein, lipid transfer protein (LTP) has emerged recently as a relevant factor in symptomatic rice allergies11-15). The aim of this study was to identify the rice allergen and examine the altered allergenicity after heating and during the digestion process.
Materials and methods
1. Subject and control groups
Twenty-four children, who were sensitized to rice antigen more than +2 (>0.7 kU/L) according to UniCAP (Phamacia Diagnostics AB, Uppsala, Sweden) test among children with allergic diseases at Pediatric Allergy Respiratory Center in Soonchunhyang University Hospital, were enrolled in this study. The subject group was subdivided into patients with symptoms after the ingestion of rice and patients without symptoms. The control group consisted of 44 patients with allergic disease who underwent a rice-specific IgE test but had a negative result. The control group was divided further into 2 groups. Control I (N=18) was defined as subjects who were sensitized to more than 3 other food allergens but not to rice, Control II (N=26) was defined as subjects who were not sensitized to food allergens including rice.
2. Methods
1) Analysis of subject and control group
A medical record and laboratory data review of subjects was performed. The specific data collected included the patients' gender, age, symptoms of rice allergy, serum total IgE level, eosinophil cationic protein (ECP), and specific IgE level of food allergen including rice. Symptoms of rice allergy were defined as IgE mediated allergic reactions such as rash, erythema, urticaria, angioedema, oral allergy syndrome, rhinoconjunctivitis, wheezing, anaphylaxis after ingestion of rice porridge, thin rice gruel, boiled rice, rice cookies, etc. Aggravation of atopic dermatitis was excluded because it is mixed type symptom of IgE mediated and non-IgE mediated reaction. The symptoms of rice allergy were checked by history taking or documented open food challenge test on medical records. Open food challenge test was performed with the suspected rice food and symptoms of rice allergy were observed for 4 hours in an out-patient clinic.
2) Allergen extract
Raw rice (from Hwasung, South Korea), raw unpolished rice, cooked rice, cooked unpolished rice, microwaved commercial semicooked rice (Hatban®) were prepared after grinding. The rice was cooked using the general method. The rice was washed and mixed with water to make a volume that was 1.5 times that of the rice. The rice was boiled for approximately 10 minutes until the water temperature reached 100℃, and boiled for a further 8 minutes until all the water had been absorbed. Subsequently, the gas ring was turned off and the rice was allowed to stand with the lid on.
The extracts were centrifuged at 12,000 rpm for 20 minutes to remove the precipitate, and the supernatant was dialyzed against a cellophane tube (molecular mass cut-off 6,000 to 8,000 Da) for 48 hours. The resulting supernatant was centrifuged again (at 12,000 rpm for 20 minutes) and filtered through a 0.2 µm syringe filter. The bicinchonicni acid technique (Pierce Chemical Co., Rockford, IL, USA) was used to determine the protein concentration according to the manufacturer's instructions using bovine serum albumin (BSA) as a standard. The crude extract of rice contained 5.6 mg/mL of protein.
3) Sodium dodesylsulfate-polyacrylamide gel electrophoresis (SDS-PAGE)
As described by Laemmli16), each sample was mixed with the loading buffer (60 mM Tris-HCl, 25% glycerol, 2% SDS, 14.4 mM 2-mercaptoethanol, 0.1% bromophenolblue), and heated. Electrophoresis was carried out using precast 4 to 20% Tris-glycinegels (Novex, Invitrogen, Carlsbad, CA, USA) at 125 V for 90 minutes in a SDS running buffer system with the marker (6 to 98 kDa, Invitrogen). The gel was visualized by staining with Commassie Brilliant Blue R 250 (Sigma-Aldrich Co., St. Louis, MO, USA) and the gel images were captured using a Gel Doc Image Analysis system (Bio-Rad Laboratories Inc., Hercules, CA, USA). Band quantitation was performed by densitometry using Multi Gauge Ver. 3.0 (Fujifilm Co., Tokyo, Japan).
4) Analysis of the protein bands of rice and cooked rice
Electrophoresis of raw rice, cooked rice, cooked unpolished rice, and microwaved semi-cooked rice was carried out. The protein band distributions of each sample were compared and analyzed.
5) SDS-PAGE of rice treated with heat, simulated gastric fluid (SGF) and simulated intestinal fluid (SIF)
The changes in the rice protein bands after treatment with heat and digestive enzyme were compared using SDS-PAGE. To detect a time at which rice protein bands rapidly degraded, serial electrophoresis was performed. The rice protein was boiled at 100℃ for 10, 30, 60 minutes followed by electrophoresis of each sample. The digestive enzymes, SGF and SIF, were prepared using the methods reported by Fu et al.17). The rice protein was treated with SGF and SIF for 0, 10, 30, and 60 minutes. SGF is a synthetic fluid with a similar composition to the gastric fluid of humans and SIF is a synthetic fluid with a composition is similar to the intestinal fluid of humans. SGF was prepared by dissolving 471 unit/mg of pepsin (Sigma-Aldrich Co.) to 0.03 M NaCl (pH 1.2) to make the concentration 3.2 mg/mL. SIF was prepared by dissolving pancreatin (Sigma-Aldrich Co.) in 0.05 M KH2PO4 (pH 7.5) to make a concentration of 10 g/1,000 mL. SGF and SIF were kept at 37℃. After mixing 200 µL of SGF and 200 µL of rice protein according to time (0, 10, 20, and 60 minutes), 50 µL of the mixture was distributed in test tubes, which contained 12 µL of the sample buffer and 1 µL of 0.2 M NaCO3 (neutralizing
buffer). Electrophoresis was carried out and the protein bands were compared. The same processes were performed using SIF.
6) IgE-immunoblot of rice
The sera of 18 patients among 24 patients who were sensitized to rice allergen could be performed immunoblot. Four sera for the control were used. The protein bands of rice were electrotransferred (50 V, 120 minutes) from the gel to a nitrocellulose membrane (Millipore Co., Bedford, MA, USA) using a modified version of the method reported by Towbin et al. (1979). The nitrocellulose membrane was blocked with 3% bovine serum albumin (BSA)-phosphate-buffered saline (PBS) (pH 7.4) for 1 hour, followed by washing 3 times with PBS-T (Tween-20 in PBS) for 10 minutes. The rice-allergic human serum (diluted at 1:10) and control serum (diluted 1:10) were then added to the membrane for >16 hours at 4℃. After washing with PBS-T, the samples were conjugated with biotinylated anti-human IgE antibody (Vector Laboratories, Burlingame, CA, USA) diluted 1:4,000 for 2 hours at room temperature. The samples were conjugated with avidinphosphatase diluted 1:2,000 for 30 minutes after further washing. The membrane was then developed using Sigma FAST BCIP/NBT (5-Bromo-4-Chloro-3-indolyl phosphate/Nitrobule tetrazolium, Sigma-Aldrich Co.), followed by washing. The protein bands of the heated-rice were electrotransferred and immunoblotted in a similar manner.
The blot images were captured using a Gel Doc Image Analysis system (Bio-Rad Laboratories Inc.), and the binding capacity was evaluated by densitometry using Multi Gauge Ver. 3.0 (Fujifilm Co.).
Results
1. Characteristics of subject group
1) Clinical characteristics of the rice-sensitized group
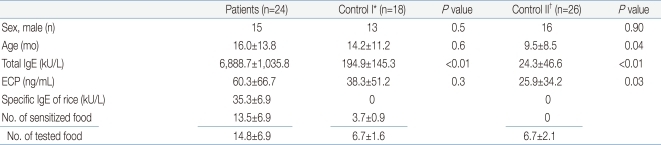
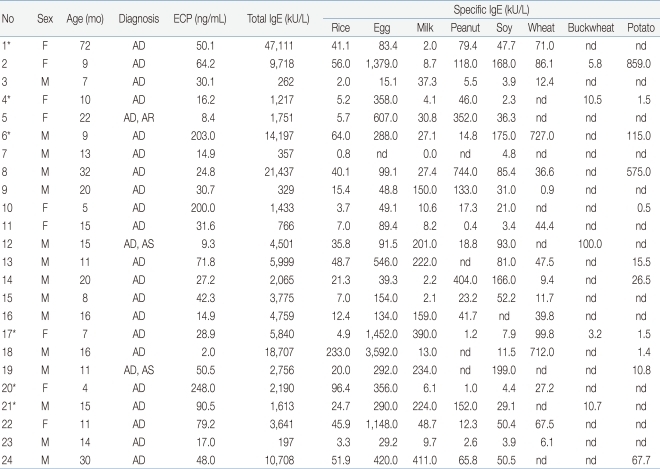
The mean age of the 24 subject group was 16.3±13.8 months (range, 4 to 72 months). The mean level of rice-specific IgE was 35.3±48.8 kU/L, and lowest level was 0.8 kU/L, highest level was 233.0 kU/L. All patients had a high total IgE (mean, 6,888.7±10,358.8; range, 197 to 47,111 kU/L), also had high ECP (mean, 60.3±66.7 ng/mL) (Table 1). Moreover, the patients were sensitized to multiple food allergens other than rice. The specific IgE level of other foods were also very high (Table 2). Six of the 24 patients showed symptoms such as rash on their lips, face and trunk after ingesting rice porridge or rice cookies. Patient #20 was a 4 month-old girl with a history of rashes around the lips, jaw, face after ingesting of rice gruel for the first time. The rice gruel was boiled for 30 to 40 minutes with ground rice at patient's home. An open challenge test for thin rice gruel, which was boiled for 60 minutes was carried out in an out-patient clinic but no symptoms were observed. After that, she had no symptoms after ingesting fully boiled thin rice gruel, and after 1 to 2 months, rice porridge or cooked rice induced no symptoms. The rest five patients with symptoms did not have obvious information of cooking time.
2) Comparison between rice-sensitized group and control group
The control group consisted of 44 atopic dermatitis children who underwent a rice-specific IgE test but had a negative result. The control group was divided further into two groups. Control I (n=18) was defined as subjects who were sensitized to more than 3 other food allergens but not to rice. Control II (n=26) was defined as subjects who were not sensitized to food allergens including rice. The sex ratio was similar in the 3 groups. The mean age of the subject group and Control I was similar (16.3±13.8 months), Control II had a lower age (9.5±8.5 months) (P=0.04). The total IgE level of the subject group was 6,888.7±10,358.8 kU/L, which was significant high level compared to Control I (194.9±145.3 kU/L) and Control II (24.3±46.6 kU/L) (P<0.01, <0.01). The mean ECP level was high in the subject group (60.3±66.7 ng/mL) and similar to that in Control I (P=0.3), but significantly higher than Control II (P=0.03). In the subject group, the patients were sensitized to an average of 13.5 food allergens among the 14.8 allergen tested (91.2%) (Table 1). In the control group, the patients were sensitized to an average of 1.5 food allergens among the 6.7 allergen tested (22.4%).
3) Comparison between the groups according to the symptoms of rice allergy
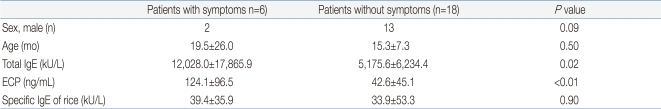
Patients with symptoms of a rice allergy and those without symptoms were compared. In the group with symptoms, girls outnumbered boys. The specific IgE of rice was similar in two groups (P=0.9; group with symptoms, 39.4±35.9 kU/L vs. group without symptoms, 33.9±53.3 kU/L). However, the group with symptoms had significant higher total IgE (12,028.0±17,865.9 kU/L) and ECP (124.1±96.5 ng/mL) than group without symptoms (5,175.6±6,234.4 kU/L, 42.6± 45.1 ng/mL) (P=0.02, <0.01) (Table 3).
2. SDS-PAGE of rice allergen
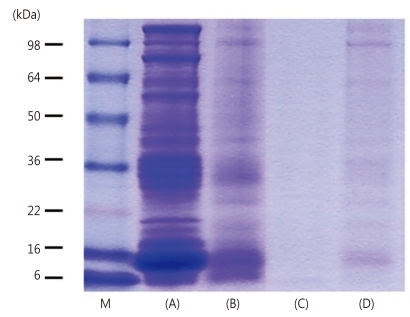
More than 16 protein-bands were observed in raw rice, prominent 9, 14, 16, 18, 20, 22, 25, 28, 31, 33-35, 46, 57, 62, 79, 94, 109 kDa. However, cooked rice, cooked unpolished rice and semi-cooked rice showed only a small number of protein-bands remaining, 14-16, 31-35 kDa protein bands. The intensity of protein bands of cooked unpolished rice and semi-cooked rice was lower than cooked rice (Fig. 1).
3. Changes in the rice protein bands after treating heat and digestive enzyme
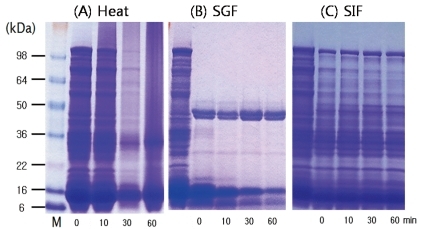
In heat treated rice, most protein bands of rice was remained at 10 minutes. At 30 minutes, most of the bands was also remained but much faded. At 60 minutes, many of them degraded and protein bands of 9, 14, 31-35 kDa were still remained. When we mixed SGF with rice protein, a large number of bands degraded immediately. At 60 minutes, 9, 14, 28, 31, 35 kDa protein bands were remained. Few protein bands degraded in the rice treated with SIF. This suggests that 9, 14, 31 kDa bands are stable after the rice is processed by heat, digested with enzymes in the stomach and intestine (Fig. 2).
4. IgE immunoblot of rice
1) IgE immunoblot of raw rice
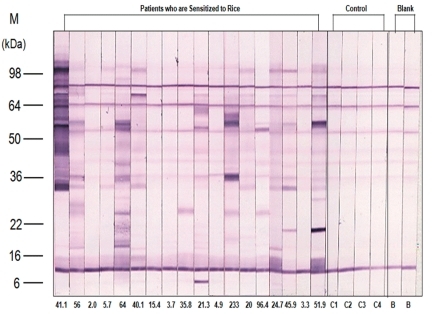
Using the gel electrotransferred raw rice, an IgE immunoblot was performed with the sera of eighteen patients who were sensitized to rice and the sera of the control. Immunoblotting analysis revealed the presence of allergenic proteins with IgE binding activities. The molecular mass of these proteins varied from 9 kDa to 109 kDa by different patients. In the order of frequency, the protein band of 14 kDa was most frequent, presenting in 16 of 18 patients (88.9%). The protein-bands of 79 kDa were observed in 50% of subjects, 18, 109 kDa in 44.4%, 9, 33, 46 kDa in 38.9%, and 57 kDa in 33.3% of patients (Fig. 3, Table 4).
2) IgE immunoblot of heated rice
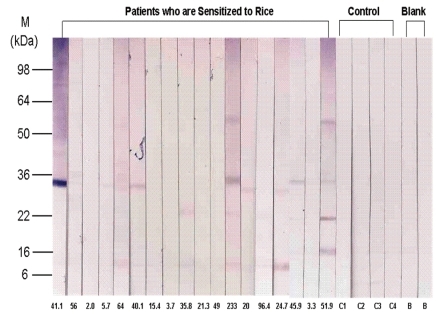
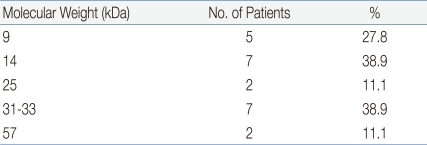
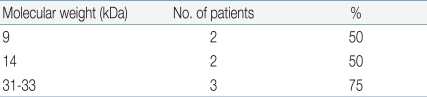
Using the gel electrotransferred heated rice, IgE immunoblotting was done with the same sera used in the IgE immunoblotting of raw rice. In contrast to raw rice, a large number of protein bands had disappeared or faded. However, the protein bands of 14 kDa were observed in 38.9% (7 of 18 patients), 9 kDa in 27.8% (5/18), 31-33 kDa with a thick band in 38.9% (7/18) (Fig. 4, Table 5). Four sera of patients with rice allergy symptoms (5th, 11th, 15th, 16th stripe of immunoblot in Fig 4.) reacted with protein band of 31-33 kDa in 75% (3 of 4 patients), 9 kDa in 50% (2/4), and 14 kDa in 50% (2/4) (Fig. 4, Table 6).
Discussion
Rice is the staple food of Asian countries including Korea in compare with western countries. Moreover, rice gruel or rice porridge is the first weaning food of infants in Korea. Therefore, it is very important to diagnose rice allergies and interpret rice allergen sensitization in high risk infants with food allergies or children with atopic dermatitis.
Cases of rice allergy are rare in West. There have been a few cases of anaphylaxis with risotto11), enteropathy related to rice18), and allergic rhinoconjunctivitis after the ingestion of boiled rice19). However, in Japan from the 1990s, rice allergy in patients with atopic dermatitis began to attract attention. Some reports have shown that the allergic symptoms were improved by consuming hypoallergenic rice1,2). In Korea, Lee et al.4) reported a study about specific IgE and IgG4 of rice allergen in atopic children. Studies have revealed cross reactivity of rice with buckwheat, barley or wheat20,21) and one report compared the antigenicity of rice and low allergenic rice22). However, the allergens that actually cause the allergic symptoms on the patients with sensitization to rice allergen are not obvious and an interpretation of the sensitization to rice is also unclear.
The major foods that cause food allergy, such as egg white, milk, soy and peanut, have a known cut-off point of a 95% positive predictive value via UniCAP test, which can predict food allergies without gold standard test of food allergies, the double-blind placebo-controlled food challenge test. It is important to predict whether rice allergen sensitization will cause real allergy symptoms because rice is the major daily food in Korea.
In this study, patients who are sensitized to a rice allergen have a significantly higher total IgE and ECP levels than patients not sensitized. Moreover, among patients sensitized to rice allergen, patients with allergic symptoms showed a significantly higher total IgE and ECP levels, but not a very high specific IgE to rice allergen. Therefore, true rice allergy could not be predicted by the presence of rice-specific IgE. Statistical significance of rice allergy symptoms is related to total IgE and ECP, not a specific IgE to rice in this study. However it is not allegeable that high total IgE and ECP means actual allergy symptoms in patients with rice sensitization because total IgE and ECP could be high owing to severe underlying disease such as atopic dermatitis at the time of blood test. There are several studies that serum ECP levels in patients with atopic dermatitis is related with disease severity23,24). However in food allergy, the relationship between serum ECP level with clinical food allergy symptom is not evident. A study showed that the fecal concentrations of ECP showed a distinct decrease as a result of an adequate elimination diet in patients with food allergy25). It is necessary to obtain a detailed history of the patients or perform an oral food challenge test for rice, in patients who are sensitized to rice allergen and have a high total IgE and ECP.
Another result of this study was that the patients sensitized to rice were also sensitized to other multiple foods. They are sensitized to most of the foods tested in the UniCAP. An atopic woman, who developed anaphylaxis after drinking beer with a corn made snack, was sensitized to not only corn and barley, but also to wheat, rye, oat and rice26). This suggests the possibility of latent sensitization by a common epitope. In one domestic report, patients who were sensitized to buckwheat and rice simultaneously showed allergic symptoms only to buckwheat. The 22 kDa antigen of rice shares an epitope with buckwheat, which is a factor for determining the IgE-binding site in the 22 kDa antigen of buckwheat. This suggests that the presence of specific IgE of rice can be due to a false positive result by cross reactivity20). Lehrer et al. reported that significant RAST correlations were observed between rice and corn (r=0.95), rice and soy (r=0.81)27). In addition, Lee et al.21) reported that rice has high cross-reactivity with barley because enzyme-linked immunosorbent assay inhibition assays using barley extract as inhibitor allergen showed 75.7% inhibition of IgE binding to rice, compared to 33.3% when wheat was used as an inhibitor and 18.4% using buckwheat. Jones et al.28) reported that the cross-reactivity among grains is high in vitro but low in clinical challenge test. Same species of plants or animals does not always have high cross-reactivity. On the other hand, high cross-reactivity can exist among antigens with little correlation. However it is a noteworthy fact that the patients who were sensitized to rice were also sensitized to more than 13 different foods simultaneously. This maybe because of the non-specific binding of IgE or false positive result but the possibility of a pan-allergen.
To date, proteins suspected as being an allergen to rice are 14 to 16 kDa Ory s 12 (profillin A) and 33 kDa or 35 kDa Ory s 1 (beta-expansin)5-7,9). The majority of plant food allergens can be grouped into only 4 protein families. Among these rice allergens is RA14, which is a member of the prolamin superfamily10).
Heat-processing or digestion can alter antigenicity of allergen. The rice allergen is weak after the heat-process. The antigen specific IgE of rice decreases after heating at 100℃ for 60 minutes29-32). In a recent domestic report, Kim et al.33) reported a case of an infant with a recurrent history of urticaria after the ingestion of rice porridge, which showed no symptoms after ingestion of rice heated at 100℃ for 60 minutes. In addition, in the present study, one infant, who had a rash around the lips and face after ingesting rice porridge, did not have any rash on the open food challenge test with rice porridge heating over 1 hour. In a more recent study, the 9 kDa LTP, which is relatively resistant to heat and acid, was suggested as one of the causative factors for symptoms and the cross-reactivity of rice. LTP, a 9 kDa protein, has attracted attention as a common allergen of various plant foods, such as corn and peach11-15). LTP is divided into non-specific LTP types 1 and 2, and is a member of the prolamin superfamily among the protein families of plant food allergens10). Cases of patients sensitized to LTP presenting with symptoms of rice allergy after ingesting cooked rice, such as risotto, have been reported11,14). LTP is a stable allergen to heat and acid. Therefore, infants who are sensitized to LTP can have allergic symptoms to rice porridge during their weaning period. In this study, the 9 kDa protein band is the same in LTP remaining in SDS-PAGE at 60 minutes after heating-process and the addition of the digestive enzymes and IgE immunoblot of heated rice.
These days, commercial semi-cooked rice (Hatban) is used widely and consumption of unpolished rice is high because of interest in health diet. Therefore, SDS-PAGE of microwaved semi-cooked rice and cooked unpolished rice were also performed. The reduced protein bands in SDS-PAGE for microwaved semi-cooked rice and cooked unpolished rice were similar to cooked rice. However, the intensity of the protein bands was low. SDS-PAGE for microwaved semi-cooked rice is believed to be a result of the reduced heating effect and additional electronic beam effect. The electronic beam causes a change to the DNA and protein-binding, and affects antigenicity of food34). Further studies will be needed.
As a result of this study, the 9, 14, 31 kDa protein bands remained in common in SDS-PAGE for rice after the heating and digestion process, and the 9, 14, 31-33 kDa protein bands were presented in IgE immunoblot of heated rice. Moreover these bands were presented in over 50% of patients with symptoms of rice allergy. Although we could not performed IgE immunoblot of rice treated with SGF and SIF owing to lack of sera, it is reasonable to assume the 9, 14 and 31 kDa protein bands are responsible for rice allergy because major allergen is defined as a allergen which is presented in over 50% patients with allergy symptoms. However, in this study, only four sera of patients with symptoms could be performed IgE immunoblot. More expanded study on the analysis of protein bands of symptomatic patients with prearranged challenge test will be needed. In addition, further studies analyzing the base sequence of the remaining site in 2D electrophoresis after the heating and digesting process is necessary. This is expected to provide methods for the prevention and practical alternatives for rice allergy.

 PDF Links
 PubReader
 PubMed
 Download Citation


