


Introduction
Myotonic dystrophy (also known as dystrophia myotonica; DM) is an autosomal dominant disorder characterized by muscular dystrophy, myotonia, cataract, hypogonadism, and cardiac conduction disorders. It is classified into 2 types, DM type 1 (DM1) and DM type 2 (DM2), based on the causative genetic mutation [1]; DM1 is more severe and common with an estimated prevalence of 1 in 8,000 [2,3].
Although diagnosis can be made on the basis of several symptoms, it is often difficult to confirm the diagnosis, solely based on clinical symptoms, in mild cases [4]. For such instances, direct analysis of the cytosine/thymine/guanine (CTG) trinucleotide repeat in the 3' untranslated region of myotonic dystrophy protein kinase (DMPK) gene on chromosome 19 by Southern blotting enables a reliable diagnosis [5], since DM1 is known to result from an abnormal number of CTG repeats [2,6].
Severity of DM1 varies with the number of CTG repeats [6,7]. While mildly affected patients have 50–150 repeats, patients with classic DM1 have 100–1,000 repeats, and those with the congenital form of the disease have >2,000 repeats [2,8,9]. However, due to insufficient number of patients, investigation of various hypotheses regarding diagnostic tools and treatment of DM1 has been limited. In fact, there is currently no established cutoff value or classification standard for the distribution of patients, genetically diagnosed with DM1, according to CTG repeat length.
Thus, our aim was to determine whether a correlation between severity of clinical phenotype and length of the CTG repeat region could be established for better classification of the disease in affected individuals.
Materials and methods
1. Patient group
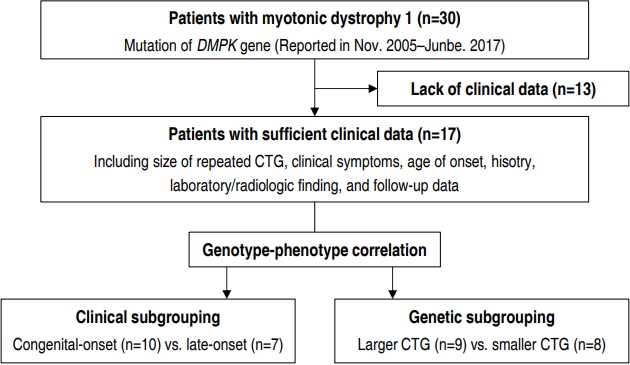
We identified 30 patients with DM1, who were followed up in 2 centers of our hospital (Gangnam Severance Hospital and Severance Children’s Hospital), through a retrospective study (Fig. 1). All participants were diagnosed with DM1 by genetic testing of DMPK from November 2005 to June 2017. Thirteen patients were excluded from the study due to poor clinical data. Our final cohort of 17 patients with DM1 had sufficient clinical data, including clinical symptoms, age of onset, previous history, length of CTG repeat, laboratory and radiological findings, and follow-up data. Institutional Review Board, Gangnam Severance Hospital, Yonsei University College of Medicine (approval number: 3-2017-0263) and written informed consent was obtained from the parents or legal guardians of all patients.
2. Subgroup analysis
We derived 2 different sets of subgroups for intergroup comparison based on 2 criteria, clinical and genetic. In clinical subgrouping, patients were classified based on the onset time of symptoms; the ones whose symptoms appeared within one month formed the congenital-onset subgroup while the others with later onset of symptoms formed the late-onset subgroup. In genetic subgrouping, patients were classified based on the number of CTG repeats. The “Large CTG” subgroup included individuals with >1,000 CTG repeats while the “small CTG” subgroup consisted of individuals with <1,000 CTG repeats. Currently, the most widely known classification of disease severity based on CTG repeats is as follows: normal individuals (5– 37 repeats), mildly affected patients (50–150 repeats), patients with classic DM1 (100–1,000 repeats), and patients with congenital DM1 (>2,000 repeats). As stated earlier, there is no established cutoff value or classification standard for the distribution of the patients according to CTG repeat length, especially over 1,000–2,000 repeats. Since 23% of patients had congenital DM1, possessing 1,000–2,000 repeats of the CTG trinucleotide, in our patient group, we set >1,000 repeats as the threshold for classification of congenital DM1 in our cohort.
3. Statistics
All analyses were conducted using IBM SPSS Statistics ver. 20.0 (IBM Co., Armonk, NY, USA). We used Fisher exact test to calculate P values between each set of subgroups. Spearman rank correlation was used to identify whether there was a relationship between length of the CTG repeat region and age of onset, whereas the Mann-Whitney U test was used to compare time periods between birth, symptom onset, and diagnosis. A P value of <0.05 was considered statistically significant.
Results
1. Demographics
Our cohort consisted of 12 male (70.6%) and 5 female patients (29.4%) (Table 1). The time period from diagnosis to onset of symptoms was 1.6±2.7 years, and that from birth to onset was 4.1± 5.8 years. Ten patients were found to have congenital-onset DM1 whose symptoms manifested within 1 month from birth, 7 were found to be late-onset patients whose symptoms manifested after 1 month from birth. We observed a varied distribution in the number of patients classified according to CTG trinucleotide repeat length, but there was no correlation between age of onset and length of CTG repeat in our pediatric patient population. However, there was a nonsignificant tendency towards an inverse relationship on scatter plot (Correlation coefficient=-0.194, P=0.384).
2. Clinical subgrouping
1) General characteristics and clinical manifestations
As shown in Table 2, among our clinically derived subgroups, the sex ratio was 6 male (60.0%) to 4 female patients (40.0%) in the congenital-onset subgroup and 6 male (85.7%) to 1 female patient (14.3 %) in the late-onset subgroup. This difference in sex distribution was, however, not statistically significant. The first symptom to manifest in cases with DM1, though variable, included hypotonia, myotonia, weakness, delayed development, gait disturbance, and chest discomfort. We found a significant difference in the occurrence of hypotonia between patients from our clinical subgroups; hypotonia occurred in all patients from the congenital-onset subgroup while it was not at all reported in the late-onset subgroup. Furthermore, we found that birth and family history, including prematurity, neonatal intensive care unit (NICU) admission rate, and need for respiratory support, was significantly dominant in the congenital-onset subgroup compared to those in the late-onset subgroup. Prematurity occurred in 60.0% of patients from the congenital-onset subgroup while it occurred in none in the late-onset subgroup (P=0.035); the proportion of NICU admission and need for respiratory support (100% and 90.0%, respectively) in the congenital-onset subgroup was high compared to none in the late-onset subgroup (P=0.003 and P=0.014, respectively). On the other hand, prenatal history, such as decreased fetal movements and polyhydramnios, had no statistically significant difference between the subgroups. We also found that the involved systems were variable and 4 clinical symptoms, specifically poor feeding in neonate, dysphagia, congenital respiratory distress, and hypotonia in neonate, were statistically more frequent in the congenital-onset subgroup, with frequencies of 80.0%, 80.0%, 60.0%, and 100%, respectively. Furthermore, CTG repeat distribution in congenital- and late-onset subgroups was not significantly different for patients with >2,000 CTG repeats (20.0% vs. 42.9%, respectively), 1,000–2,000 CTG repeats (40.0% vs. 0%, respectively), 500–1,000 CTG repeats (10.0% vs. 28.6%, respectively), and 100–500 CTG repeats (30.0% vs. 28.6%, respectively).
2) Diagnostic evaluation and functional status in the last visit
Although 31.3% of all patients showed increased creatinine kinase (CK), there was no significant difference between the 2 subgroups (Table 3). In addition, abnormal findings in brain MRI were more common in the congenital-onset subgroup compared to that in the late-onset subgroup (85.7% vs. 50.0%, respectively), though not statistically significant. In the last out-patient follow-up visit, dependence on ventilator was higher in the congenital-onset subgroup compared to that in the late-onset subgroup (50.0% vs. 0%, respectively), whereas the late-onset subgroup had fewer limits (in the mild form) on daily life.
3. Genetic subgrouping
1) General characteristics and clinical manifestations
As shown in Table 4, there were 6 male (66.7%) and 3 female patients (33.3%) in the large CTG subgroup and 6 males (75.0%) and 1 female (25.0%) in the small CTG subgroup. This gender difference was, however, not statistically significant. In contrast to our findings from clinical subgrouping, we found no significant difference between the genetic subgroups for hypotonia as a first symptom, prematurity, NICU admission rate, need for respiratory support, and several other clinical symptoms. We found hypotonia as a first symptom in 66.7% of patients from the large CTG subgroup and in 50.0% of patients from the small CTG subgroup, whereas the proportion of premature birth was 55.6% in the large CTG subgroup versus 12.5% in the small CTG subgroup. The proportion of cases requiring NICU admission and need for respiratory support was both 75.0% in the large CTG subgroup compared to 80.0% and 60.0%, respectively, in the small CTG subgroup. Poor feeding in neonate was found to be the only symptom that was significantly increased in patients in the large CTG subgroup, compared to that found in the small CTG subgroup (88.9% vs. 25.0% respectively, P=0.015).
2) Diagnostic evaluation and functional status in the last visit
Similar to our findings from clinical subgroups, we found no significant difference in CK level and abnormal findings from brain MRI between the 2 genetically defined subgroups (Table 5). Increased CK levels of 37.5% and 25.0% were found in the large CTG and small CTG subgroups respectively; we also found that 80.0% and 66.7% of patients from these 2 subgroups had abnormal findings in brain MRI. Similarly, we found no significant difference between the genetic subgroups based on ventilator dependence (33.3 % vs. 25.0%, respectively) and quality of daily life (55.6% vs. 75.0%, respectively).
Discussion
Patients with DM1 do not always present typical symptoms of the disease, but may show variable symptoms and severities. Variable instability of a CTG trinucleotide repeat in DMPK causes genotypic and phenotypic variation [10]. Some studies have included patients with motor impairments and most patients may have several clinical features like myotonia, muscular weakness, and family history [10,11]. We found variable symptoms in our study cohort as well. However, there have been few studies that subgrouped patients according to age of onset to compare prominent clinical features between groups. One study divided patients into 5 clinical categories (congenital, infantile, juvenile, adult-onset, and late-onset) and found that muscle weakness typically arises earlier in the congenital group, whereas myotonia was the earliest prominent symptom in patients from the infantile group. Early cardiac defects were prominent in juvenile group, whereas secondary symptoms, such as cataract and endocrine disorders, were prominent in the adult-onset group [12]. Based on clinical characteristics, we divided our study cohort into 2 groups, congenital-onset and late-onset, and found that there were several variables with statistically significant differences between these 2 cohorts.
In our study, prematurity, NICU admission rate, need for respiratory support, and hypotonia were important in the early period, while dysphagia, ventilator dependence, and functional status became important in the long-term. A previous study with 169 patients with DM1 had shown that over half the number reported swallowing problems, whose major contributor seemed to be muscular weakness. Further, researchers found that swallowing abnormalities may be present even if only a few symptoms were reported, or severity of the disease was not much pronounced [13]. Therefore, serial check-ups for swallowing may be warranted in clinical follow-up visits for patients with DM1. Furthermore, although pulmonary function impairment is relatively slow in patients with DM1, compared to that in patients with other neuromuscular disorders, we need to carefully assess respiratory symptoms and routinely perform screening tests since respiratory impairment is a major cause of death among patients with DM1 [14]. Therefore, although all the symptoms of DM1 are important for such a variable disease, longitudinal monitoring of certain clinical variables is required for affected individuals.
Individuals with DM1 inherently present a variable genotype that is dependent on the number of CTG repeats in DMPK. In our study, we found that patients exhibited a wide range of CTG-repeat length, ranging from 100 to more than 2,000 repeats. However, on the basis of genetic subgrouping, and in contrast to our finding from clinical subgrouping, we found poor feeding in neonate as the only variable that was statistically significant when compared between the 2 genetically defined subgroups. In contrast, a previous study had shown that patients with DM1 along with muscular weakness or dysfunction of the central nervous system also harbored larger CTG expansions compared to those without either symptom [10]. Furthermore, many studies have reported that age of onset was inversely correlated with the CTG repeat length [10,11]; however, others argued that the correlation between age of onset and CTG repeat length was only significant for patients with small expansions [15,16]. In our current study, we found no evidence of association between the length of CTG repeats and age of onset, although all of the patients from our cohort were less than 15 years of age. Collectively, these findings demonstrate the challenges involved in genotype-phenotype correlations. If age of onset and CTG repeat-length were inversely correlated, we would expect our findings, based on genetic subgrouping, to be similar to that of clinical subgrouping, which had shown evidence of association. Admittedly, in addition to the scarcity of the disease, our findings may not be generalizable due to the small number of patients evaluated, as well as, the fact that they were all under 15 years of age. Nevertheless, we cannot rule out the possibility of having no correlation between these factors at all, or of such associations being population-specific. In addition, since this is a retrospective study, there may be biases or errors in the medical records that may affect our study outcomes. Thus, further studies are warranted with a larger group of well-characterized patients.
Undoubtedly, a genetic approach is important for diagnosis since clinical symptoms of DM are not always specific; however, in reality, most diagnostic approach of DM1 is based on clinical symptoms as well, since it is necessary to make diagnostic estimates using several clues, unless a family history has been determined or confirmatory genetic testing is performed. In other words, clinical suspicion is the first step in diagnosis before confirmatory examinations, such as genetic tests, are performed. De Antonio et al. [12] had stated that age of onset and clinical form may be the key criteria in the design of clinical trials, when considering DM1 health management and research. Similarly, it is important to detect clinical clues from patients, including age of onset, and to know what characteristics to look for. Such efforts help in prognosis and preparation of proper management approach tailored for each patient; these could not be achieved simply from the number of CTG repeats.
Since DM1 has variable phenotypes and genotypes, there is no typical natural course or established management guidelines for patients with DM1. Serial examinations to detect newly developed abnormal signs and symptoms, for early treatment, need to be performed. Although some studies have recommended a series of examinations, they are general screening tools that are not based on individual parameters from patients [17,18]. For example, annual slit lamp examination of the lens (cataracts), pulmonary function test (respiratory failture), polysomnography (central/obstructive apnea), electrocardiogram (conduction disorder) and periodic thyroid function test (thyroid dysfunction), echocardiogram or cardiac magnetic resonance imaging (cardiomyopathy) are recommended. Therefore, several studies, such as PhenoDM1 [19], are underway to unravel the natural course of DM1 and achieve better outcomes. It is through these studies that a concrete and distinct protocol for the management of DM1 may be established, and many clinical features will play an important role in this process.
To summarize, we demonstrate the advantage of evaluating clinical variables through subgrouping in our small cohort of patients with DM1. Since DM is a rare disease, large prospective studies are difficult to perform; however, more large-scale studies are needed to develop individualized management protocols, based on the natural course of the disease and each patient’s clinical characteristics; proper subgroup analyses, as in this study, will contribute to achieve this important goal for patients with DM1.
 PDF Links
 PubReader
 ePub Link
 PubMed
 Download Citation


