Article Contents
| Clin Exp Pediatr > Volume 64(5); 2021 |
|
Abstract
Background
Purpose
Methods
Results
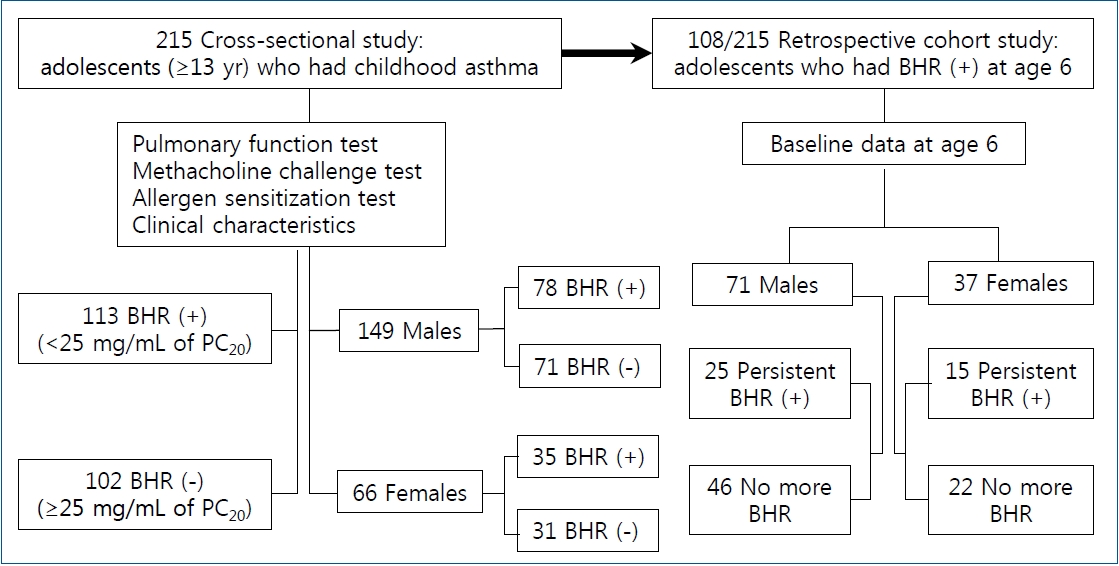
Fig. 1.

Table 1.
| Characteristic | BHR (+) (n=113) | BHR (-) (n=102) | P value |
|---|---|---|---|
| Age (yr) | 14±2.4 | 14±2.0 | 1.000 |
| Male sex | 78 (69) | 71 (70) | 0.956 |
| Age at the 1st wheeze started (yr) | |||
| <3 | 42 (37) | 43 (42) | 0.465 |
| ≥3, <6 | 14 (12) | 17 (17) | 0.398 |
| ≥6 | 57 (51) | 42 (41) | 0.248 |
| Admission with LRI during 1st 3 years of life | 37 (33) | 38 (37) | 0.567 |
| Combined allergic disease | |||
| Allergic rhinitis | 81 (72) | 75 (74) | 0.762 |
| Atopic dermatitis | 55 (49) | 38 (37) | 0.092 |
| Parental allergic disease | 45 (40) | 36 (35) | 0.494 |
| Atopic sensitization | 106 (94) | 90 (88) | 0.228 |
| House dust mite | 97 (92) | 77 (86) | 0.054 |
| Tree pollen | 47 (44) | 51 (57) | 0.221 |
| Grass pollen | 25 (24) | 26 (29) | 0.347 |
| Weed pollen | 37 (35) | 38 (42) | 0.567 |
| Mold | 34 (32) | 19 (21) | 0.050 |
| Pet | 39 (37) | 19 (21) | 0.009 |
| Food | 14 (13) | 17 (19) | 0.448 |
| Polysensitization | 68 (64) | 66 (73) | 0.526 |
| Total serum IgE (IU/mL), median (IQR) | 462 (208.9–1,044) | 329 (138.3–664.5) | 0.102 |
| Eosinophil (count/mm3), median (IQR) | 561 (279–778) | 400 (208–602) | 0.007 |
| Body mass index (kg/m2) | 21.7±4.1 | 21.9±6.7 | 1.002 |
| Asthma severity, median (range) | 2 (1–4) | 1 (1–4) | 0.001 |
| Pulmonary function test | - | 96±13.7 | |
| FEV1 (%predicted) | 91±14.4 | 94±15.9 | 0.013 |
| FVC (%predicted) | 94±13.7 | 86±8.0 | 1.000 |
| FEV1/FVC (%) | 84±10.5 | 58 (57) | 0.042 |
| <90 | 87 (77) | 44 (43) | 0.002 |
| ≥90 | 26 (23) | NA | - |
| Methacholine PC20 (mg/mL), median (IQR) | 5 (1.4–16) | - | - |
| <1 | 25 (22) | - | - |
| 1–4 | 24 (21) | - | - |
| >4 | 64 (57) | - | - |
| Current asthma | 75 (66) | 32 (31) | 0.000 |
| PC20, <1 | 19/25 (76) | - | 0.001a) |
| PC20, 1–4 | 19/24 (79) | - | - |
| PC20, >4 | 37/64 (58) | - | - |
Values are presented as mean±standard deviation or number (%) unless otherwise indicated.
BHR, bronchial hyperresponsiveness; LRI, lower respiratory infection; IQR, interquartile range; FEV1, forced expiratory volume in 1 second; FVC, forced vital capacity; PC20, provocative concentration of methacholine causing a 20% fall in forced expiratory volume in 1 second; NA, not available.
Table 2.
| Variable | aOR | 95% CI | P value |
|---|---|---|---|
| Mold sensitization | 4.038 | 1.572–10.373 | 0.004 |
| Total serum IgE (IU/mL)a) | 1.001 | 1,000–1.001 | 0.055 |
| Eosinophil (count/mm3)a) | 1.001 | 1,000–1.002 | 0.018 |
| FEV1%a) | 0.965 | 0.928–1.003 | 0.073 |
| FEV1/FVC <90%b) | 3.106 | 1.174–8.219 | 0.022 |
| Current asthma | 2.496 | 1.118–5.568 | 0.026 |
Table 3.
| Characteristic |
Males (n=149) |
P value |
Females (n=66) |
P value | |||
|---|---|---|---|---|---|---|---|
| BHR (+) (n=78) | BHR (-) (n=71) | BHR (+) (n=35) | BHR (-) (n=31) | ||||
| Age (yr) | 14±1.9 | 14±2.3 | 1.000 | 15±3.2 | 14±1.8 | 0.424 | |
| Age at the 1st wheeze started (%) | |||||||
| <3 yr | 29 (37) | 29 (41) | 0.447 | 13 (37) | 14 (45) | 0.618 | |
| ≥3 yr, <6 yr | 10 (13) | 12 (17) | 0.483 | 4 (11) | 5 (13) | 0.892 | |
| ≥6 yr | 39 (50) | 30 (42) | 0.354 | 18 (52) | 12 (39) | 0.705 | |
| Admission with LRI during 1st 3 years of life (%) | 26 (33) | 26 (37) | 0.632 | 11 (31) | 12 (42) | 0.446 | |
| Combined allergic disease | |||||||
| Allergic rhinitis | 58 (74) | 54 (77) | 0.705 | 23 (66) | 21 (71) | 0.652 | |
| Atopic dermatitis | 39 (50) | 27 (38) | 0.082 | 16 (46) | 11 (35) | 0.448 | |
| Parental allergic disease | 32 (41) | 26 (38) | 0.558 | 13 (40) | 10 (32) | 0.541 | |
| Atopic sensitization | 74 (95) | 62 (86) | 0.091 | 32 (91) | 28 (90) | 0.947 | |
| House dust mite | 65 (88) | 52 (84) | 0.951 | 32 (100) | 25 (89) | 0.246 | |
| Tree pollen | 34 (46) | 38 (61) | 0.081 | 13 (41) | 13 (46) | 0.702 | |
| Grass pollen | 19 (26) | 17 (27) | 0.774 | 6 (18) | 9 (32) | 0.348 | |
| Weed pollen | 29 (39) | 28 (45) | 0.482 | 8 (25) | 10 (35) | 0.645 | |
| Mold | 26 (35) | 13 (21) | 0.047 | 8 (25) | 6 (21) | 0.549 | |
| Pet | 28 (38) | 13 (21) | 0.041 | 11 (34) | 6 (21) | 0.149 | |
| Food | 10 (14) | 13 (21) | 0.257 | 4 (13) | 4 (14) | 0.644 | |
| Polysensitization | 48 (65) | 46 (74) | 0.203 | 20 (63) | 20 (71) | 0.518 | |
| Total serum IgE (IU/mL), median (IQR) | 388 (184–827) | 321 (132–639) | 0.915 | 582 (228–1,393) | 403 (196–818) | 0.406 | |
| Eosinophil (count/mm3), median (IQR) | 561 (279–753) | 426 (234–691) | 0.070 | 539 (275–891) | 354 (171–536) | 0.067 | |
| Body mass index (kg/m2) | 22.3±7.6 | 21.9±4.1 | 0.902 | 21.2±4.1 | 21.4±4.0 | 0.809 | |
| Asthma severitya), median (range) | 2 (1–4) | 1 (1–3) | 0.079 | 2 (1–4) | 1 (1–4) | 0.052 | |
| Pulmonary function test | |||||||
| FEV1 (%predicted) | 92±14.5 | 94±18.2 | 0.476 | 91±14.5 | 98±12.6 | 0.024 | |
| FVC (%predicted) | 95±11.8 | 93±16.3 | 0.475 | 92±17.2 | 97±15.1 | 0.217 | |
| FEV1/FVC (%) | 83±10.3 | 85±8.4 | 0.327 | 85±11.1 | 89±6.4 | 0.041 | |
| <90 | 60 (77) | 46 (65) | 0.108 | 27 (77) | 12 (39) | 0.005 | |
| ≥90 | 18 (23) | 25 (35) | - | 8 (23) | 19 (61) | - | |
| Methacholine PC20 (mg/mL), median (IQR) | 5.6 (1.3–16)b) | NA | - | 5 (2.3–16) | NA | - | |
| <1 | 17 (22) | - | - | 8 (23) | - | - | |
| 1–4 | 16 (20) | - | - | 8 (23) | - | - | |
| >4 | 45 (58) | - | - | 19 (54) | - | - | |
| Current asthmc) | 51 (65) | 25 (35) | 0.008 | 24 (68) | 7 (23) | 0.003 | |
| PC20, <1 | 12/17 (70) | - | - | 8/8 (100) | - | - | |
| PC20, 1–4 | 14/16 (87) | - | - | 6/8 (75) | - | - | |
| PC20, >4 | 25/45 (55) | - | - | 10/19 (53) | - | - | |
Values are presented as mean±standard deviation or number (%) unless otherwise indicated.
BHR, bronchial hyperresponsiveness; LRI, lower respiratory infection; IQR, interquartile range; FEV1, forced expiratory volume in 1 second; FVC, forced vital capacity; PC20, provocative concentration of methacholine causing a 20% fall in forced expiratory volume in 1 second; NA, not available.
a) Asthma severity: 1, mild-intermittent; 2, mild-persistent; 3, moderate-persistent; 4, severe-persistent.
Table 4.
| Variable |
Males (n=78) |
Females (n=35) |
||||
|---|---|---|---|---|---|---|
| aOR | 95% CI | P value | aOR | 95% CI | P value | |
| Agea) | 0.683 | 0.510–0.914 | 0.010 | - | - | - |
| Atopic sensitization | 7.207 | 0.599–86.721 | 0.120 | - | - | - |
| Mold sensitization | 5.569 | 1.702–18.221 | 0.005 | - | - | - |
| Eosinophila) | 1.002 | 1.000–1.003 | 0.026 | - | - | - |
| FEV1/FVC <90%b) | - | - | - | 7.500 | 1.715–32.796 | 0.007 |
Table 5.
| Variable |
Males (n=71) |
P value |
Females (n=37) |
P value | |||
|---|---|---|---|---|---|---|---|
| Persistent BHR (n=25) | No more BHR (n=46) | Persistent BHR (n=15) | No more BHR (n=22) | ||||
| Age at follow-up (yr) | 14±1.5 | 14±1.4 | 1.000 | 14±4.2 | 14±1.3 | 1.000 | |
| Age at the 1st wheeze started (%) | 1.000 | ||||||
| <3 yr | 11 (44) | 22 (48) | 0.807 | 6 (40) | 10 (45) | ||
| ≥3 yr, <6 yr | 14 (56) | 24 (52) | 9 (60) | 12 (55) | |||
| Admission with LRI during 1st 3 years of life (%) | 11 (44) | 14 (30) | 0.303 | 4 (27) | 6 (27) | 1.000 | |
| Combined allergic disease (%) | |||||||
| Allergic rhinitis | 19 (76) | 31 (67) | 0.588 | 13 (87) | 15 (68) | 0.262 | |
| Atopic dermatitis | 12 (48) | 15 (33) | 0.216 | 6 (40) | 8 (36) | 1.000 | |
| Parental allergic disease (%) | 9 (36) | 22 (48) | 0.612 | 2 (13) | 7 (32) | 0.262 | |
| Atopic sensitization (%) | 22 (88) | 40 (87) | 1.000 | 13 (87) | 18 (85) | 1.000 | |
| House dust mite | 20 (90) | 34 (85) | 0.772 | 13 (100) | 18 (100) | 1.000 | |
| Tree pollen | 13 (59) | 21 (53) | 0.807 | 8 (62) | 6 (33) | 0.169 | |
| Grass pollen | 5 (23) | 10 (25) | 0.491 | 6 (46) | 5 (28) | 0.295 | |
| Weed pollen | 8 (36) | 17 (43) | 0.802 | 6 (46) | 3 (17) | 0.128 | |
| Mold | 8 (36) | 3 (8) | 0.013 | 1 (7) | 3 (17) | 0.633 | |
| Pet | 3 (14) | 2 (5) | 0.337 | 3 (23) | 5 (28) | 1.000 | |
| Food | 3 (14) | 6 (15) | 1.000 | 2 (15) | 3 (17) | 1.000 | |
| Polysensitization | 15 (68) | 27 (67) | 1.000 | 9 (69) | 11 (61) | 0.386 | |
| Total serum IgE (IU/mL), median (IQR) | 379 (223–699) | 238 (133–626) | 0.457 | 1101 (123–1885) | 314 (148–612) | 0.294 | |
| Eosinophil (count/mm3), median (IQR) | 561 (313–854) | 444 (259–704) | 0.356 | 553 (253–1227) | 583 (284–565) | 0.152 | |
| Body mass index (kg/m2) | 18.8±5.8 | 18.1±4.3 | 0.546 | 17.4±2.8 | 18.2±2.6 | 0.522 | |
| Pulmonary function test | |||||||
| FEV1 (%predicted) | 94±14.5 | 91±13.6 | 0.359 | 87±9.9 | 98±10.3 | 0.015 | |
| FVC (%predicted) | 93±9.8 | 90±12.6 | 0.231 | 83±10.6 | 91±14.3 | 0.194 | |
| FEV1/FVC (%) | 87±8.6 | 87±9.2 | 0.944 | 94±6.1 | 93±9.6 | 0.731 | |
| <90 | 15 (60) | 25 (54) | 0.803 | 3 (20) | 6 (28) | 0.711 | |
| ≥90 | 10 (40) | 21 (46) | 12 (80) | 16 (72) | |||
| Methacholine PC20 (mg/mL), median (IQR) | 2.3 (1.2–6.5) | 10.5 (6.3–13.8) | 0.000 | 2.6 (1.8–5.8) | 9.8 (6.4–14.3) | 0.007 | |
| <1, 1–4 | 15 (60) | 6 (13) | 10 (67) | 3 (14) | |||
| >4 | 10 (40) | 40 (87) | 5 (33) | 19 (86) | NA | ||
| Methacholine PC20 at follow-up (mg/mL), median (IQR) | 15.2 (3.7–19.2)a) | NA | 14.7 (4.1–20.3) | ||||
Values are presented as mean±standard deviation or number (%) unless otherwise indicated.
BHR, bronchial hyperresponsiveness; LRI, lower respiratory infection; IQR, interquartile range; FEV1, forced expiratory volume in 1 second; FVC, forced vital capacity; PC20, provocative concentration of methacholine causing a 20% fall in forced expiratory volume in 1 second; NA, not available.
Table 6.
| Variable |
Males (n=25) |
Females (n=15) |
||||
|---|---|---|---|---|---|---|
| aOR | 95% CI | P value | aOR | 95% CI | P value | |
| Mold sensitization | 7.718 | 1.243–41.440 | 0.028 | |||
| Methacholine PC20a) | 0.805 | 0.715–0.905 | 0.000 | 0.710 | 0.541–0.932 | 0.014 |


 PDF Links
 PubReader
 ePub Link
 PubMed
 Download Citation


