


Graphical abstract.
Introduction
The prevalence of obesity is rapidly increasing in both adults and children and carries economic consequences and the development of other chronic diseases [1,2]. Obesity is associated with the risk of noncommunicable diseases such as type 2 diabetes, hypertension, cardiovascular disease, heart failure, stroke, and several types of cancers [3,4]. All of these problems lead to a low quality of with increased health costs [2,5]. According to a report by the World Health Organization, 39 million children aged <5 years and 340 million children and adolescents aged 5–19 years were overweight or obese in 2016 [6], creating a global health issue. Compared with maintaining a healthy weight in childhood and adolescence, being obese in these periods may increase the risk of obesity in adulthood by up to 5 times [7]. Moreover, being obese during childhood and adolescence increases one’s metabolic and cardiovascular risks in adulthood [8].
The causes of obesity are complex and influenced by genetic, environmental, psychological, and socioeconomic factors [9]. Dietary modification is an important factor in weight loss; for example, dietary macronutrient composition, food selection, dietary patterns, and energy restrictions can affect weight loss [10]. Therefore, studies of intervention programs related to diet and lifestyle modifications for the treatment and improvement of obesity are continuously being conducted among children and adolescents [11-14]. Macronutrient composition reportedly affects body composition and metabolism-related markers [15-19]. On the other hand, hypocaloric diets, regardless of macronutrient composition, effectively induce weight loss and maintenance in obese children [20,21]. Accordingly, further studies are needed to determine whether macronutrient composition, rather than simple energy restriction, is more effective for weight loss. The optimal macronutrient composition may play an important role in growth and development during childhood and adolescence, in addition to regulating obesity [22,23]. It is also related to satiety, hunger, insulin sensitivity, and lipid metabolism [18,19,21,24], factors that are significantly associated with diabetes and cardiovascular disease.
In Korea, the prevalence of overweight and obesity among children and adolescents aged 2–18 years was 18.6% in 2017 [25]. In addition, this value increased in 2020 versus 2019 due to social and environmental factors and lifestyle changes caused by coronavirus disease 2019, especially among male adolescents aged 12–15 years [26]. Several studies reported that obese children in Korea have associated metabolic comorbidities, including metabolic syndrome, dyslipidemia, and elevated blood pressure [27]. Also, severely obese adolescents have abnormal metabolic risk factors, such as unfavorable lipid parameters, glycated hemoglobin values, and systolic blood pressures [28]. Despite the risk of obesity during childhood, few studies related to systematic reviews have reported an association between dietary macronutrient composition and the management of obesity in Korean children and adolescents. Therefore, this systematic review aimed to identify the optimal macronutrient composition for obese Korean children and adolescents.
Methods
1. Literature search strategy
In this systematic review, international databases such as PubMed and the Web of Science were searched for relevant articles. Our search strategy used the PICO framework (Participant, Intervention, Comparison, Outcome). The participants (population and patients) included children and adolescents with obesity. The intervention included a macronutrient-modified diet and improved dietary habits. The comparison included all possible groups. Finally, the outcomes included body composition, including obesity-related traits, lipid levels, and glycemic parameters. Based on our search strategy, we used the following keywords: (Obesity[MeSH Terms]) AND (((Adolescent) OR (Children)) NOT (Adults)) AND (Macronutrient) OR (Eating habit) AND (Body composition); (Obesity[MeSH Terms]) AND (((Adolescent) OR (Children)) NOT (Adults)) AND (Ketogenic diet) OR (Atkins diet) OR (Zone diet) AND (Body composition). We identified all relevant articles published between January 1, 2000, and January 7, 2023.
2. Eligibility criteria
Studies included in this systematic review satisfied the following criteria: (1) children or adolescents with obesity or overweight, but not adults; (2) comparison among macronutrient modification intervention groups; (3) randomized controlled trial (RCT); and (4) intervention period ≥3 months. The exclusion criteria were as follows:(1) books, proceedings, comments, editorials, or review articles that were not research articles; (2) unavailable articles; (3) no clinical trials; and (4) other diseases excluding obesity. The literature selection procedure following the inclusion and exclusion criteria was confirmed and discussed by the 2 authors.
3. Data extraction
Several traits were extracted from this systematic review. The extracted data were as follows: (1) first author and publication year;(2)investigation region;(3) subject information (number, sex, age, and body mass index [BMI]percentile);(4) intervention and follow-up duration;(5) dietary intervention type (diet intervention group, macronutrient distribution or consumption, and other dietary information); and (6) main findings, such as body composition and biochemical parameter changes. The 2 researchers discussed the information to be confirmed during the data extraction process.
4. Risk of bias
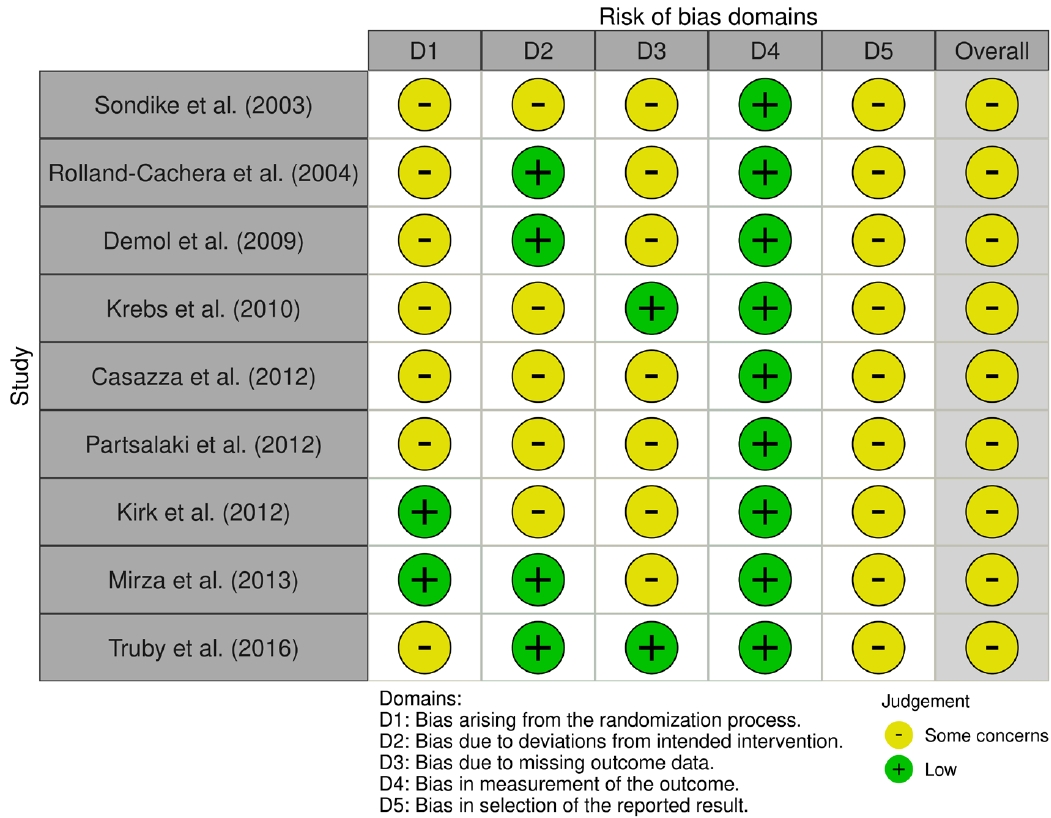
This study assessed study quality using the revised Cochrane Risk of Bias 2 tool for randomized trials (RoB 2) [29]. The RoB 2 tool confirmed several bias domains and signaling questions: bias arising from the randomization process, bias due to deviations from intended interventions, bias due to missing outcome data, bias in the measurement of the outcome, and bias in the selection of the reported result. Each question was answered using response options such as yes, probably yes, no, probably no, no information, and not applicable. According to these questions and answers, each study was assessed and judged for risk of bias, and the possible judgments were as follows: low risk of bias, some concerns, and high risk of bias. Furthermore, the Risk-of-Bias VISualization (robvis) tool [30] was used to visualize risk. All assessment procedures and risk of bias results were identified and discussed by the 2 researchers.
Results
1. Study selection
According to the search strategy, 2,192 articles were identified in the 2 databases (704 in PubMed, 1,488 in the Web of Science). After the removal of duplicate articles, the titles and abstracts of 2,078 articles were screened, of which 2,053 were excluded. Twenty-five articles that passed the screening and 6 additional articles cited in the literature were subjected to full-text screening. Among the 31 articles, 22 were excluded for the following reasons: (1) no macronutrient modification-based intervention (n=14); (2) non-RCT design (n=5); (3) short communication format (n=2); or (4) focus on other diseases (n=1). Finally, 9 studies were eligible for inclusion in this systematic review. Fig. 1 shows the flow diagram of studies for the systematic review based on the PRISMA (Preferred Reporting Items for Systematic reviews and Meta-Analyses) [31].
2. Risk of bias assessment
Traffic light and summary plots for the risk of bias assessment are shown in Figs. 2 and 3, respectively. The intention-to-treat or per-protocol method was used to analyze the included studies. Overall, studies showed “some concerns” about the risk of bias in at least one of the 5 domains. Briefly, they were categorized as having some concerns as follows. First, all studies were of RCT design, but several did not explicitly mention this. Thus, these studies were categorized as having some concerns in domain 1 (“bias arising from the randomization process”). Second, the studies conducted dietary interventions that modified the macronutrient composition and assigned participants to follow the prescribed diet, making it difficult to design a double-blind study. Therefore, these studies were categorized as having some concerns in domain 2 (“bias due to deviations from intended intervention”). Third, dietary interventions were conducted for children and adolescents; thus, it was difficult to perform a complete analysis owing to inevitable dropouts. Thus, these studies were categorized as having some concerns in domain 3 (“bias due to missing outcome data”).
3. Study characteristics
The characteristics of the 9 articles [32-40] included in this systematic review are shown in Table 1. The articles were published between 2003 and 2016 and conducted in the United States, France, Israel, Greece, and Australia. The study subjects were overweight or obese children and adolescents defined by BMI percentiles (>90th, >95th, or >97th percentile). In addition, one study defined obesity as primary obesity or ≥175% of the ideal weight (50th percentile) [35]. One other study used the BMI z score (1.60–2.65) [38]. The studies included 26–121 individuals and included both boys and girls except for one that included only girls [36]. Dietary interventions were conducted for at least 3 months (range, 12 weeks to 9 months). Some studies included a follow-up period after or including the intervention period, which is described separately. The dietary intervention involved modification of the macronutrient composition (Table 1).
4. Main findings of macronutrient modification intervention
All 9 studies showed improvements in body composition and/or lipid and glycemic parameters after the dietary intervention (Table 1). In 7 studies [33,34,36-40], BMI z scores, body fat mass, lipid profile, and glycemic parameters significantly improved after the dietary intervention, but no intergroup differences were noted. However, 2 other studies comparing low-carbohydrate (LC) and low-fat (LF) diets showed different results from the 7 diet groups [32,35]. Sondike et al. [32] reported that the mean post-intervention weight loss was greater in the LC than LF diet group; however, changes in lipid profiles did not differ significantly between them. The mean non–high-density lipoprotein cholesterol levels decreased in both diet groups after the intervention, but greater improvement was noted in the LC versus LF group. In addition, triglyceride levels significantly decreased in only the LC diet group, but no significant intergroup differences were observed. In contrast, LDL-C levels significantly improved from baseline in only the LF group. Krebs et al. [35] compared high-protein LC (HPLC) and LF diet groups and showed decreased BMI z scores in both. This reduction was maintained during the follow-up period. Despite similar energy intakes, the improvement was greater in the HPLC than LF diet group.
Discussion
This systematic review aimed to identify the optimal macronutrient composition in the diet for managing obesity in Korean children and adolescents,thereby providing basic evidence of its application in obesity management. Finally, 9 studies performed in various populations confirmed that macronutrient-modified interventions effectively managed overweight or obesity in children and adolescents. However, most showed that improvements in body composition and metabolic parameters were not significantly different among diet groups according to specific macronutrient composition.
However, 2 studies showed that the body composition improvements differed significantly between the dietary intervention groups. Sondike et al. [32] reported that the LC diet is more effective for short-term weight loss in overweight adolescents without caloric restriction or harmful effects on lipid profiles. Krebs et al. [35] reported that the HPLC diet group had a significantly greater reduction in BMI z scores than the LF diet group. Thus, the LC diet was more effective than the LF diet for weight loss. To date, many studies have investigated weight loss caused by LC intake. Similar to the results of our systematic review, the LC and Mediterranean diets were more effective than the LF diet for weight loss in obese adults [41]. A meta-analysis showed that an LC versus LF diet resulted in greater weight loss for up to 1 year [42]. In addition, LC diet consumers showed improved high-density lipoprotein cholesterol and triglyceride profiles compared to LF diet consumers [42]. However,the LC diet group showed higher low-density lipoprotein and total cholesterol levels than the LF diet group.
In contrast, Demol et al. [34] reported that LC diets with LF or HF effectively induced weight loss in obese adolescents but had no advantages over the high-carbohydrate LF diet. According to Truby et al. [40], the structured LF diet and structured-modified carbohydrate diet groups showed significant weight loss and improved body composition among obese adolescents compared to the control group, but no significant intergroup differences were noted. Given these contradictory results, further research is needed on the effects of different carbohydrate intake levels on body composition and metabolic parameters.
Similar to the results shown in most studies in this review, a systematic review showed that the effect of an LC diet on weight loss or cardiovascular risk factors in overweight and obese participants was not different from that of a balanced carbohydrate diet [43]. In addition, Casazza et al. [36] reported that a reduced-carbohydrate diet and a standard-carbohydrate hypocaloric diet improved the body weight and adiposity of overweight/obese girls; however, they were not significantly different in terms of weight loss. Kirk et al. [38] also demonstrated that adherence was significantly lower in the LC diet group than in other diet groups, such as the reduced glycemic load and portion-controlled group, suggesting that a long-term LC diet is difficult for obese children to maintain. In addition, although it is not serious, side effects such as headache and gastrointestinal discomfort have been observed in several studies [32,34,35]. Based on these results, further research needs to be conducted to elucidate whether a long-term LC diet is effective for weight control in obese children and adolescents.
Recommendations for the range of dietary macronutrient composition differ according to the national dietary guidelines and among the well-known diets worldwide. For example, the Atkins diet, a very LC diet, limits carbohydrate intake to 20, 40, and 100 g per day and recommends avoiding sugar, simple carbohydrates, and starchy foods [44,45]. Another popular LC diet, the Zone diet, comprises 40% carbohydrates, 30% protein, and 30% fat [44,46]. On the other hand, the 2020 Dietary Reference Intakes for Koreans (KDRIs) recommend the consumption of 55%–65% carbohydrate, 7%–20% protein, and 15%–30% fats from the total calorie intake [47]. In addition, data from the Korean Health and Nutrition Examination Survey showed that abdominal obesity in Korean adolescents was associated with a high fat intake but accounted for 24% of the overall energy intake [48], which is within the normal range recommended by the KDRIs [47]. Interestingly, a higher ratio of fat to energy intake was associated with abdominal obesity, particularly in Korean boys; also, LC intake was also associated with abdominal obesity [48]. However, this study had a cross-sectional design, which may indicate the need for an RCT to identify causality.
Our systematic review investigated several macronutrient-modified diets for improving obesity in children and adolescents. However, carbohydrate-modified diets are not more effective for weight loss than other diets [36,37]. Standard- and reduced-carbohydrate hypocaloric diets improved body composition, but their effects were not significantly different [36]. Also, ketogenic and hypocaloric diets reduced body weight, BMI, fat mass, and waist circumference in obese children and adolescents; however, the ketogenic diet was not more advantageous than the hypocaloric diet [37]. In other words, the modification of macronutrient composition may improve body composition, but the effect may be associated with the restriction of caloric intake rather than the macronutrient modification. Further research is needed to determine whether modifying dietary macronutrient composition is more beneficial than a hypocaloric diet in obese Korean children and adolescents. Moreover, optimal dietary macronutrient composition and calorie consumption for weight loss in obese children and adolescents should benefit their growth and development [23].
The prevalence of obesity in Korean adolescents aged 13–18 years increased significantly with an increase in obesity-related dietary habits such as unhealthy food intake and skipping breakfast [49]. In particular, skipping breakfast is reportedly associated with obesity and cardiometabolic risk factors [50,51]. On the other hand, Korean children with higher adherence to dietary guidelines have better diet quality and a reduced risk of obesity [52]. That is, the suggested dietary guidelines could contribute to reducing the risk of obesity. Similarly, an intervention of dietary-behavioral-physical activity promotion did not significantly affect BMI but improved nutrition and physical knowledge/preference and reduced the percentage of overweight children [53]. The multicomponent model of nutrition and lifestyle intervention also affected nutritional knowledge and improved body composition and biochemical parameters in adolescents [54]. Dietary interventions plus changes in physical activity and eating behaviors are more effective than dietary intervention only [55]. Also, customized nutritional interventions in children and adolescents with obesity reportedly have a positive effect on body composition [56]. A report by Rolland-Cachera et al. [33], included in our systematic review, demonstrated that increased body weight despite moderate energy intake after the intervention period might be associated with unhealthy behaviors. Based on these results, controlling eating habits and physical activity together with modulating optimal macronutrient composition in the diet can help obese adolescents maintain normal growth and development as well as a healthy body composition, which can be achieved through appropriate dietary education and dietary behavior education. In addition, as presented in the Korean guidelines for childhood and adolescent obesity, a family-based, multidisciplinary, and comprehensive approach is required to achieve behavioral interventions for obesity treatment [57]. Moreover, research using Korea National Health and Nutrition Examination Survey data showed an association between a high fat intake rate, even within the normal range of the KDRI, and abdominal obesity in Korean adolescents, although it was not an RCT [48]. In fact, this finding is contrary to the results [32,35] in this systematic review showing that LC was more effective at reducing body fat. This emphasizes the need to confirm the appropriate fat intake and macronutrient ratio for Korean children and adolescents, even if the KDRI score is within the normal range.
This study had several limitations. First, the number of studies included in the analysis was relatively small. In the future, additional meta-analyses are needed. Second, the intervention studies in this review were not double-blind in design due to diet traits and participant age. Thus, these studies were identified as having some concerns regarding the risk of bias. Modification of the RoB tool must be considered in such cases. Third, no studies have been conducted on Korean children or adolescents. Despite its several limitations, this systematic review confirmed that dietary macronutrient modification with an adequate energy intake can affect weight loss in obese children and adolescents and provides basic information about such interventions in Korean children and adolescents. In the future, more intervention studies with meta-analyses of Korean children and adolescents should be conducted to further elucidate this issue.


 PDF Links
 PubReader
 ePub Link
 PubMed
 Download Citation


